TIAUSDT | Still No Buyers—Maintaining a Bearish Outlook
TIAUSDT has been one of today’s top volume movers, with 24‑hour trading volume hitting around $63.6 million—a 48.7 percent jump from the previous day.
Yet despite this surge, genuine buying interest remains absent, and price action is unable to find footing.
🔴 First Resistance: The Red Box
• This red box marks the first major zone where sellers have consistently defended price.
• Any rally into this area should be treated as a short opportunity—provided you see clear lower‑time‑frame breakdowns and CDV confirming sell‑side dominance.
📉 How Much Further Could It Fall?
I can’t predict the exact bottom—no one can. What I do know is that until buyers step up, downward pressure is likely to continue. Watch for each bounce to stall at resistance and use that as your cue to enter or add to shorts.
🤝 Key Trading Rules to Follow
Confirmation is Everything
Wait for a clean LTF breakdown inside the red box, with CDV divergence or rising sell volume. No confirmation means no trade.
Adaptive Bias
I will not insist on my short idea. If TIA breaks above this red box with volume and then retests it as support, I will shift to a long bias. Otherwise, my view stays bearish.
Risk Management
Keep stops just above the red box. Trade only what the market shows you—never chase.
This approach is built on watching real order flow and market behavior, not guessing. If you want to align yourself with a strategy that filters out noise and focuses on high‑probability setups, you’re in the right place.
📌I keep my charts clean and simple because I believe clarity leads to better decisions.
📌My approach is built on years of experience and a solid track record. I don’t claim to know it all but I’m confident in my ability to spot high-probability setups.
📌If you would like to learn how to use the heatmap, cumulative volume delta and volume footprint techniques that I use below to determine very accurate demand regions, you can send me a private message. I help anyone who wants it completely free of charge.
🔑I have a long list of my proven technique below:
🎯 ZENUSDT.P: Patience & Profitability | %230 Reaction from the Sniper Entry
🐶 DOGEUSDT.P: Next Move
🎨 RENDERUSDT.P: Opportunity of the Month
💎 ETHUSDT.P: Where to Retrace
🟢 BNBUSDT.P: Potential Surge
📊 BTC Dominance: Reaction Zone
🌊 WAVESUSDT.P: Demand Zone Potential
🟣 UNIUSDT.P: Long-Term Trade
🔵 XRPUSDT.P: Entry Zones
🔗 LINKUSDT.P: Follow The River
📈 BTCUSDT.P: Two Key Demand Zones
🟩 POLUSDT: Bullish Momentum
🌟 PENDLEUSDT.P: Where Opportunity Meets Precision
🔥 BTCUSDT.P: Liquidation of Highly Leveraged Longs
🌊 SOLUSDT.P: SOL's Dip - Your Opportunity
🐸 1000PEPEUSDT.P: Prime Bounce Zone Unlocked
🚀 ETHUSDT.P: Set to Explode - Don't Miss This Game Changer
🤖 IQUSDT: Smart Plan
⚡️ PONDUSDT: A Trade Not Taken Is Better Than a Losing One
💼 STMXUSDT: 2 Buying Areas
🐢 TURBOUSDT: Buy Zones and Buyer Presence
🌍 ICPUSDT.P: Massive Upside Potential | Check the Trade Update For Seeing Results
🟠 IDEXUSDT: Spot Buy Area | %26 Profit if You Trade with MSB
📌 USUALUSDT: Buyers Are Active + %70 Profit in Total
🌟 FORTHUSDT: Sniper Entry +%26 Reaction
🐳 QKCUSDT: Sniper Entry +%57 Reaction
📊 BTC.D: Retest of Key Area Highly Likely
📊 XNOUSDT %80 Reaction with a Simple Blue Box!
📊 BELUSDT Amazing %120 Reaction!
I stopped adding to the list because it's kinda tiring to add 5-10 charts in every move but you can check my profile and see that it goes on..
TIAUST trade ideas

Tia short o $2.39Just now opened a short trade on tia.
Target: $2.39
Roughly 3RR from my entry.
Time sensitive.
Anticipating impulsive break to downside

TIA NEXT TERMMy scenario is like this.
* The purpose of my graphic drawings is purely educational.
* What i write here is not an investment advice. Please do your own research before investing in any asset.
* Never take my personal opinions as investment advice, you may lose your money.

The key is whether it can rise above 3.211
Hello, traders.
If you "Follow", you can always get new information quickly.
Have a nice day today.
-------------------------------------
(TIAUSDT 1D chart)
The basic trading strategy is to buy near the HA-Low indicator and sell near the HA-High indicator.
However, if the HA-Low indicator falls, there is a possibility of a stepwise downtrend, and if the HA-High indicator rises, there is a possibility of a stepwise uptrend.
Therefore, when the HA-Low indicator is first created, the probability of rising is higher than the probability of falling, and when the HA-High indicator is first created, the probability of falling is higher than the probability of rising.
If the HA-Low indicator rises and then meets the previously formed HA-Low indicator again, the probability of falling is higher.
On the contrary, the HA-High indicator has a higher probability of rising.
You should check the movement of the chart with these characteristics in mind.
However, you should comprehensively judge the correlation between the OBV indicator and the StochRSI indicator.
-
From a trend perspective, since the M-Signal of the current 1D chart is < M-Signal of the 1W chart, you can see that it is in a reverse arrangement.
Therefore, when trading in a reverse arrangement, it is recommended to trade for a short period of time using day trading.
Therefore, if it shows a price that rises above the M-Signal indicator of the 1W chart and maintains the price, it is highly likely that a trend will be formed that can be traded.
In other words, when looking at the current price position, it can be seen that it can be traded for a short period of time or longer only when it rises above 3.211 and shows support.
-
Since the HA-Low indicator is formed at the 2.490 point, the price must be maintained above this point.
If not, there is a possibility of an additional stepwise downtrend, so you should think about a countermeasure for this.
-
If the average purchase price is significantly higher than the current price, you should not buy too much and increase your investment ratio.
In this case, it is better to trade with a relaxed mind and faithfully follow the basic trading strategy.
However, it is better to trade by increasing the number of coins (tokens) corresponding to the profit realization method and increasing the number of coins (tokens).
In other words, trade by purchase price.
If you bought 100 USDT at the current price of 2.840, you should sell 100 USDT when the price rises and shows resistance at 3.211.
In this case, only the number of coins (tokens) corresponding to the profit will remain.
At this time, you should be careful about the transaction fee.
Since you have to sell the purchase amount including the transaction fee, the actual selling amount when you place an order is not 100 USDT.
The transaction fee rate varies depending on the exchange.
For example, if the trading fee is 0.1%, you can trade 100USDT - (100USDT x 0.2%) = 99.8USDT.
-
Thank you for reading to the end.
I hope you have a successful trade.
--------------------------------------------------
- Here is an explanation of the big picture.
(3-year bull market, 1-year bear market pattern)
(3-year bull market, 1-year bear market pattern)
I will explain the details again when the bear market starts.
------------------------------------------------------

TIAUSDT: Multi-Timeframe Analysis (4H-15m)positioned after a confirmed rejection from a high-probability bearish reversal zone (OTE/Liquidity Voids). This reinforces the overarching bearish market structure established on higher timeframes.

My personal analysis and opinion for TIAIt's just a personal opinion
According to the news, any process can be ruined.
Good luck

TIA short trade idea: price failed to hold range mid, weakness, BTC likely going to fill 50% of yday daily wick, total3 also lower likely

Tia to dump even more todayJust recently opened a short position on Tia. targeting $2.391 rea
Market tried to pump today but got rejected strongly , flipping to a downtrend structure on lower tf signaling that the correction is not over.
$2.391 seems to be the next most probable target to fall to- weekly support area as we approach weekly closure

TIA long Close to range lows again in key area box, run it up to range mid normal scale or make new lows

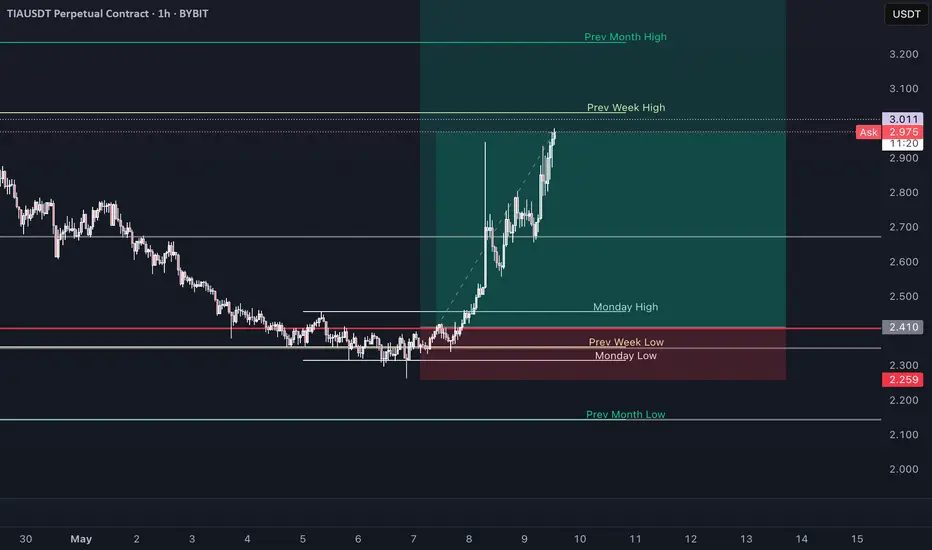
Tia swing long back to $3.335Just opened a swing long position on #Celestia
🎯Target: $3.335
🛑Stop: $2.614 or lower
#tiausdt #tia LSE:TIA

$TIA pullback looks healthy for next leg up !!LSE:TIA is retesting the breakout zone perfectly
After a clean breakout from the falling wedge structure, the price is now pulling back into the key demand area.
I expect this zone to hold and if it does, we could see a strong move toward $5+ in the coming days.
Keep a close eye on this level, the next move could be explosive! 🚀
Like & Retweet if you're bullish!
#TIA #CRYPTOMOJO_TA


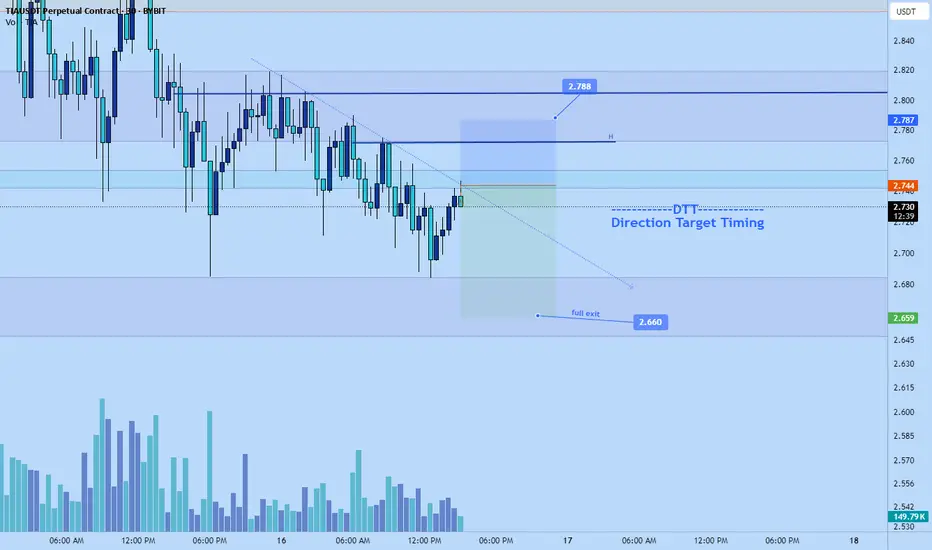
Tia scalp short to $2.66 today!Entered #tia scalp short just now
Target: $2.66
Roughly 2RR
Stop: $2.787 or higher
the fish pattern on the TIA USDT as described ont the chart/
the entry zone are mentionned in the chart in green lines
DYOR NFA .
Happy trading

TIA : last dump before mooningafter analysis as described on the chart tia will vsiist the 1$ levels.
Place the trade as described in the chart :
i m not putting any stop lose :
i enter with 50% of the capital :
each small dump i add a 10% from the first capital so i have 5 more entries:
=======> this is not a financial advice .
happy trading for u all and happy day

TIA SIGNALSHello friends
As you can see, this currency has a beautiful chart and the technical analysis we did is that if the valid resistance is broken, we can open a buy trade with capital and risk management and move with it to the specified targets.
*Trade safely with us*

Tia scalp short to $3.233Just now opened a scalp short position on tia. Targetting 3.233 area
Time sensitive
$3.42 stop or higher
Roughly 2RR from my entry. Likely lower for anyone just seeing this unless use tighter stop

TIA Breakout confirmed.Successfully breakout this resistant line with a short -term target of at least +10%

Celestia is dumping before bulish seasonas described on the chart we will see the last bearish season to the the green zone before goin up as described
NOT FA DYOR
happy trading
TIA/USDT Weekly Analysis – Is a Breakout Brewing?TIA has been in a multi-week downtrend, respecting the red descending channel. Recently, it's been holding support in the $2.17–$2.25 range (green zone). Price has tested this zone multiple times and is showing signs of stability here.
To flip bullish, TIA needs to break above the $2.88 resistance zone (red trendline). That would be the first real sign of a trend shift.
If it clears $2.88 with volume, the next target is around $4.50 — which lines up with a previous supply zone and offers around 45% upside from the breakout.
Still inside the broader downtrend channel, so we need to stay cautious until we see a proper breakout and retest. Losing the $2.17 support zone could lead to further downside into the lower green trendline.
Key levels:
Support: $2.17 – $2.25
Resistance: $2.88 (trendline)
Target after breakout: ~$4.50
Watching closely for a breakout or breakdown from this range.

TIA long range highs TIA long 5.7R final Tp hit on range mid log scale. Looking for a rejection into range mid normal scale -> reclaim -> range highs with 12345 EW

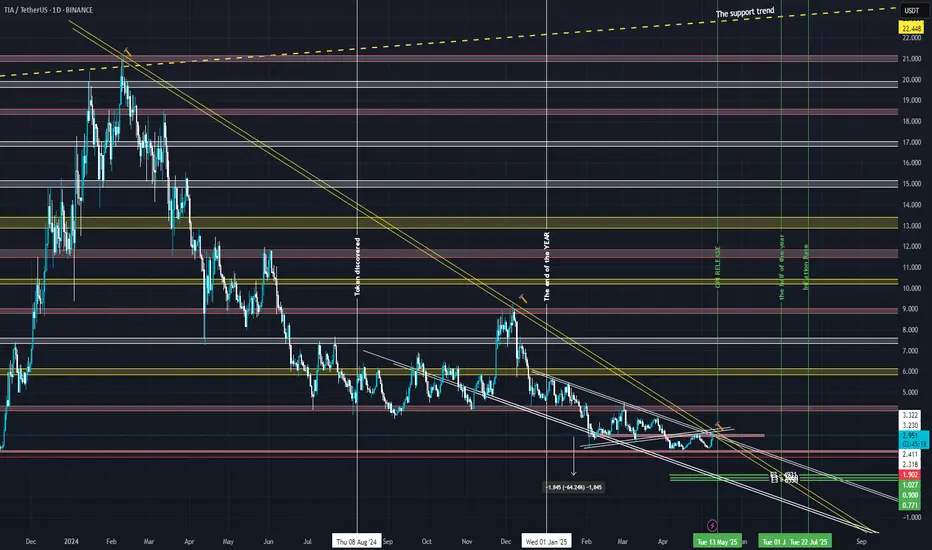
TIA Secondary trend. Wedge. Reversal zone. 09 05 2025Logarithm. Time frame 3 days. The price dropped to the listing price zone, namely the level of 2.309. In this zone, the decline stops and the transition to consolidation - sideways. The decline formed a full-fledged descending wedge. This is a bullish pattern in cases of a breakthrough of its resistance (in most cases).
When working with such hype cryptocurrencies, observe money management. Now in “investors” more than 200-300 X, who always sell without loading the glass, but somewhere more, and somewhere less, under the market as a whole. I would advise you to work with the wedge that has now formed and "down-to-earth", logical goals, after exiting it and the consolidation zone.
Main trend. TIA (Celestia) Main trend. Maximum targets of the cycle. XXL+10Х
Line chart of prices, for clarity of the secondary trend, the descending wedge and the potential reversal zone.
