$TIAUSDT | Long from #1D Block📌 Current Situation:
Confirmed Rebound: The price initially broke below the 1D support (deviation), but yesterday’s daily close confirmed a level reactivation.
Reversal Pattern Formation: A potential double bottom or an Inverse Head and Shoulders is developing.
🎯 Trading Plan:
🔹 Entry Zone: Limit orders on the retest of the 1D block at $3.82 - $3.64.
🔹 Stop-Loss: Below $3.53.
🔹 Target: Upside towards $6.00+ (liquidity zone).
📈 Justification:
✅ 1D Block Support: The price is retesting a key daily demand zone.
✅ Deviation and Rebound: A classic trend reversal model after weak long liquidations.
✅ Risk/Reward: Well-defined R/R ratio with a clear invalidation level.
💡 Conclusion:
LSE:TIA is showing strong signs of recovery, but it's crucial to wait for the retest before entering the trade. Given the broader market context, the chances of a successful long setup appear promising. 🚀
TIAUST trade ideas

Celestia Short-Term Bullish Target Goes Beyond 200%This is another pair that is bullish and is now about to produce a strong advance while Bitcoin crashes. Bitcoin isn't going any lower, or, I should say, TIAUSDT is about to move up.
TIAUSDT is trading above EMA8 and EMA13 on the daily timeframe.
The previous peak happened in February 2024.
The most recent bottom happened in February 2025. That's a full year of bearish action.
There was a strong correction in the form of a bearish impulse. This bearish impulse was followed by a sideways market. The sideways market produced a small bullish breakout and later a lower low to reach this present day. Present day, TIAUSDT is bullish and about to go up. The targets can be found on the chart. Here we have an easy 216% target and up to 378% short-term.
Thank you for reading.
Namaste.

TIA LONGTaking a long inside the obvious demand zone and a HTF FVG in LSE:TIA , I expect it to get filled within a few days, if not I will reshare a new plan. TP and SL are visible on the chart

celestia new dip incoming if btc close below 85Kif btc close below 85K we will see tia dumping as demonstrated on the chart .
DYOR and NFA .
Happy trading for u all .

TIAUSDT - Tears apart!I wonder what made TIA BOOOM, But not here, OPT for small scalps throughout and follow for the nPoC

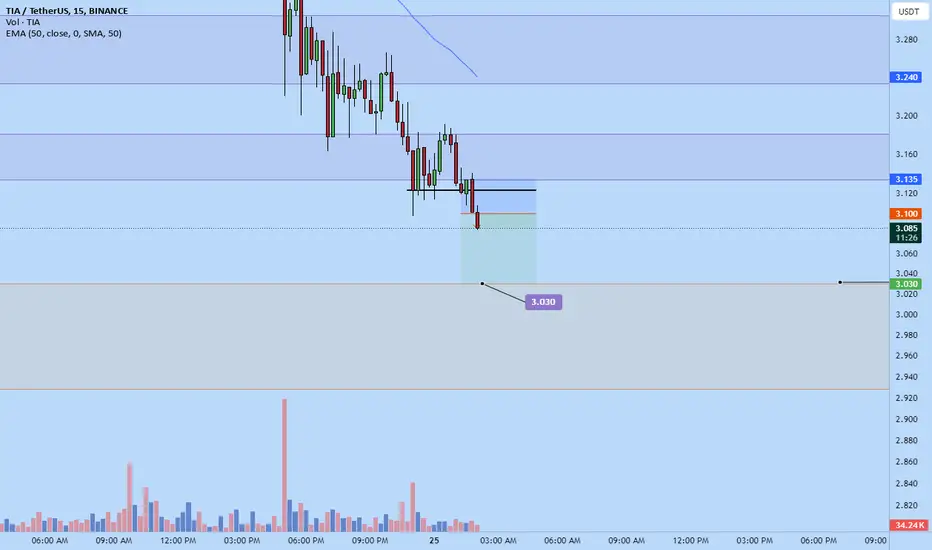
Tia scalp shortJust opened this scalp short on tia a while ago.
Target $3.030 area.
Time sensitive, already moving away
TIA Update Celestia (TIA) is the first modular blockchain network that enables anyone to easily deploy their own blockchain with minimal overhead , 3.5$ is the key , keep watching 👀

TIA 3DLSE:TIA 3D;
It continues its course just above the discount level and at the same time continues its movement towards a strong wedge contraction.
In order for an uptrend to start, a daily close above $5.7 is needed in the first place. In order to say that the main trend has returned, a closing above $9.3 is required.
#celestia #tia

#TIA/USDT#TIA
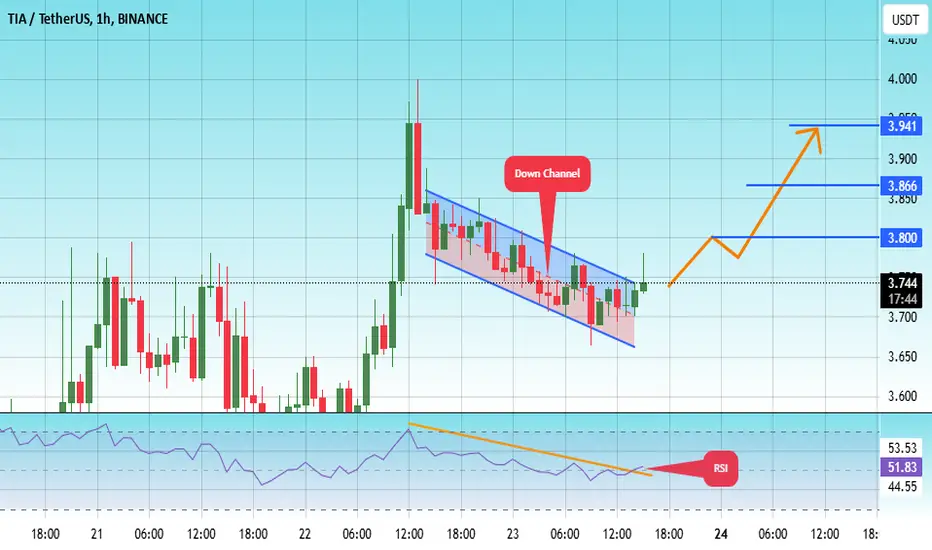
The price is moving in a descending channel on the 1-hour frame and is adhering to it well and is heading to break it upwards strongly and retest it
We have a bounce from the lower limit of the descending channel, this support is at a price of 3.67
We have a downtrend on the RSI indicator that is about to break and retest, which supports the rise
We have a trend to stabilize above the Moving Average 100
Entry price 3.74
First target 3.80
Second target 3.86
Third target 3.92
TIA target $5.64h time frame
-
Entry: $2.96
TP: $5.64
SL: $2.66
RR: 8.77
-
(1) TIA is still correcting and building the bottom structure after dump on 3rd Feb.
(2) Double bottom is one of the possible structure, the potential right leg is $2.9
(3) Fibonacci provides first target at $4.5 and final target at $5.6
(4) Stop loss once going below $2.66

TIA (Celestia); my notes for long-termA quality project that I have been following for a long time to buy from the bottom, but it has fallen to unreliable levels. The chart has become difficult to interpret.
I do not think it is safe unless it maintains its permanence above the $4.1 level, it may fall to the 2.. levels again. It can be considered for the long term as soon as it starts to provide reliable data above the $4.1 level. In a positive scenario, the 9.5 - 14.5 levels are very important profit-taking points. If it continues to receive investments above these levels and the data is positive when reviewed again, it can try a new ATH.
I do not see anything else to comment on at the moment, a good project but weird charts and price movements...
It is not investment advice.

The Last Dump Befor MooningAs illutrated in the image we see that we will have a big dump before going up and before to altseason.DYOR
Entry are described in the image
Happy trading for you all

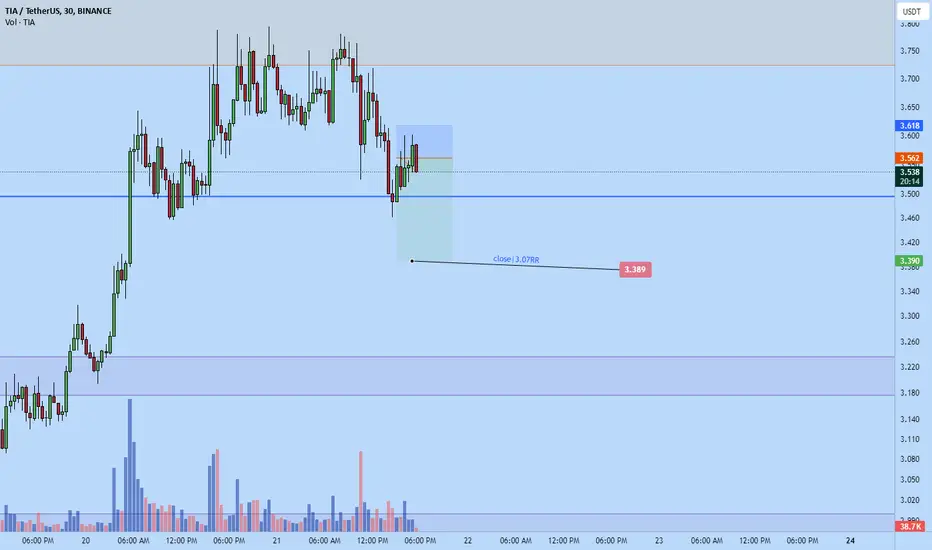
Celestia scalp short to $3.389I just now opened a short on tia usdt.
I anticipate that will dump dump some more before the daily close to $3.389
Then afterwards correct a bit before continuing down.
LongAccording to the analysis of the waves and the help of the Gann method, it can be expected that the price will return to the green zone again.
This is my personal opinion. Please don't use it as your trading criteria. Good luck


TIA - Long Trade IdeaTIA could shoot up to 3.9–$4, but would love to see a retest at $3.30–$3.50 afterward for possible long re-entry
Targets:
$3.90
$4.38
$4.84
Stoploss below $3.14

TIA/USDTKey Level Zone: 3.180 - 3.2000
HMT v6 detected. The setup looks promising, supported by a previous upward/downward trend with increasing volume and momentum, presenting an excellent reward-to-risk opportunity.
HMT (High Momentum Trending):
HMT is based on trend, momentum, volume, and market structure across multiple timeframes. It highlights setups with strong potential for upward movement and higher rewards.
Whenever I spot a signal for my own trading, I’ll share it. Please note that conducting a comprehensive analysis on a single timeframe chart can be quite challenging and sometimes confusing. I appreciate your understanding of the effort involved.
Important Note :
Role of Key Levels:
- These zones are critical for analyzing price trends. If the key level zone holds, the price may continue trending in the expected direction. However, momentum may increase or decrease based on subsequent patterns.
- Breakouts: If the key level zone breaks, it signals a stop-out. For reversal traders, this presents an opportunity to consider switching direction, as the price often retests these zones, which may act as strong support-turned-resistance (or vice versa).
My Trading Rules
Risk Management
- Maximum risk per trade: 2.5%.
- Leverage: 5x.
Exit Strategy
Profit-Taking:
- Sell at least 70% on the 3rd wave up (LTF Wave 5).
- Typically, sell 50% during a high-volume spike.
- Adjust stop-loss to breakeven once the trade achieves a 1.5:1 reward-to-risk ratio.
- If the market shows signs of losing momentum or divergence, ill will exit at breakeven.
The market is highly dynamic and constantly changing. HMT signals and target profit (TP) levels are based on the current price and movement, but market conditions can shift instantly, so it is crucial to remain adaptable and follow the market's movement.
If you find this signal/analysis meaningful, kindly like and share it.
Thank you for your support~
Sharing this with love!
HMT v2.0:
- Major update to the Momentum indicator
- Reduced false signals from inaccurate momentum detection
- New screener with improved accuracy and fewer signals
HMT v3.0:
- Added liquidity factor to enhance trend continuation
- Improved potential for momentum-based plays
- Increased winning probability by reducing entries during peaks
HMT v3.1:
- Enhanced entry confirmation for improved reward-to-risk ratios
HMT v4.0:
- Incorporated buying and selling pressure in lower timeframes to enhance the probability of trending moves while optimizing entry timing and scaling
HMT v4.1:
- Enhanced take-profit (TP) target by incorporating market structure analysis
HMT v5 :
Date: 23/01/2025
- Refined wave analysis for trending conditions
- Incorporated lower timeframe (LTF) momentum to strengthen trend reliability
- Re-aligned and re-balanced entry conditions for improved accuracy
HMT v6 :
Date : 15/02/2025
- Integrated strong accumulation activity into in-depth wave analysis

TIA/USDThello friends
According to the arrival of buyers, we can enter into the transaction with capital and risk management.
*Trade safely with us*

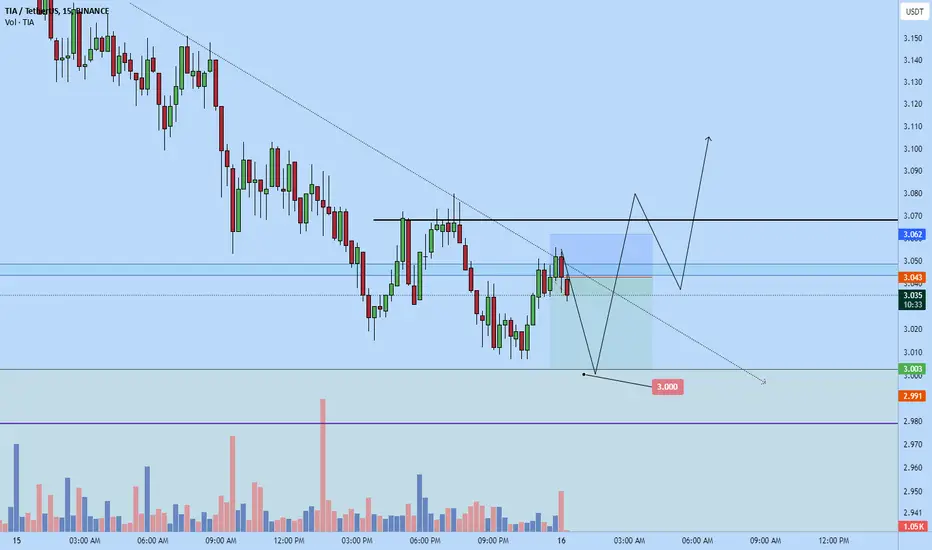
Tia scalp short $3.00Jut now entered a Tia short . My target is $3.000
Maybe am too late to post now as its falling.
Have to be fast if anyone interested.
Tia scalp long to $3.31Just now opened a scalp long position on Tia. I think the market will retested the wick highs before potentially reversing...or who knows it might continue to pump more but that's my target for tonight.

Tai short to $3018Just now opened a tia short.
I think it will fall down to $3018 area...maybe lower but I don't want to hold further than that as I anticipate some decent demand might come in there

TIA Price at Crucial ATL Support: Rebound or New Lows Ahead?TIA Price Analysis
TIA is currently testing its All-Time Low (ATL) horizontal support, a critical level that could determine the next major price movement.
Support Zone: The price is holding near the ATL support, historically acting as a strong demand area.
Potential Rebound: If this support holds, we could see a recovery targeting the $4.20–$4.60 resistance zone.
Bearish Risk: A breakdown below this support would likely trigger further downside, potentially reaching new lows.
The price action near this key level should be closely monitored to confirm the next trend direction.
#TIA #Crypto #TechnicalAnalysis

TIA SHORT/LONGTIA has dropped below $3.7, the lower boundary of its range, which isn't necessarily a bad thing.
If the price manages to reclaim $3.7, it would confirm a major fakeout, potentially pushing the price back up to $5-$6.
In the short term, we might see a small bounce toward the 21 EMA on the daily timeframe, accompanied by a bullish cross on the Stoch RSI.
After that, another pullback could happen, setting up a second bullish cross on the Stoch RSI—which, historically, has often led to stronger upward moves.
