Buy TIATIA has been consolidating around the Fib 0.618 and 0.5 areas for 6 months.
I buy here with TPs and SL mentionned in chart.
Disclaimer:
This analysis is based on my personnal views and is not a financial advice. Risk is under your control.
TIAUST trade ideas

TIA (Celestia) Main trend. Maximum targets of the cycle. XXL+10XLogo of rhymes. Time frame 3 days. Everything is shown and described on the price chart of this pre-planned super hype, to earn super profits out of nothing.
"Collected" (principle and scheme of deception) for 7 rounds of financing (the principle of the "access pyramid") - $ 156.5 million. This is the principle of super pumping and listing on exchanges for super huge profits of almost all hype assets since 2020.
Under the logic of the chart, as a rule, they pull under the general trend of the market cycle by another + 800-1000%. According to the chart, the average price between accumulation and distribution of the cycle is usually 500-800%. The main thing is to keep the logic of the chart under the general market cycle (for constant small, imperceptible sales). Such assets are constantly sold in trend, which is logical, there is no difference between 50x -100x - 1000X.
No matter how funny and illogical it may sound, while the “whales” are selling, you can be in the asset and be safe. When sales stop, that is, there is no interest in maintaining the hype, the prospects of the legend and the liquidity of the asset for sales, - a sharp (hack, break-in, or other fiction - justification for "closing the project") or slow death (the asset loses major players and demand / supply is given into the hands of “the majority of those waiting for XXX, who will never be”), that is, depreciation and scam.
The previous legend of prospects does not matter, as the focus of attention of the crowd shifts to other freshly created similar assets and marketing to attract “fresh blood” of new stupid money. All new assets are created, and most importantly advertising, at the expense of profits from the previous ones, only on a large scale. This is a disguised Ponzi scheme, which everyone agrees with, as they are sure that they will not be “the last”.
Linear for clarity.
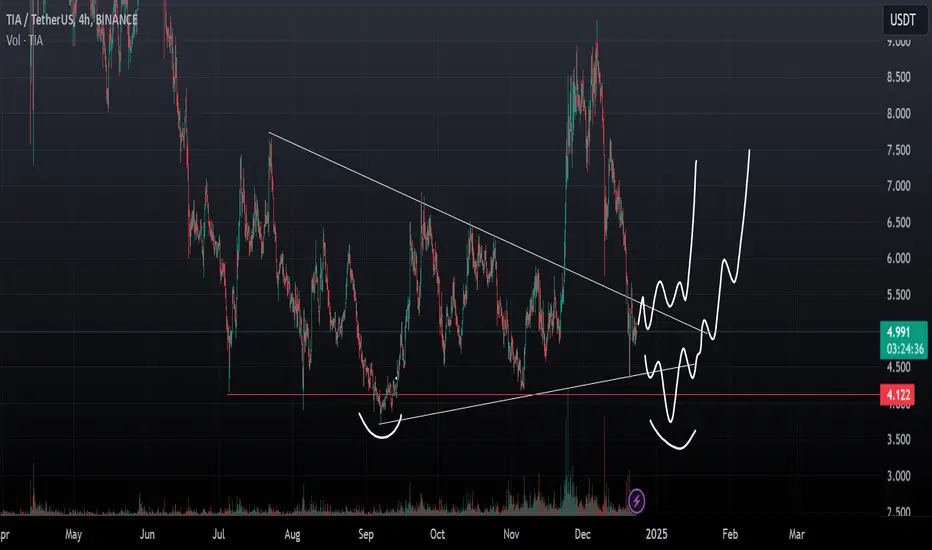
Local game.

#Tiausdt 20$ soon we can see BINANCE:TIAUSDT / BINANCE:TIAUSDT.P
### 1. Price Action
- The chart displays a recent downtrend that has potentially reached a local bottom.
- The price is currently trading at 5.181.
- A significant support zone is marked in green near 4.343, extending lower to around 3.722. This suggests strong buying interest in this region.
- Resistance zones are clearly identified in the chart:
- First resistance (Target 1) at 7.585.
- Historical resistance zone near 9.350, where the price previously reversed.
### 2. Trend Analysis
- The price has bounced from the support zone near 4.343, indicating a possible reversal to the upside.
- A higher low formation is expected if the price continues upward momentum, confirming the trend reversal.
### 3. Technical Levels
- Support Levels:
- Strong support near 4.343.
- Secondary support around 3.722 (lower range of the marked green zone).
- Resistance Levels:
- Immediate resistance at 7.585.
- Secondary resistance near 9.350 (previous high).
### 4. Potential Price Path
- A corrective movement to form a higher low before reaching 7.585 is anticipated based on the drawn path.
- If the price breaks and holds above 7.585, it could potentially target 9.350.
### 5. Volume Analysis
- Although volume data is not visible on this chart, observing volume increases near the support zone can confirm buying pressure.
### 6. Possible Scenarios
- Bullish Scenario:
- If the price holds above the 4.343 support and breaks above 7.585, it can target 9.350 and beyond.
- Bearish Scenario:
- If the price fails to hold 4.343, it may retest the 3.722 support.
### 7. Additional Indicators:
- MACD: Check if it shows bullish divergence near the support zone.
- RSI: Look for oversold conditions near the bottom to confirm reversal strength.
- Fibonacci Levels: Use Fibonacci retracement to align potential reversal levels.
### 8. Trading Strategy
- For Buyers:
- Enter near the 4.343 support with a stop-loss below 3.722.
- Target 1: 7.585.
- Target 2: 9.350.
- For Sellers:
- Watch for price rejection near 7.585 or 9.350 for shorting opportunities.

TIA NEW UPDATE (1D)Due to tokenomics issues, TIA dropped along with the market.
Now, we’ve prepared a new update for TIA. At each target, secure a portion of your profit and lock it in.
By analyzing the TIA chart, it appears to be forming a large diametric pattern.
This diametric is likely part of wave D.
It seems TIA intends to form wave E of this diametric.
As long as the green zone is maintained, it can move towards the targets.
The targets are marked on the chart.
Closing a daily candle below the invalidation level will invalidate this analysis.
For risk management, please don't forget stop loss and capital management
Comment if you have any questions
Thank You

TIA AS SOON AS POSSIBLEBased on the chart I created, here’s my analysis and the potential next steps for the Celestia (TIA/USDT) pair:
1. Support Area:
I’ve identified a strong support zone around 4.370 - 4.653 USDT . This area looks promising for a BUY opportunity, as support levels often act as key reversal points where price tends to bounce back.
2. Potential Price Movement:
The Take Profit level is set at 4.950 USDT , offering a potential gain of approximately 8.45% from the lower bound of the support area. If the price respects this support zone, it’s likely to move toward this target.
3. Trading Strategy :
- Buy Zone : I plan to enter a position near or within the support range (4.370 - 4.653 USDT) while monitoring volume and looking for bullish candlestick confirmations.
- Stop Loss: To manage risks, I’ll set a stop loss slightly below the support level, around 4.300 USDT, to protect against potential breakdowns.
- Take Profit: My target is at 4.950 USDT, aligning with the nearest resistance level.
4. Additional Considerations:
- If the price breaks above 4.950 USDT, there could be additional upside potential, so I’ll keep an eye on market sentiment and trading volume for confirmation.
- However, if the price falls below the support zone, I’ll hold off on taking further action until a new setup or support level emerges.
This plan is based on the current technical structure of the chart. I’ll also stay updated on any news or developments related to Celestia (TIA), as they could significantly influence the price movement.

Tia is good position for buying hello guys
This token is placed in a small bullish back channel after a deep correction.
According to the definition of the support range of the bottom of the channel, we expect it to grow up to the specified goals in a short period of time.
This analysis is only technically reviewed.
Be successful and profitable.

TIAUSDT Long on 1H.TIAUSDT has been in downtrend on 4H and 1H timeframes. However it has broken the trendlines upwards alongwith making a bullish divergence on RSI on the 1H timeframe. Considering the existing levels of price, it is still within resistance zone (R1). Upon upward break of R1, a long entry shall be triggered riding the wave upto R2. Long position with RRR of 1:1 has been marked on chart. Good luck.

TIA - Bullish Pullback into SupportMACD and RSI Bullish crossover imminent as the price action back tests the breakout of descending trendline.

TIATrendline Respect: The price has shown consistent respect for the established trendlines within the descending channel. These trendlines have acted as significant guides for the price movement, reflecting a clear structure in the market's behavior.
Potential Breakout: As the price narrows near the convergence of the descending trendline and support, there is a strong likelihood of a bullish breakout.
Future Movement: If the breakout occurs above the descending trendline, the price could see a sharp upward movement, potentially targeting higher resistance levels. This is depicted in the chart as a zig-zagging upward projection.
Confirmation Needed: Before any sustained bullish movement, confirmation of the breakout above the resistance trendline is critical. Traders should wait for price stability and volume increase as validation of the breakout.

#TIA (SPOT) entry ( 4.200- 4.800) T.(14.000) SL(4.161)BINANCE:TIAUSDT
#TIA/ USDT
Entry ( 4.200- 4.800)
SL 1D close below 4.161
T1 6
T2 10
T3 14
______________________________________________________________
Golden Advices.
********************
* collect the coin slowly in the entry range.
* Please calculate your losses before the entry.
* Do not enter any trade you find it not suitable for you.
* No FOMO - No Rush , it is a long journey.
Useful Tags.
****************
My total posts
www.tradingview.com
1Million Journey
www.tradingview.com
www.tradingview.com
**********************************************************************************************
#Manta #OMNI #DYM #AI #IO #XAI #ACE #NFP #RAD #WLD #ORDI #BLUR #SUI #VOXEL #AEVO #VITE #APE #RDNT #FLUX #NMR #VANRY #TRB #HBAR #DGB #XEC #ERN #ALT #IO #ACA #HIVE #ASTR #ARDR #PIXEL #LTO #AERGO #SCRT #ATA #HOOK #FLOW #KSM #HFT #MINA #DATA #SC #JOE #RDNT #IQ #CFX #BICO #CTSI #KMD #FXS #DEGO #FORTH #AST #PORTAL #CYBER #RIF #ENJ #ZIL #APT #GALA #STEEM #ONE #LINK #NTRN #COTI #RENDER #ICX #IMX #ALICE #PYR #PORTAL #GRT #GMT #IDEX #NEAR #ICP #ETH #QTUM #VET #QNT #API3 #BURGER #MOVR #SKL #BAND #ETHFI #SAND #IOTX #T #GTC #PDA #GMX #REZ #DUSK #BNX #SPELL #POWR #JOE #TIA

3 Emerging Crypto to watch in 2025Since you enjoyed my previous post about 3 Crypto OGs to watch this month...
Here's an interesting one about 3 Emerging Crypto to watch in 2025:
BINANCE:ARBUSDT
ARB rejected a strong a strong support and demand zone marked in red.
Waiting for a break above $0.85 structure marked in blue to activate the next bullish impulse towards the $1.5 mark.🎯
BINANCE:TIAUSDT
TIA rejected a strong a strong support and demand zone marked in red.
Waiting for a break above $5.7 structure marked in blue to activate the next bullish impulse towards the $10 mark.🎯
BINANCE:MKRUSDT
MKR rejected a strong a strong support and demand zone marked in red.
Waiting for a break above $1700 structure marked in blue to activate the next bullish impulse towards the $2500 mark.🎯
Which altcoins would you like me to cover next?
All Strategies Are Good; If Managed Properly!
~Rich


TIA Confusing PatternTIA back to inside triangle area after performing double top
This is confuse cz back to range area of accumulation zone
With massive downside before i think it could be time if this coin pumping again
many market makers still want to accumulate more
TIA Head and ShouldersKUCOIN:TIAUSDT price action suggests that it is retesting the neckline of a reversal pattern Head and Shoulders with potential to hit 20.7. Use spot to buy not futures. NFA. DYOR.

$tia- swing at range low
rsi reset
btc dominance hopefully makes a Lower High and then we get some relief on alts
still feel this is max opportunity just squeezed and humbled us a bit
close above white line on daily and we good

TIA Head and ShoulderTIA massive pullback create HnS pattern, we will see the price is arround $5 to fill in gap before bouncing


$TIA/USDT Trading IdeaTIA/USDT seems to have experienced a pullback after a clean breakout from the falling wedge pattern. I believe the price will find support within that gap and, one way or another, has a strong chance of reaching the golden zone. There’s potential for another 100% rally to the upside.

TIA daily chart idea
really nice bottoming structure as we retrace to the local Weekly FVG
have a HTF bat harmonic that is starting to play out & a MTF cypher which already ran
looking for continuation here from Weekly FVG below + retest of ice line at 5.75
could wait for H4 shift back to upside to look to get involved

$TIAUSDT 2X trading ideahello everyone, here is the my trading plan for $TIA. It can easily give 2X profit. Adding right now to my portfolio, Pls do not miss this huge gain opportunity.
** Please show your support if you like to see more idea from me. LIKE 👍, FOLLOW ✅, SHARE 🙌 and COMMENT ✍ if you enjoy this idea! Also share your ideas and charts in the comments section below! This is best way to keep it relevant, support me, keep the content here free and allow the idea to reach as many people as possible. **
#trading #BTC #bitcoin #coin #scalping #crypto

Celestia (TIA/USDT) - "LONG" Spot Margin Trade📈 LONG
Signal Type: (SPOT) ⬆️
💵Margin: 2%
✅Entry level:
$6.2 - $6.9
🎯Target Levels:
1) $7.7
2) $8.8
🚫Stop Loss: $5.749
💰 Leverage (Optional)
‼️Risk= Medium
⚠️Please use the risk management I provided for you accordingly and don't forget about the risk in futures trading. Be sure to adjust Stop Loss/Leverage to your needs.
