U.S. Dollar Index (DXY) !!U.S. Dollar Index (DXY)
Long-Term Channel Support Held
The chart shows DXY moving within a rising parallel channel since around 2008.
Recent price action bounced right from the lower trendline (~98 zone), indicating strong structural support.
Bearish Pressure
DXY dropped below 100, currently around 98.72, down 1.32% this month.
Trading below the 200-month EMA, which suggests weakening long-term strength.
Bearish candlesticks forming near the lower channel indicate an increased risk of a breakdown if support fails.
Ichimoku Cloud Signal
Price below the Kumo (cloud) = bearish territory.
Cloud turning thin ahead — signaling potential indecision or transition.
What This Means for Markets
If the DXY breaks below this channel, it could trigger a broader USD sell-off, potentially bullish for cryptocurrencies, gold, and emerging markets.
If support holds, expect a rebound toward the 104–106 zone, especially if macro sentiment favors the dollar.
Stay updated and manage your risk accordingly.
DYOR | NFA
DXY trade ideas

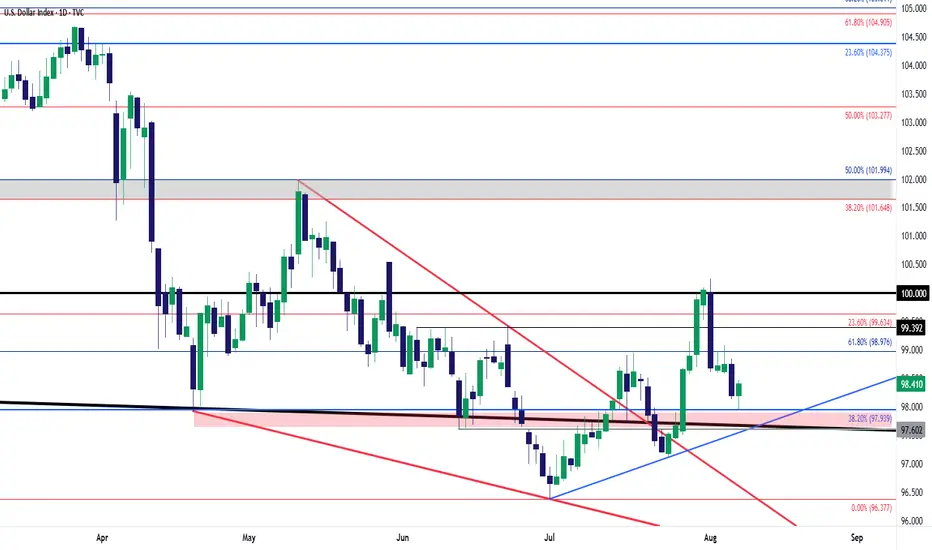
DOLLAR INDEX (DXY), Position Trade Bearish Point of ViewLooking at the DOLLAR INDEX (DXY), DXY might turn bearish after tapping the FVG above, potentially falling below the long-term ascending channel on the quarterly timeframe, suggesting a macro trend reversal, with price likely to break and retest 98.393 before continuing down toward the 84.464 FVG area.

USD Re-Tests a Familiar Area of SupportBack in April the US Dollar was dropping like a rock. While the sell-off in stocks had stalled by the time we got to Easter, the bearish trend in USD was in full-force, going along with a strong breakout in Gold and many major FX pairs. But it was the low on Easter Monday that finally stalled matters for a bit. That price came in right around the 98.00 level, and led to four weeks of strength, including through the May FOMC rate decision, all the way until the 102-handle came into play. That's where the music stopped for the USD rally in Q2, and sellers went back for another push down to fresh lows that ultimately showed with a fresh three-year-low on day one of Q3.
Since then, however, bears have been stalled and there's a couple of different supporting backdrops there, such as the oversold readings that had shown on both the daily and the weekly as we came into Q3, or the falling wedge formation that had built as sellers remained really aggressive at highs or tests of resistance while less so around lows or tests of support.
And it's not like July was all that bullish of a month for the USD as we heard Trump continue to press his desire for low rates, including threats to fire FOMC Chair Jerome Powell. And at this stage, markets are pricing in a rate cut in September, along with another by the end of the year and possibly two. So expectations on rates are really low yet, on a relative basis, the USD has held up somewhat well.
At this point we're at another major test with the USD re-testing that same spot of support that had come into play in April, around the 98.00 handle in DXY. There's more context for support in the USD down to around 97.60, which helps to create a zone. For USD-weakness, I still think GBP/USD remains as attractive, but for USD-strength, EUR/USD could be an interesting case given the Fibonacci resistance that's started to show there. - js
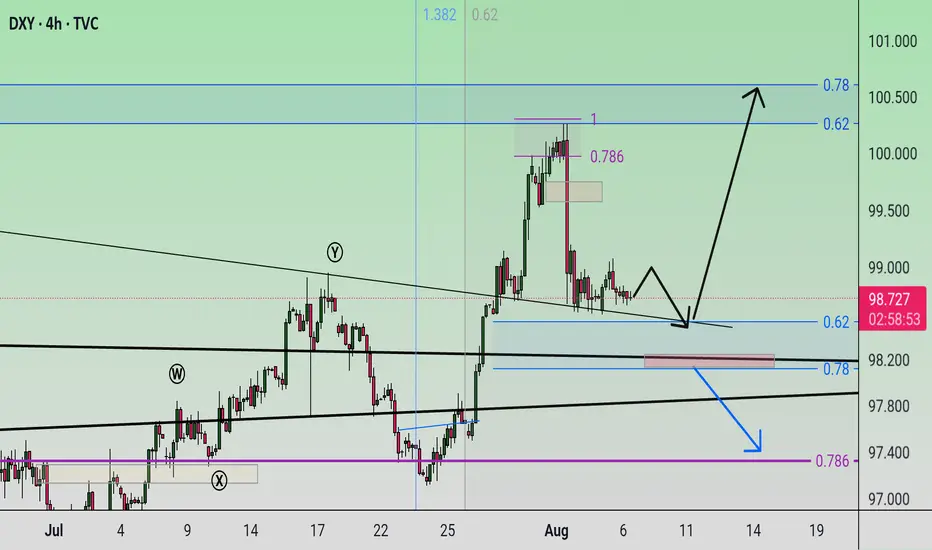
Correction A trend change is expected to form within the current support range and we will see the start of an uptrend. A break of the 78.6% level will likely lead to a continuation of the downtrend.
DXY Poised for Bullish Expansion After Accumulation PhaseThe DXY appears to be completing a corrective phase, transitioning into a potential accumulation zone. Price action shows signs of compression, reduced volatility, and higher lows, suggesting that sellers are losing momentum while buyers begin to absorb liquidity.
This behavior often precedes an expansion phase. If current structure holds, we may soon see a bullish breakout, with price aiming to reclaim previous highs or key resistance levels. A confirmed breakout above the immediate consolidation range could provide a strong signal for long setups.
I'm watching for:
A clear break and retest of local resistance
Bullish confirmation via volume or momentum indicators (e.g., RSI or MACD crossover)
Continuation patterns (flags or bullish order blocks)
As always, risk management is key. This is not financial advice — trade according to your plan.
#DXY #USD #DollarIndex #Forex #TechnicalAnalysis #Bullish #PriceAction #Accumulation #Breakout #TradingIdeas #MarketAnalysis #SwingTrading #SmartMoney #LiquidityGrab #ChartPatterns #RSI #MACD #SupportAndResistance #TrendReversal #DollarStrength
DXYCOT Bearish Bias — Latest COT data shows increased short positions and reduced longs from institutions, signaling bearish sentiment. Expecting continued downside as supply pressure outweighs demand.
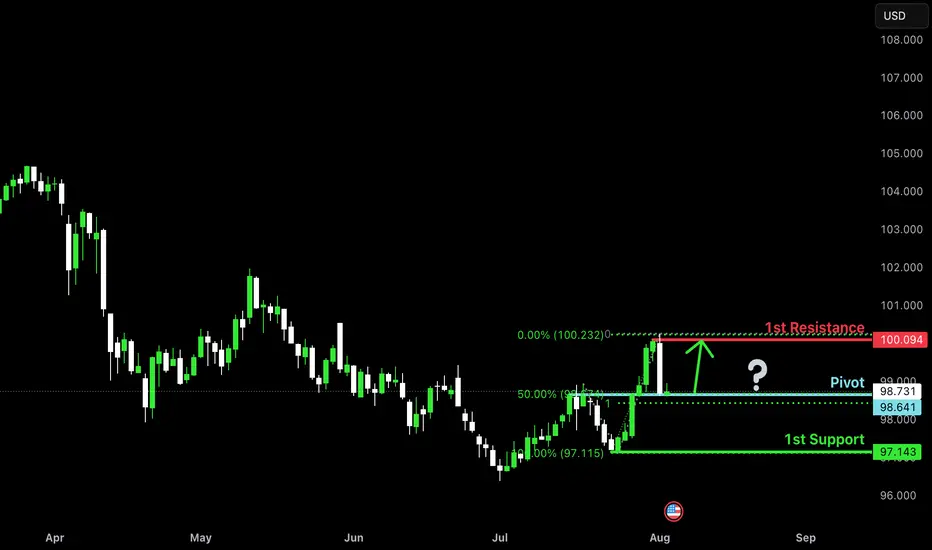
Bullish bounce off pullback support?The US Dollar Index (DXY) is reacting off the pivot, which is a pullback support that lines up with the 50% Fibonacci retracement and could bounce to the 1st resistance.
Pivot: 98.64
1st Support: 97.14
1st Resistance: 100.09
Risk Warning:
Trading Forex and CFDs carries a high level of risk to your capital and you should only trade with money you can afford to lose. Trading Forex and CFDs may not be suitable for all investors, so please ensure that you fully understand the risks involved and seek independent advice if necessary.
Disclaimer:
The above opinions given constitute general market commentary, and do not constitute the opinion or advice of IC Markets or any form of personal or investment advice.
Any opinions, news, research, analyses, prices, other information, or links to third-party sites contained on this website are provided on an "as-is" basis, are intended only to be informative, is not an advice nor a recommendation, nor research, or a record of our trading prices, or an offer of, or solicitation for a transaction in any financial instrument and thus should not be treated as such. The information provided does not involve any specific investment objectives, financial situation and needs of any specific person who may receive it. Please be aware, that past performance is not a reliable indicator of future performance and/or results. Past Performance or Forward-looking scenarios based upon the reasonable beliefs of the third-party provider are not a guarantee of future performance. Actual results may differ materially from those anticipated in forward-looking or past performance statements. IC Markets makes no representation or warranty and assumes no liability as to the accuracy or completeness of the information provided, nor any loss arising from any investment based on a recommendation, forecast or any information supplied by any third-party.
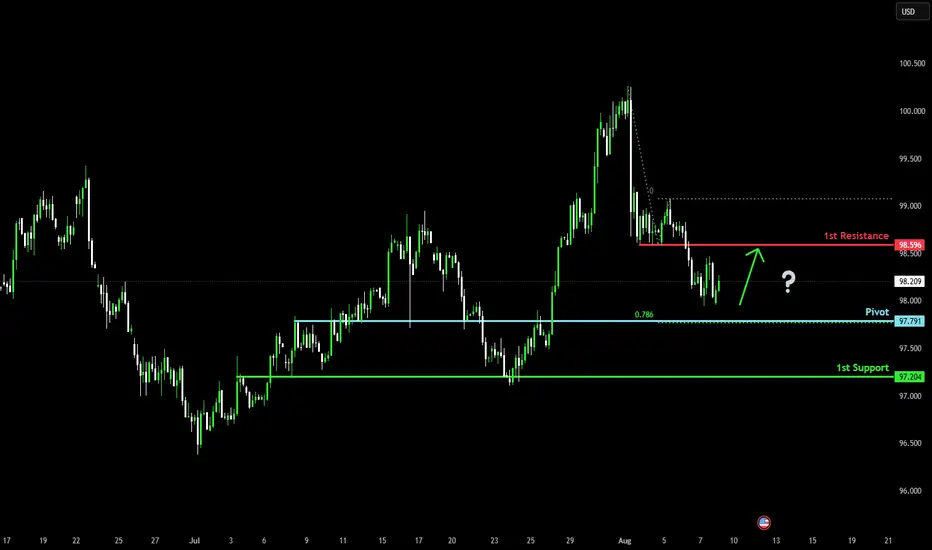
Bullish bounce off?The US Dollar Index (DXY) is falling towards the pivot which is an overlap support and could bounce to the pullback resistance.
Pivot: 97.79
1st Support: 97.20
1st Resistance: 98.59
Risk Warning:
Trading Forex and CFDs carries a high level of risk to your capital and you should only trade with money you can afford to lose. Trading Forex and CFDs may not be suitable for all investors, so please ensure that you fully understand the risks involved and seek independent advice if necessary.
Disclaimer:
The above opinions given constitute general market commentary, and do not constitute the opinion or advice of IC Markets or any form of personal or investment advice.
Any opinions, news, research, analyses, prices, other information, or links to third-party sites contained on this website are provided on an "as-is" basis, are intended only to be informative, is not an advice nor a recommendation, nor research, or a record of our trading prices, or an offer of, or solicitation for a transaction in any financial instrument and thus should not be treated as such. The information provided does not involve any specific investment objectives, financial situation and needs of any specific person who may receive it. Please be aware, that past performance is not a reliable indicator of future performance and/or results. Past Performance or Forward-looking scenarios based upon the reasonable beliefs of the third-party provider are not a guarantee of future performance. Actual results may differ materially from those anticipated in forward-looking or past performance statements. IC Markets makes no representation or warranty and assumes no liability as to the accuracy or completeness of the information provided, nor any loss arising from any investment based on a recommendation, forecast or any information supplied by any third-party.
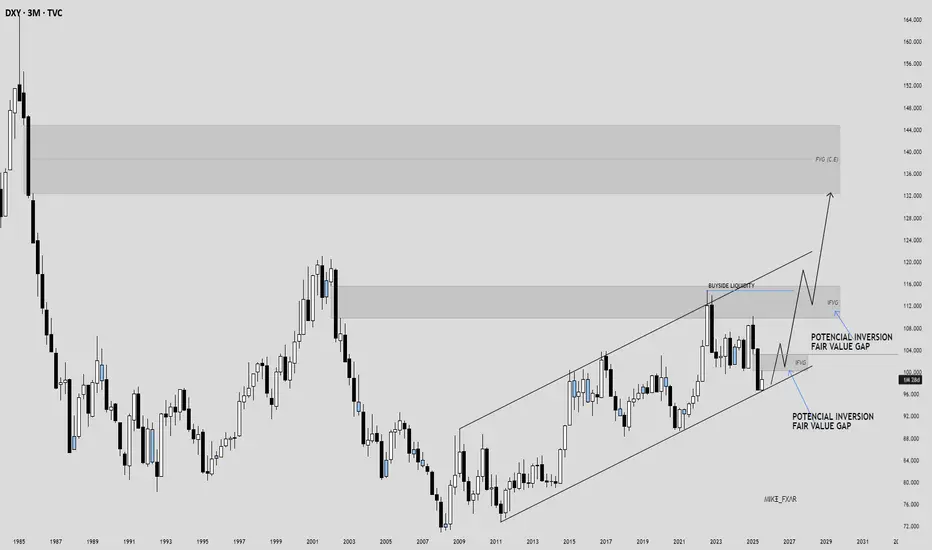
DOLLAR INDEX (DXY), Position Trade Bullish Point of ViewLooking at the DOLLAR INDEX (DXY), DXY might turn bullish after tapping the potential inversion fair value gap around 100.182 suggesting a macro continuation of the long-term uptrend, with price likely to retest the 103.197 IFVG (inversion fair value gap) area, break above 114.778 liquidity, and continue higher toward the 132.345 FVG from 1st of July 1985.
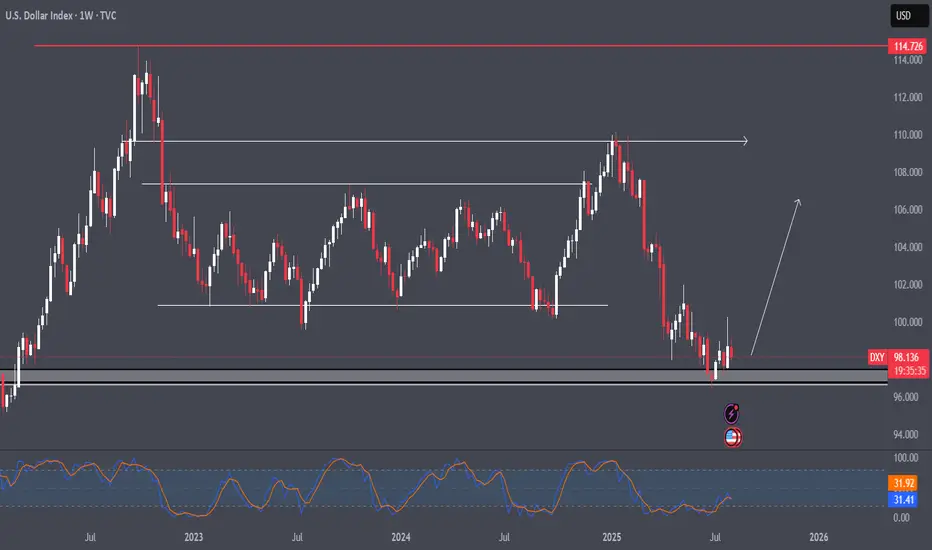
DXY: Weekly OutlookWeekly DXY Outlook
On the weekly chart, the US Dollar Index (DXY) has reached a critical zone that was last tested in February 2022.
While a rebound is not guaranteed, the fact that the DXY has declined nearly 12% over just six months—despite a resilient U.S. economy—suggests the potential for renewed strength in the dollar.
I think the index could begin a recovery toward key levels at 100.00, 101.97, and possibly 106.00/
It’s worth noting that the broader bearish trend began with the trade tensions initiated during the Trump administration, which strained relations with several major trading partners.
Given that this is a weekly chart, it should be used more as a reference point rather than a trading signal.
You may find more details in the chart!
Thank you and Good Luck!

Forex Forecast & Bias | 11th–15th Aug 2025 | CMCMARKETS:EURUSD In this week’s Forex outlook (11th–15th August 2025), I break down my directional bias for the major currency pairs, highlight key POIs (Points of Interest), and outline which markets I’ll be watching closely.
You’ll see:
✅ Pairs that are ready to trade this week
🚫 Pairs to avoid based on market structure & volatility
📍 High-probability POIs for entries & exits
🎯 My directional bias for each major pair going into next week
This analysis is based on technical structure, higher-timeframe confluence, and key market zones. Perfect for swing and day traders looking for a weekly plan.
📌 Disclaimer: This video is for educational purposes only and does not constitute financial advice. Always do your own research and manage your risk.

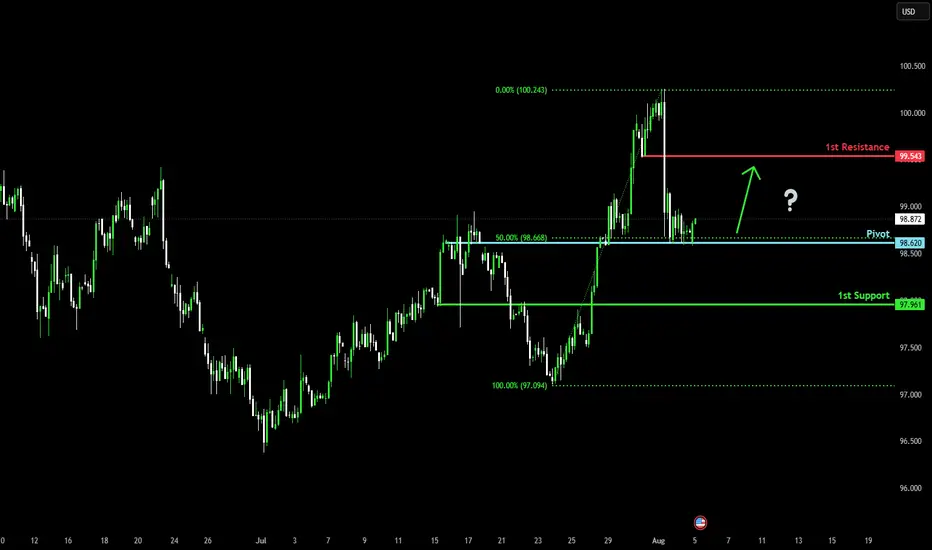
Bullish bounce off 50% Fibonacci support?US Dollar Index (DXY) is reacting off the pivot, which acts as a pullback support and could bounce to the 1st resistance.
Pivot: 98.62
1st Support: 97.96
1st Resistance: 99.54
Risk Warning:
Trading Forex and CFDs carries a high level of risk to your capital and you should only trade with money you can afford to lose. Trading Forex and CFDs may not be suitable for all investors, so please ensure that you fully understand the risks involved and seek independent advice if necessary.
Disclaimer:
The above opinions given constitute general market commentary, and do not constitute the opinion or advice of IC Markets or any form of personal or investment advice.
Any opinions, news, research, analyses, prices, other information, or links to third-party sites contained on this website are provided on an "as-is" basis, are intended only to be informative, is not an advice nor a recommendation, nor research, or a record of our trading prices, or an offer of, or solicitation for a transaction in any financial instrument and thus should not be treated as such. The information provided does not involve any specific investment objectives, financial situation and needs of any specific person who may receive it. Please be aware, that past performance is not a reliable indicator of future performance and/or results. Past Performance or Forward-looking scenarios based upon the reasonable beliefs of the third-party provider are not a guarantee of future performance. Actual results may differ materially from those anticipated in forward-looking or past performance statements. IC Markets makes no representation or warranty and assumes no liability as to the accuracy or completeness of the information provided, nor any loss arising from any investment based on a recommendation, forecast or any information supplied by any third-party.

DXY Trend AnalysisTechnicals:
The DXY is sitting near its pivot, with technical momentum remaining mildly bearish, but oversold conditions suggest a potential for a bullish bounce. If the 97.55 support is broken decisively, further downside is likely. Upside is capped by resistance at 98.64; a break above this may confirm a short-term reversal to the upside.
Key Levels to Watch
Pivot Level: 98.12
Key Support: 97.55
Key Resistance: 98.64
Fundamentals:
- Persistent US twin deficits, reduced safe-haven flows, and a global trend of diversifying away from dollar assets all present headwinds.
- The spread between US yields and foreign peers is at historic highs, but with the Fed expected to ease and global growth forecasts improving, the dollar's advantage is eroding.
- Safe-haven demand could temporarily support the dollar in response to global shocks, but is not expected to reverse the broader downtrend this year.
Analysis by Terence Hove Senior Financial Markets Strategist at Exness

Dollar dropWith the break of the ascending channel's bottom, the price is expected to reach the bottom of the range.
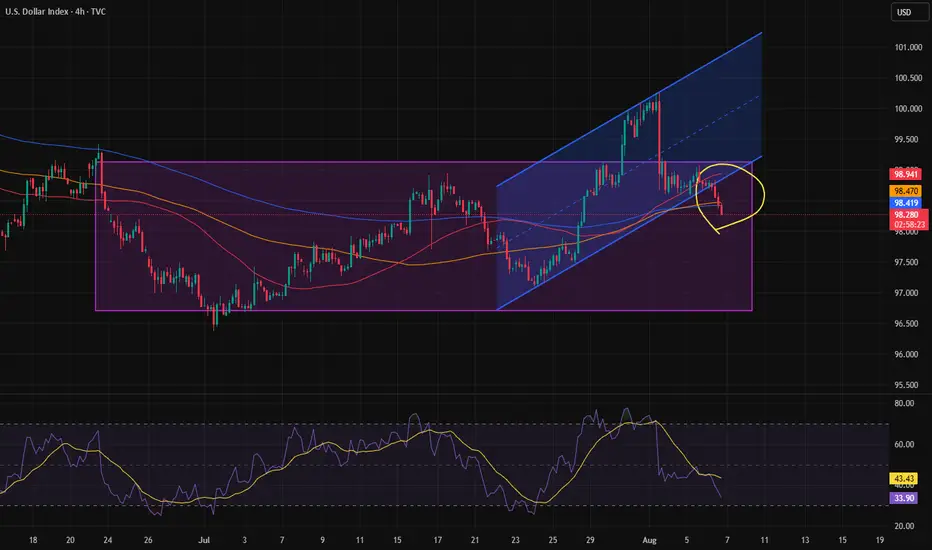
DXYDXY has given us a drop last week, lets wait for a correction to trade another drop.
Disclosure: We are part of Trade Nation's Influencer program and receive a monthly fee for using their TradingView charts in our analysis.
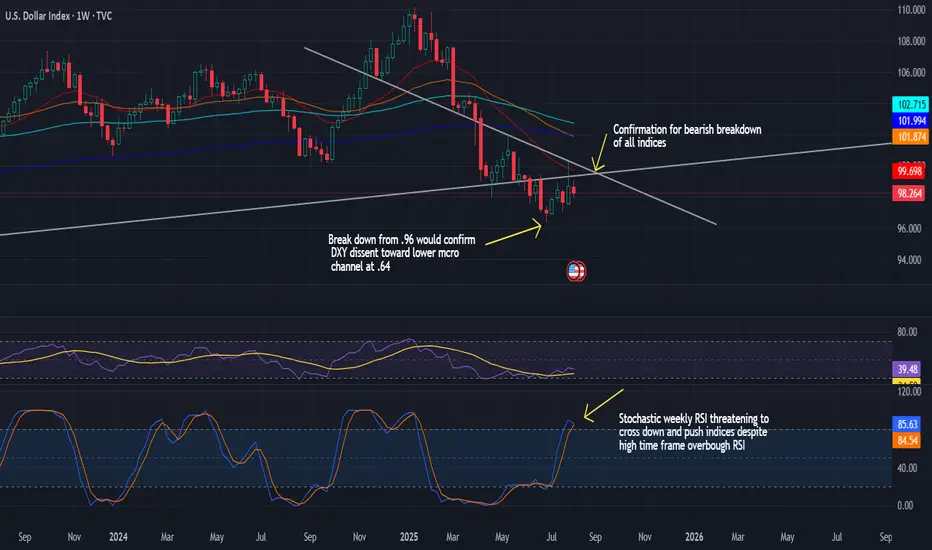
On the edge of massive inflation or complete collapse. Even though SPX and Bitcoin are at macro life-cycle top trends, it appears there is panic buying on the potential threat of impending inflation. Institutional ETFs, 401K crypto investments, and negative dollar sentiment may be giving rise to weakening of the dollar.
Simultaneously, the Trump administration and the Fed appear to be attempting to head off a potential recession by trying to stimulate growth via quantitative easing. Long-term, this will contribute to a much sharper collapse, but it appears the financiers are keeping us in line with the traditional 4 year cycle and driving equities and crypto against massive selling at legacy market tops.
It will be quite a ride so expect massive volatility until .96 breaks down or the current bottom trend since 2008 is regained. I have the determinant factors for bull or bear clearly delineated to offer a clear picture to those who are feeling confused about overall market direction. If the weekly stochastic RSI does cross downward and we confirm below .96, the market rally will continue in line with the standard 4 year cycle and should see the bear arriving in early 2026 unless DXY 17 year bottom trend is regained and recession abruptly cuts off the cycle.
To 95 and up
The previous idea has been fully implemented. I expect a slight decrease to 95 and then only upward.

DXY 8H – Rejected Key Resistance, Can the Dollar Bounce Back?The U.S. Dollar Index (DXY) just got rejected off a key 8H supply zone near the psychological 100 level — failing to reclaim a level that previously acted as major support. With EMAs flattening and macro uncertainty rising, the dollar’s next move will have big implications across global markets.
🔹 Price Structure
The $100–$101.50 zone acted as support for months before breaking — and DXY just got rejected on its first retest.
The next resistance levels are stacked at $104, $108, and $110, each tied to prior breakdown points and macro peaks.
If DXY can't reclaim $100, a slide toward EMA support at ~$98 or even new lows remains in play.
🔹 EMA Signals
Price currently hovers between the EMA 50 and EMA 100 — an indecision zone often preceding trend continuation or reversal.
A breakdown below both EMAs would confirm momentum is stalling, while a reclaim of $100 could reignite the bullish push.
🔹 Implications for Risk Assets
If the dollar weakens from here, we could see renewed upside in crypto and equities.
Conversely, a reclaim and surge toward $104+ would likely pressure risk-on markets.
Is the DXY topping out — or just gearing up for another leg higher?
Let’s talk macro 👇

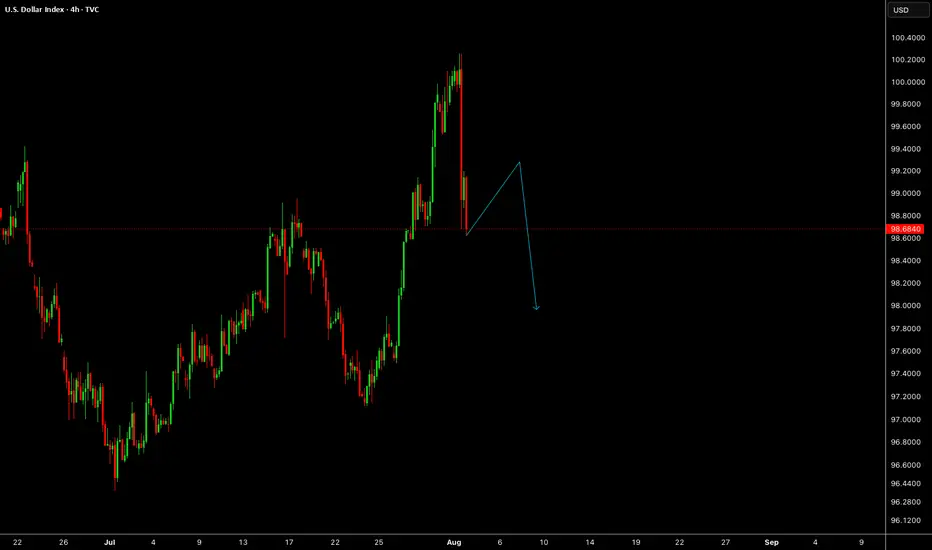
DXY Outlook – From Bias to Execution Previous day closed bearish from a known supply zone, leading to a sell bias, Narrowing down to the 1H timeframe, I identified a familiar bearish flag price action pattern.

DXY SHORT Well, the dollar index is in a descending channel. The expectation is that the price will fall from the channel ceiling to the channel floor.
This post will be updated.,

NFP Volatility Ahead – Is the Dollar Ready to Break Higher?🟢 DXY Outlook – A Key Day for the Dollar Index
Yesterday’s monthly candle closed with strong bullish momentum, marking a powerful start to August. Today, on the first trading day of the month, we’re expecting three major U.S. economic releases:
NFP, Average Hourly Earnings (m/m), and the Unemployment Rate.
As discussed in last week’s outlook, DXY has successfully broken above the key 100 level and confirmed a monthly close above it — a significant technical development. With no major order blocks or visible resistance in the way, the path toward the 102 target appears technically clear.
That said, I anticipate mixed data from today’s releases — which means we could see both sides of liquidity being taken during the initial reaction. Price might dip toward lower zones temporarily to collect liquidity before resuming its bullish move toward 102.
📌 In summary:
From a swing perspective, I believe the direction remains bullish for the Dollar Index as long as we hold above the 100 level.
When I say the data might be “mixed,” I mean the market could show an initial drop toward lower zones at the time of release — not because of a reversal, but to grab liquidity before continuing higher toward the 102 target.
Unless we see something unexpectedly extreme in the numbers, I expect the DXY to remain on track to reach the 102 level in the coming days or next week.
🔁 This analysis will be updated whenever necessary.
Disclaimer: This is not financial advice. Just my personal opinion.
DOLLAR INDEX DXYThe U.S. Dollar Index (DXY) is a measure of the value of the United States dollar (USD) relative to a basket of six major foreign currencies. It reflects how strong or weak the dollar is compared to these currencies collectively. The index was created by the Federal Reserve in 1973
The six currencies included in the basket and their approximate weightings are:
Euro (EUR): 57.6%
Japanese Yen (JPY): 13.6%
British Pound Sterling (GBP): 11.9%
Canadian Dollar (CAD): 9.1%
Swedish Krona (SEK): 4.2%
Swiss Franc (CHF): 3.6%
The DXY is calculated as a weighted geometric average of the dollar's exchange rates against these currencies. When the dollar strengthens against this basket, the index rises; when it weakens, the index falls.
The index is widely used by traders, investors, and economists to gauge the overall strength of the U.S. dollar in global currency markets and to inform trading and economic decisions.
In essence, the Dollar Index provides a standardized barometer of the U.S. dollar's value against its major international trading partners' currencies.
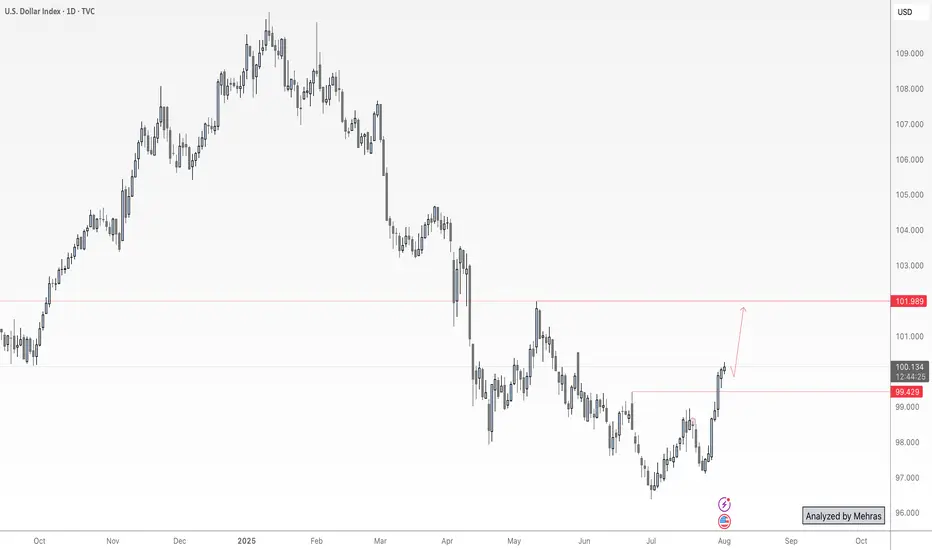
The U.S. Dollar Index (DXY) is trading near 98.684 of August 1, Friday market close.
July saw the DXY record its first monthly gain in 2025 (rising nearly 1%) as a a result of the demand floor on ascending trendline acting as dynamic support .but selling has resumed at the start of August on ADP data report, the current supply roof presents resistance to upswing capping gains on economic outlook and immigration enforcement concern.
Key Fundamental Drivers (August 2025):
Fed Policy & Inflation: The Federal Reserve kept rates steady at 4.25–4.50% in July, but persistent inflation (core PCE up to 2.8% YoY in June) and the impact of new U.S. tariffs are keeping rate cuts on hold for now.
Tariffs & Trade Policy: Fresh, globally-applied U.S. tariffs announced at the end of July have heightened risk aversion, helped the dollar find support, and stirred inflation concerns—as import price increases feed into core inflation data.
Interest Rate Differentials: While the Fed holds rates high, other central banks (especially the ECB and BOE) are signaling further easing. The resulting policy divergence still gives the dollar some support, but large inflows into alternative markets (e.g., eurozone equities, gold, yen) have also pressured the greenback.
Safe-Haven Flows: Risk-off sentiment amid trade tension and global policy uncertainty continues to prompt investors to seek the relative safety of the dollar, limiting its downside.
Composition: The DXY measures the value of USD relative to a basket of currencies: euro (57.6%), yen (13.6%), pound (11.9%), Canadian dollar (9.1%), Swedish krona (4.2%), and Swiss franc (3.6%).
The path ahead depends on upcoming U.S. inflation prints, additional Fed commentary, and how global markets react to ongoing trade disputes and central bank moves.
Longer term,
The DXY remains under pressure at the start of August 2025 but is showing tentative signs of stabilization just below the key 100 mark. The trend will hinge on Fed policy, global inflation data, and the impact of new tariffs on both inflation and global risk appetite. If buying breaks and close above weekly resistance roof then 104-103 can be reclaimed.
trading is 100% probability ,manage your risk and know that any key level can fail.
#dollar #dxy #money #eurusd #gbpusd #audusd #usdjpy
