DXYHere’s the English description of the two scenarios in your chart:
Scenario 1 (Green Path):
Price drops from the current level (~98.26) towards the demand zone around 97.50–97.60, finds support, and then rallies sharply, breaking above the 98.80–99.00 resistance zone and continuing higher toward the 100.20–100.40 level.
Scenario 2 (Orange Path):
Price first pushes upward toward the 98.80–99.00 supply zone, faces rejection, then falls sharply to the demand zone around 97.50–97.60, before reversing and rallying strongly toward the 100.20–100.40 target.
DXY trade ideas

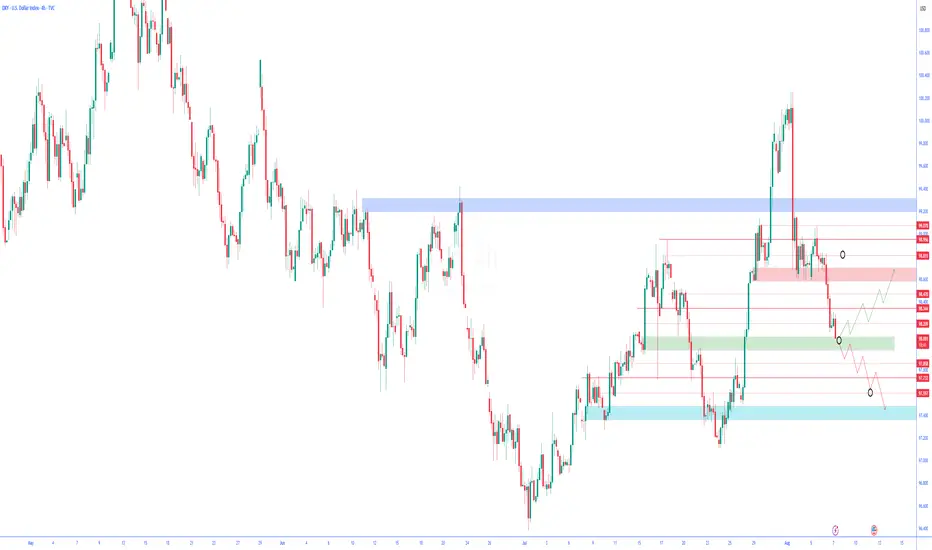
U.S. Dollar Index (DXY) – 15M Chart Analysis | Aug 8, 20251. Market Structure:
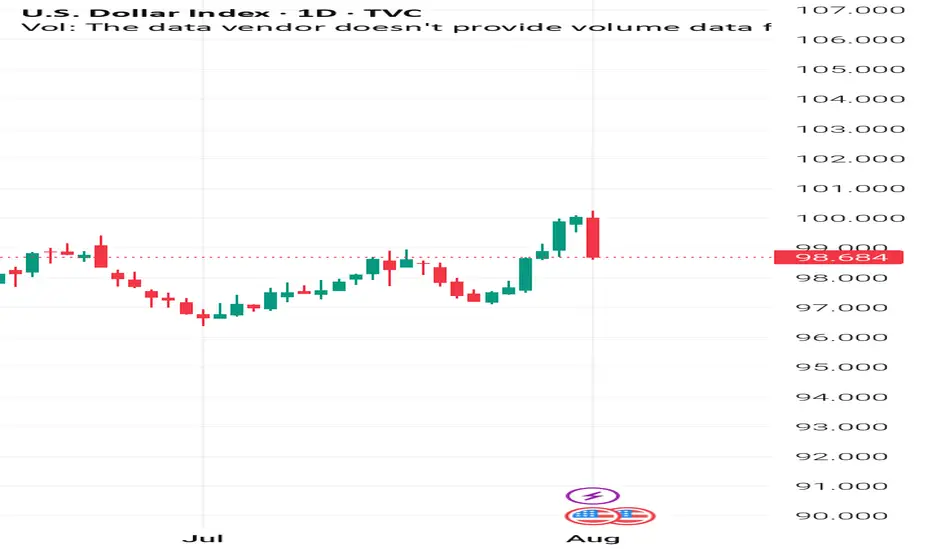
DXY is trading in a short-term range between 98.471 resistance and 97.952 support, following a sharp downtrend from the 99.072 high.
2. Supply Zone Pressure:
The 98.471 level acts as a strong intraday supply, repeatedly rejecting price and limiting bullish momentum.
3. Demand Zone Cushion:
The 97.952 level is holding as immediate support. Below that, the yellow zone around 97.60–97.45 is a major demand area where buyers may step in.
4. Momentum Bias:
Lower highs from the recent peaks signal ongoing bearish pressure. Short-term rallies are getting sold into, suggesting sellers control the market.
5. Next Move:
Bullish: Break above 98.471 opens path to 98.829–99.072 .
Bearish: Break below 97.952 targets the 97.60–97.45 demand zone.

DXY: Absolute Price Collapse Ahead! Short!
My dear friends,
Today we will analyse DXY together☺️
The market is at an inflection zone and price has now reached an area around 98.553 where previous reversals or breakouts have occurred.And a price reaction that we are seeing on multiple timeframes here could signal the next move up so we can enter on confirmation, and target the next key level of 98.471.Stop-loss is recommended beyond the inflection zone.
❤️Sending you lots of Love and Hugs❤️
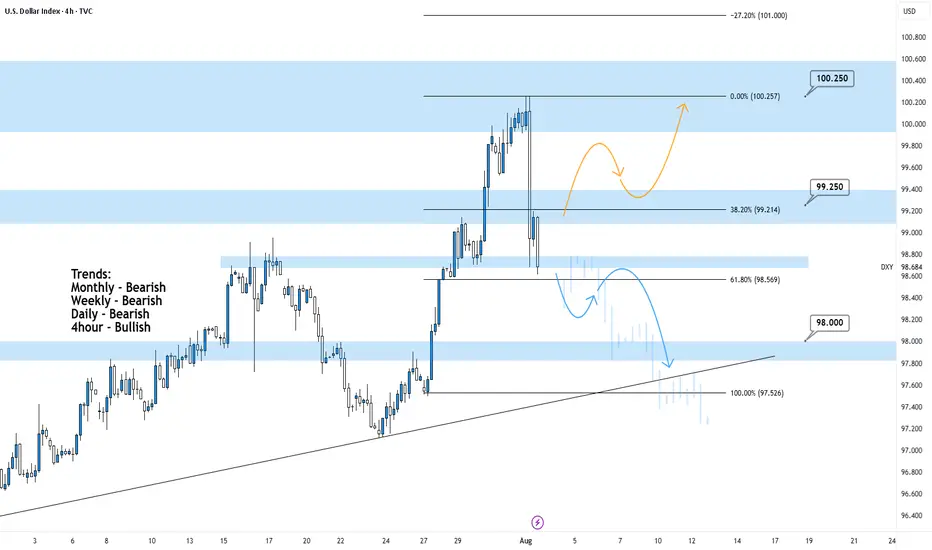
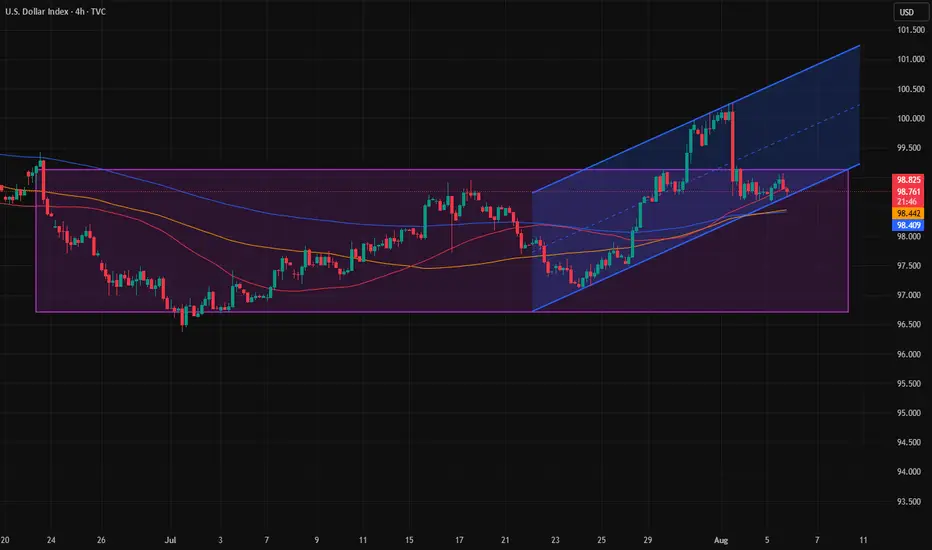
DXY 4Hour TF - August 3rd,2025🟦 DXY 4H Analysis Neutral idea
📅 August 3, 2025
🔹 Top-Down Trend Bias:
• Monthly – Bearish
• Weekly – Bearish
• Daily – Bearish
• 4H – Bullish
The dollar index is in a larger bearish cycle but just bounced from near-term resistance around 100.250. While the 4H shows temporary strength, we’re trading into major resistance and we may see it short lived.
🔍 Key Levels to Watch
• Support: 98.00
• Resistance Zones: 99.25 and 100.25
• 61.8% Fib: 98.57
Price is currently testing structure after rejecting from the 100.25 resistance zone. This area remains a strong ceiling unless the higher timeframe structure shifts.
✅ Scenario A: Bearish Continuation (Blue Path)
1. Bearish Structure confirmation below the current zone
2.If bearish rejection confirms, expect price to continue toward 98.00, possibly 97.50
3.Clean confluence with the higher timeframe trend
⚠️ Scenario B: Bullish Extension (Orange Path)
1.If price breaks and holds above 99.25, we may see a continuation toward 100.25
2.Short-term bullish strength, but against HTF bias
3.Must treat as a counter-trend idea unless confirmed with HTF structure shift
🧠 Final Notes
• 98.50 is the key decision zone, watch reaction closely
• Trend remains bearish on all major timeframes
• Don’t force the long, lean bearish unless structure proves otherwise
DXY to go extremely low due to Tariffs and Market ManipulationDXY to go extremely low due to Tariffs and Market Manipulation Reports
- The US Debt is almost over $38 Trillion in under 3 months
- Continue to monitor for weekly bearish signals on the chart
TVC:DXY
OANDA:USDCAD
OANDA:NZDUSD
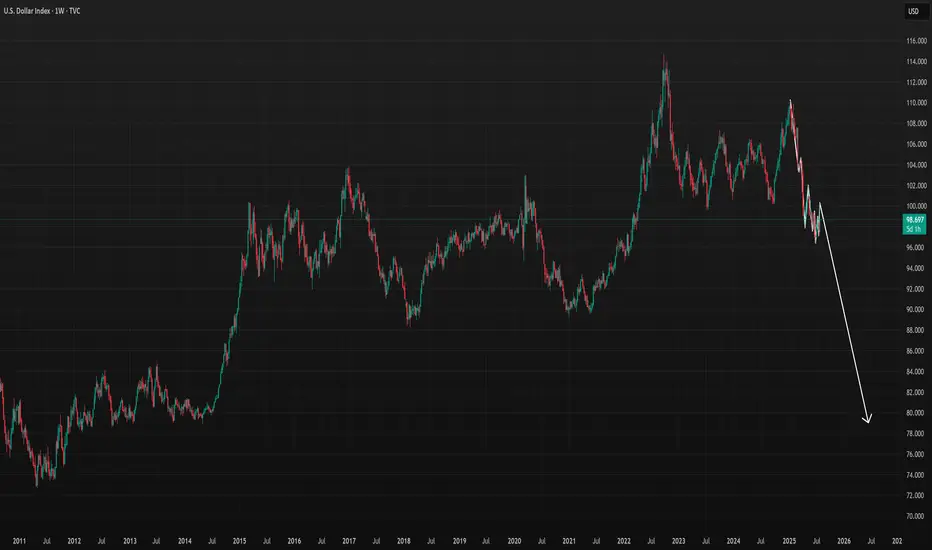
DXY continued downside, next stop 90Perfect parallel channel + Fib 2.618 intersection
Gl
Not financial advice

DXY for this week Technical Analysis – Inverse Head & Shoulders with Neckline Retest
Current Market Situation
The chart shows an Inverse Head & Shoulders pattern, which is a bullish reversal pattern.
The neckline has been broken to the upside, providing a strong signal for potential continued bullish momentum.
The price is currently in the neckline retest phase, a critical area to confirm the bullish trend before further upward movement.
Key Zones
Retest Zone (Pullback): 98.300 – 98.700, an important support area.
Demand Zone: If price dips further, an additional support zone lies between 97.500 – 97.000.
Monthly Trendline: Offers long-term structural support, reinforcing the bullish outlook.
Potential Scenarios
✅ Bullish Scenario (Preferred):
If the price holds above the retest zone and neckline:
Target 1: 101.000
Target 2: 102.500 – 103.500
⚠ Bearish Scenario (Invalidation):
A break below 97.000 invalidates the bullish scenario and opens the door for deeper downside movement.
Conclusion
The market shows strong bullish potential after confirming the neckline retest.
97.000 is the key invalidation level for the bullish setup.
Price action around the retest zone and demand area should be monitored closely before entering trades.
⚠️ Trade at your own risk – We are not responsible for any losses.

DXY BULLISH coming weeks Dxy is oversold, and what goes down must go up. Price did a nice retracement, setting up for next week to go higher or the week after, depending on consolidation. For me, DXY will go higher, leaving its cross pairs like EURUSD to go lower.

What now for the dollar after a poor NFP report?It is difficult not to link the bad US data to the impact of tariffs. Indeed, it certainly looks that way, especially given that the slowdown in jobs started in early Q2 when reciprocal tariffs were announced. Companies expecting margins to be squeezed by higher duties probably thought twice about hiring workers in order to keep costs down. So, the US labour market has been losing steam fast, undoubtedly due to tariff concerns. Unless the data surprises on the upside soon, the Fed may have no choice but to cut—and cut again. Against this backdrop, the recovery in the dollar is going to a long bumpy road.
We noted the area around 100.00 to be resistance in the previous update, and that level has held, thanks to the weak jobs report (and ISM survey that was released later). The DXY was testing potential support around 98.95 at the time of writing. Will it be able to bounce there? Break that on a closing basis and next week could bring more technical dollar selling.
By Fawad Razaqzada, market analyst with FOREX.com
All the Triggers You Need to Watch This Weekyo its Skeptic from Skeptic Lab 🩵
Quick breakdown of my weekly watchlist — from forex pairs to commodities — including the exact levels and triggers I’m watching for potential setups this week. Whether you trade breakouts or reversals, this list will keep you ahead of the moves.
Disclaimer: This content is for educational purposes only and is not financial advice. Trade at your own risk.

DXY 1H Sell AnalysisThe dollar index has induced (IDM) and taken out the buy side liquidity, after that the market rapidly came back in with high volume creating a gap. Now we focus on the Price leg it created which has 1H order block +_ fvg, if/when price pulls back to area (1H OB + fvg) then will have selling or buying opportunities on ***USD pairs and vice versa this coming week.

Technical Analysis of the US Dollar Index (DXY) | 4-Hour Timefr🟢 Technical Analysis of the US Dollar Index (DXY) | 4-Hour Timeframe
On the 4-hour chart, the US Dollar Index has recently formed a Drop-Base-Drop (DBD) structure and is now positioned on a significant support level. This area can play a critical role in traders' decision-making for the next move.
✅ Current Situation:
After the initial drop, the price entered a short-term base/consolidation phase, then continued its decline and is now testing a demand zone (support). In this structure, two potential scenarios are worth considering:
🔼 Bullish Scenario:
If the price reacts positively to this support zone:
A rebound toward previous supply areas is likely.
Holding above the first resistance could indicate a temporary or even long-term trend reversal.
This level may provide a low-risk entry opportunity for buyers targeting a reversal.
🔽 Bearish Scenario:
If selling pressure continues and the current support breaks:
A further drop as part of a third wave (impulse) may unfold.
Lower support zones would become the next target areas for sellers.
Breakout from the channel again?After a long period of ranging, the DXY finally managed to break the range's ceiling last week and even gave us a channel confirmation afterward. But if you remember, there were several major news events last week, with the last one on Friday causing the price to fall back into the range. Now we can see that an ascending channel has formed inside the range, and the price is currently at the bottom of that channel. If it manages to break out of the channel again, there’s a chance that this time the trend might truly reverse.
DXY (USDX): Trend in daily time frameThe color levels are very accurate levels of support and resistance in different time frames, and we have to wait for their reaction in these areas.
So, Please pay special attention to the very accurate trend, colored levels, and you must know that SETUP is very sensitive.
(((((we have two trend)))))
BEST,
MT

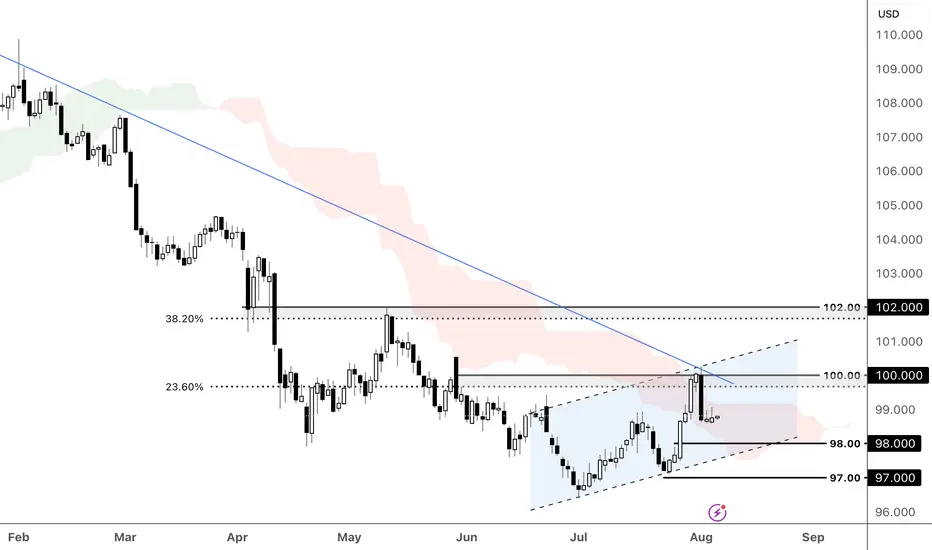
DXY is testing the descending trend line, breakout happening? The US dollar firmed as Trump's escalating tariff threats, from pharma to Indian exports, amplified trade tensions and boosted safe-haven flows. Despite rising global uncertainty, optimism over a possible US-China trade truce extension and a sharply narrower trade deficit also underpinned dollar strength.
DXY retreated below the descending trend line and the ascending channel's upper bound. The price is consolidating below the 100.00 psychological resistance, which aligns with the 23.6% Fibonacci Retracement. A rebound from the support at 98.00, in line with the ascending channel's lower bound, could prompt a retest of the channel's resistance, paving the way for further gains toward the 38.2% Fibonacci Retracement and 102.00 resistance, upon breaking 100.00. Conversely, a bearish breakout of the channel and close below the 98.00 support could prompt a further decline toward the following support at 97.00.
By Li Xing Gan, Financial Markets Strategist Consultant to Exness
FX Matrix: DXY, GBPUSD, EURUSD Weekly AnalysisThis Weeks Bias:
DXY - Neutral Until Sundays Opening
GBPUSD - Neutral
EURUSD - Neutral


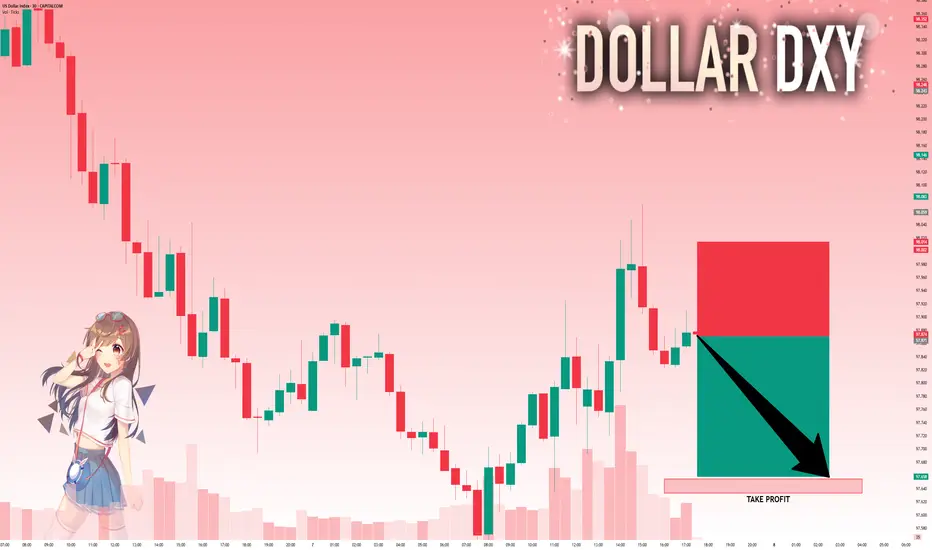
DXY: Absolute Price Collapse Ahead! Short!
My dear friends,
Today we will analyse DXY together☺️
The in-trend continuation seems likely as the current long-term trend appears to be strong, and price is holding below a key level of 97.871 So a bearish continuation seems plausible, targeting the next low. We should enter on confirmation, and place a stop-loss beyond the recent swing level.
❤️Sending you lots of Love and Hugs❤️
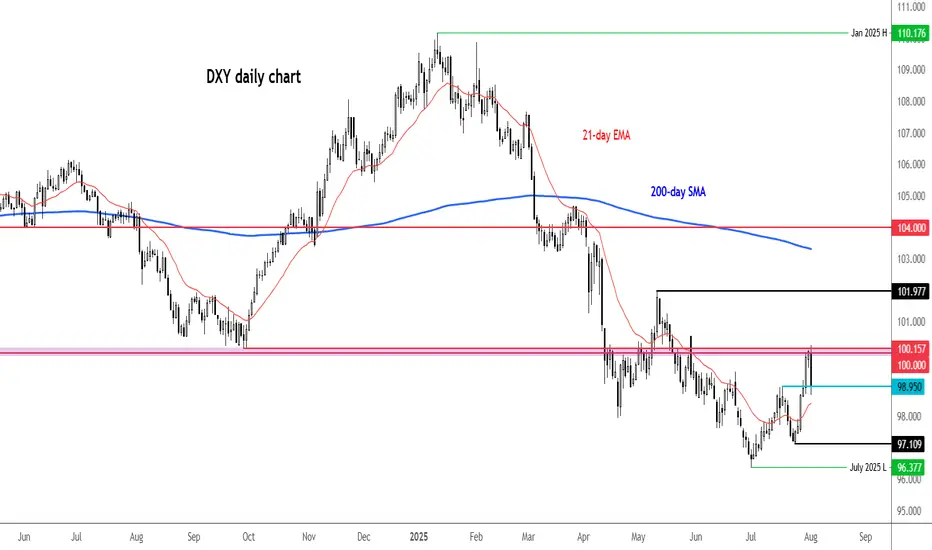
Dollar Index ProjectionWhere We Were – Market Structure Recap,
The Dollar Index completed a six-month range (110.176 to 96.768) with a bearish engulfing pattern, signaling long-term weakness. From March to June, DXY printed consistent lower lows and closes. July marked a shift with a higher high and close, indicating a possible retracement toward premium levels within the broader downtrend.
Where We Are Now – Current Market Conditions,
DXY is trading near the bottom of its range, interacting with a monthly price imbalance. Last week’s candle closed higher (higher high, higher close), suggesting short-term bullish control.
On the daily timeframe, structure has shifted into a potential sell-to-buy scenario. A new range is defined, and the 62% Fibonacci retracement overlaps with a bearish order block — a likely accumulation zone. The recent daily low is now critical support for this short-term bullish case.
Where We’re Going – Weekly Outlook,
The immediate outlook favors a bullish retracement targeting liquidity above last week’s high and into the monthly imbalance. If support holds, continuation toward premium levels is likely. A break below support invalidates the bullish scenario and shifts the structure bearish.
A false break and rejection (turtle soup) could still keep the bullish case intact if followed by strong buy pressure.
Video Link: www.youtube.com

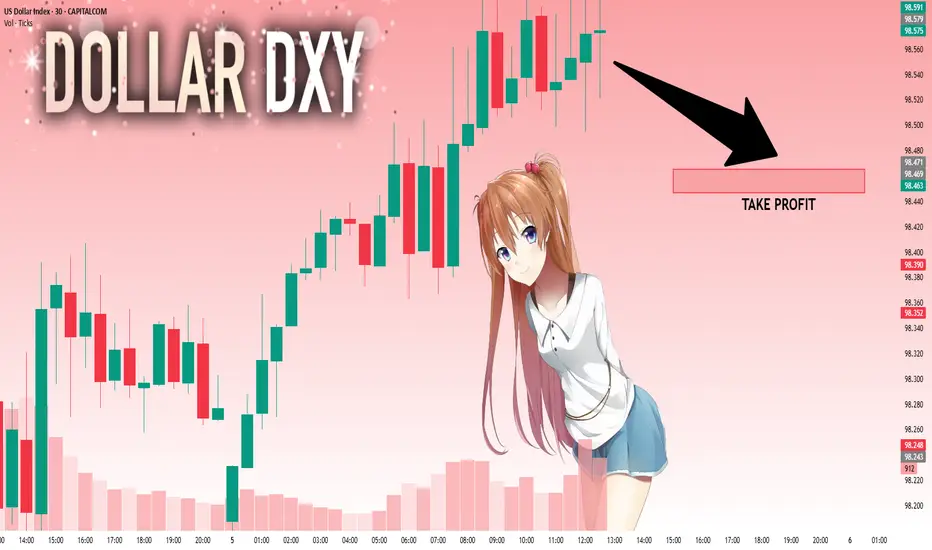
DXYThe U.S. Dollar Index is showing weakness after rejecting a key supply zone. Price has broken below recent support, signaling potential downside continuation. If sellers maintain control, we could see further declines toward the next demand zone.

USD to continue down?: Weekly Review/ fundamental analysis There was a lot of information to take in during the week starting Monday 28 July. A US / EUR trade deal announcement, US GDP, MICROSOFT earnings all contributed to positive market sentiment as the S&P continued to push all time highs. But in a reminder that anything can happen, a combination of NFP, AMAZON earnings and fresh TARIFF UNREST, ensured the week ended on a sour note.
The week got off to a good start with the US / EUR announcement. Although the news weakened the EUR as it appeared the US got the better end of the deal. And all of last weeks EUR positivity was unwound.
Despite the overall positive market mood at the beginning of the week, the currencies once again didn't quite correlate with the environment, as the USD and JPY both started the week particularly strong. Which could have been put down to 'EUR liquidity', meaning the USD and JPY benefited most from the weakness of the EUR. But, more likely, I suspected it was 'positioning' ahead of the important central bank interest rate meetings.
The meetings didn't disappoint, starting with the FOMC. The overall message was a continued reluctance to immediately cut interest rates. In a thinly veiled dig at the president, the line, "looking through inflation by not HIKING rates" sent the USD soaring as the probability of a September cut dropped to 40%.
A few hours later it was the BOJ'S turn. Although acknowledging inflation, a reluctance to immediately HIKE rates disappointed JPY bulls. And when added to positive MICROSOFT earnings, by Thursday's European session we had a peak JPY short opportunity.
But, alas, it wasn't long before disappointing Amazon earnings and the president stirring the tariff pot rocked the boat. And when Friday's NFP data 'surprised to the downside', the rot set in, the S&P dropped and in particular, sentiment for the USD crumbled. And the probability of a September rate cut significantly rose back up to 90%.
It's difficult to trade NFP at the best of times, but particularly when ISM data shortly follows. But I wouldn't argue with anyone who fancied a USD short on Friday.
I begin the new week with an open mind. I do think the S&P has a good chance of recovering (it's only natural for traders to use bad news as an excuse to take profits from all time highs). Sentiment for the USD could remain subdued, I suspect the US 10year will be a prominent part of the narrative.
On a personal note, outside of trading, drunk idiots smashing a bakery window and a member of staff leaving at short notice kept me busy. But I did manage one trade. A post BOJ 'short JPY'. It was coin toss between a post FOMC 'USD long' or a standard 'risk on AUD long'. I plumbed for the AUD. Ultimately, it wouldn't have mattered and the trade it profit.
Please feel free to offer thoughts questions, maybe you've spotted something I've not mentioned.
Results:
Trade 1: AUD JPY +1.3
Total = +1.3%
DXY Analysis todayHello traders, this is a complete multiple timeframe analysis of this pair. We see could find significant trading opportunities as per analysis upon price action confirmation we may take this trade. Smash the like button if you find value in this analysis and drop a comment if you have any questions or let me know which pair to cover in my next analysis.

DXY POTENTIAL SCENARIO two possible scenarios for DXY in next coming weeks , watch the support and wait for confirmation before buying Dollar ,
