Dyx us dollar I think the US dollar will fall sharply, causing a sharp rise in gold. There will probably be a bigger fall than in 2008 in the global economy, especially in the US.
DXY trade ideas

DXY bullishDXY is in the early stage of a bull market, so no one want dollars but in my view but the trend is your friend.
This could be a impulsive 5 of 5 or a B of ABC but both are bullish, another view is that the EURO have been a bad day when the US and EU reach tariff agreement??
The lagging indicators are changing or I hope, but this bullish trend for the Dollar could continue for weeks...

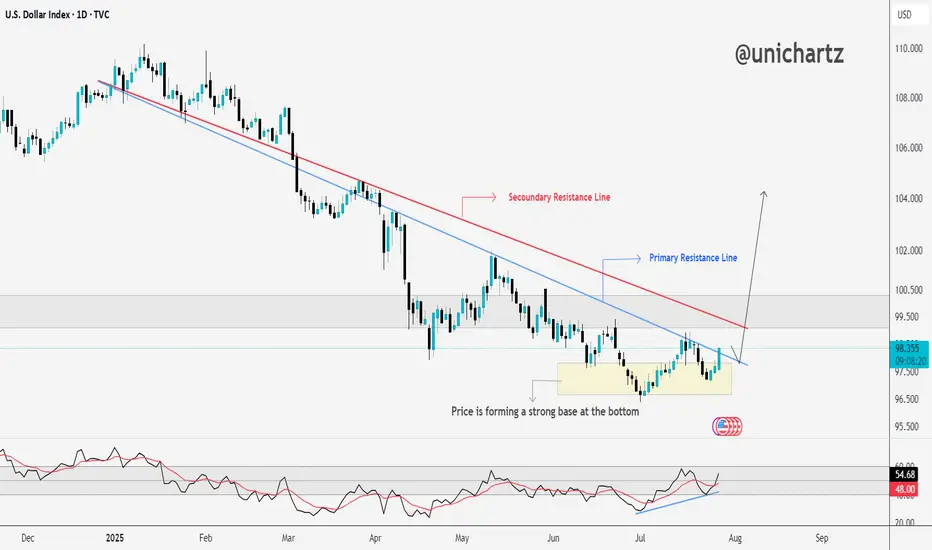
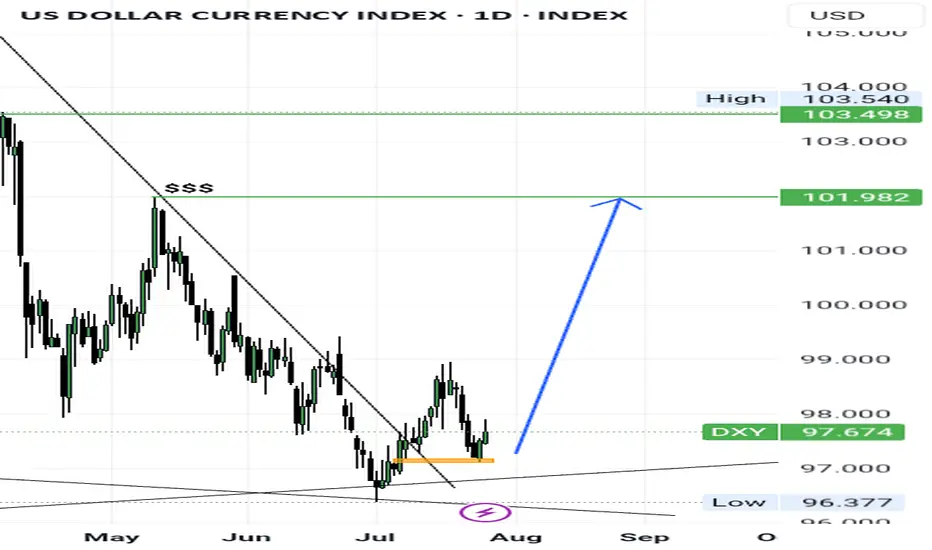
DXY Approaching Key Resistance — Trend Reversal Ahead?The DXY is forming a strong base at the bottom, showing clear signs of accumulation after a long downtrend.
Price has started pushing upward and is now approaching the secondary resistance line. A breakout here could open the path toward the primary resistance zone, which has capped rallies in the past.
The RSI is also trending higher, supporting this potential move.
If bulls clear the red resistance line, momentum could accelerate quickly.
DYOR, NFA
DXY - trade - market structure DXY - trade - market structure , easy setup, clean setup , good probability, if this happen is a big win, use risk and trade managment
Key Events That Could Shape the Dollar This Week🇺🇸 Key Events That Could Shape the Dollar This Week
Three major catalysts are on the radar for USD traders:
📊 ADP Employment Report
💰 Advance GDP (Q2)
🧠 Fed Chair Powell’s Speech
Additionally, ongoing trade developments with the EU may add to volatility.
📊 1. ADP Employment Report
The July ADP report is forecast to show 82K job additions. While this may seem consistent with recent NFP strength, several red flags suggest growing labor market weakness:
Decline in labor force participation
Slowing wage growth
Emerging contraction signals in the services sector
Even if ADP meets expectations, it may not reflect broad-based labor market health. Historically, ADP and NFP have often diverged—so the market reaction may be muted unless the data surprises meaningfully.
💰 2. Advance GDP (Q2)
Q2 GDP is expected to show modest growth, possibly supported by:
Higher tariff revenues boosting government income
A weaker dollar improving export competitiveness
Reduced imports due to elevated import costs
However, much of this growth is likely nominal rather than real. With inflation remaining sticky, headline GDP may be inflated by price effects rather than true economic expansion. Real GDP could remain flat or weak.
🧠 3. Fed Chair Powell’s Speech
This is arguably the most market-sensitive event of the week.
Goldman Sachs and other major banks believe the recent resilience in U.S. data lowers the chances of a rate cut at this meeting. However, political dynamics could add nuance:
With Donald Trump actively campaigning—and reportedly pressuring the Fed to ease rates to boost exports and growth—Powell may face a fine balancing act in his tone.
Markets will dissect every word for clues on future policy.
🌐 U.S.-EU Trade Developments
The U.S. recently announced a new trade agreement with the EU, including a 15% tariff on selected European imports.
In the short term, this could be dollar-supportive, as it:
Favors domestic producers
Reduces reliance on imports
Potentially improves the trade balance
Yet over the longer term, such tariffs can be inflationary and disrupt global supply chains—possibly complicating the Fed’s decision-making.
⚠️ Final Thought
In times of policy uncertainty, markets lose their predictability.
Tariffs, in particular, often have a stronger and more immediate impact than calendar-based economic data.
As a result, traders must monitor trade-related news and tariff decisions just as closely—if not more—than traditional economic releases in order to stay ahead of market direction and central bank decisions.
DXY Bearish Trend The DXY is expected to enter a bearish phase, with a potential decline starting from the 98.26–98.35 range, and possibly extending down to the 95.20–94.50 levels, which are anticipated to act as key support zones during the upcoming downtrend
A news-packed week.In this week, which could be considered the most news-packed week of the year, anything can happen. Due to the strength of the news, there's a high possibility that many of our analyses might fail, while many targets could also be hit.

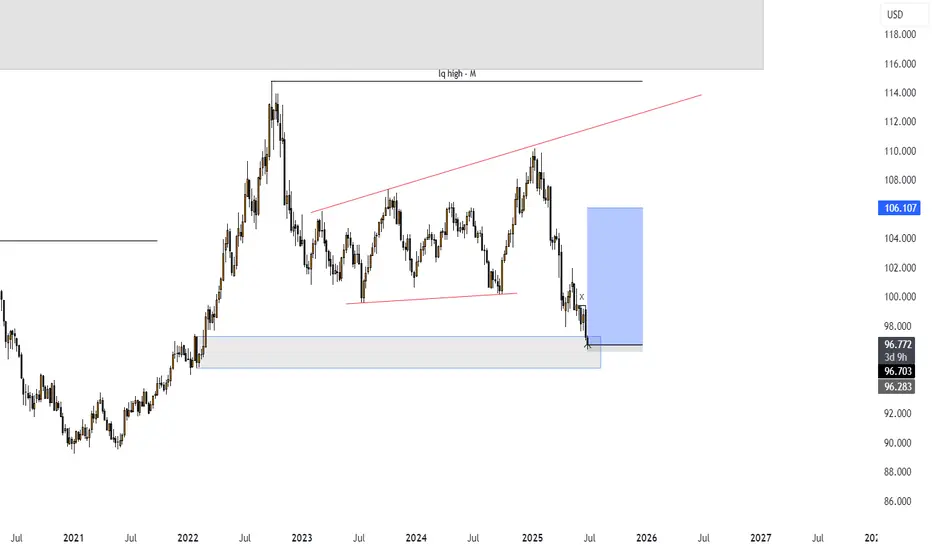
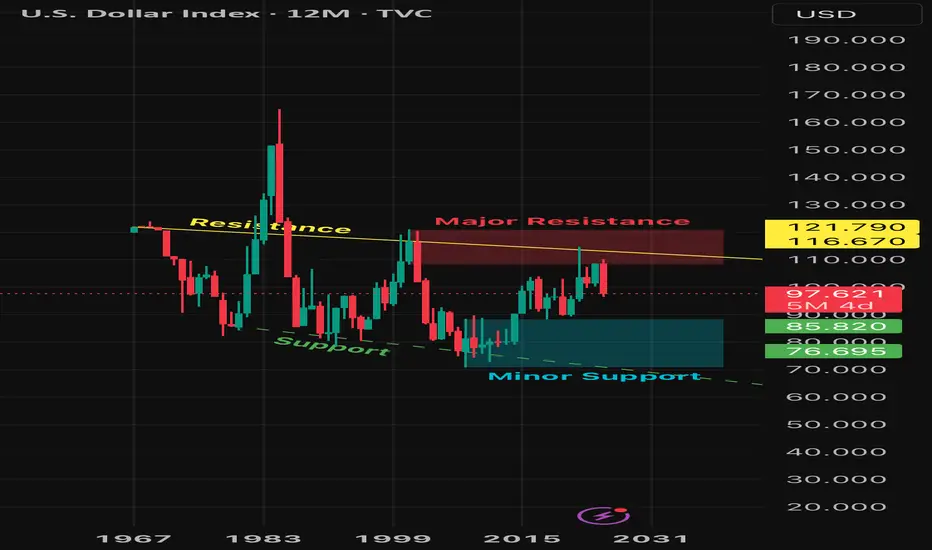
DXY: The Graceful Short This is interesting…Ever since the birth of Bitcoin, the DXY was in an overall uptrend, but that uptrend may have ended in the resistance zone. Price seems to have reversed for the DXY especially after the formation of a bearish engulfing candle on the 6M timeframe. Price may end the year within or on top of the support zone.
What does this mean for crypto and other assets?
If the DXY has reversed and is now in a long term down trend, crypto currencies and other assets will be in long term uptrends! Bitcoin may skip its upcoming bearish year next year or more than likely the bearish year will happen but the retracement may be short. Stay tuned!
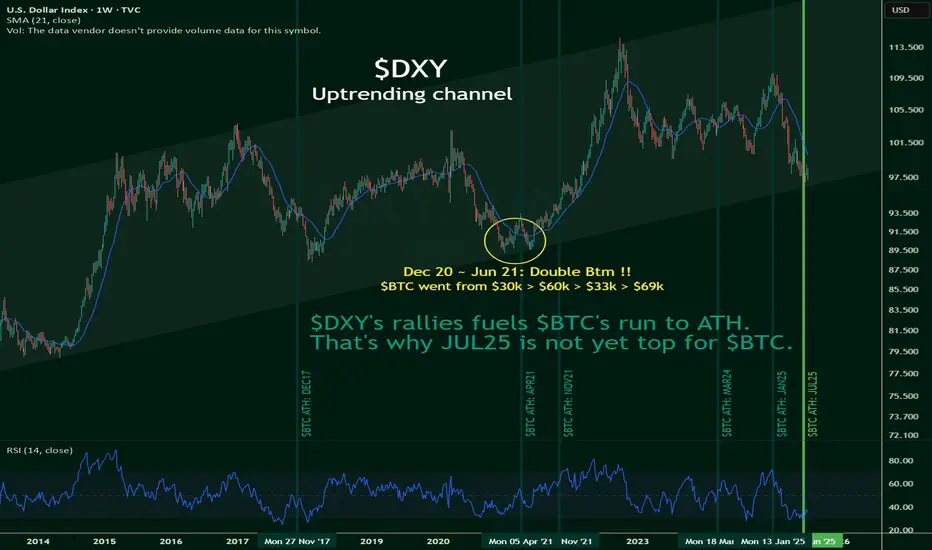
$BTC's run to ATH is fueled by $DXYNOT FINANCIAL ADVICE
I've yet to see this being mentioned anywhere on the internet, but TVC:DXY 's rally may just be CRYPTOCAP:BTC 's best friend.
This, despite the popular notion that when TSX:DXT goes up, CRYPTOCAP:BTC goes down, and vice-versa.
However, this novel idea puts a break to it.
TVC:DXY is hitting the bottoms of its uptrending channel, and it's likely to bounce back up towards the ceilings.
Which means a rally is likely, and this is kinda good for $BTC.
I'll remain bullish, until the numbers say otherwise.
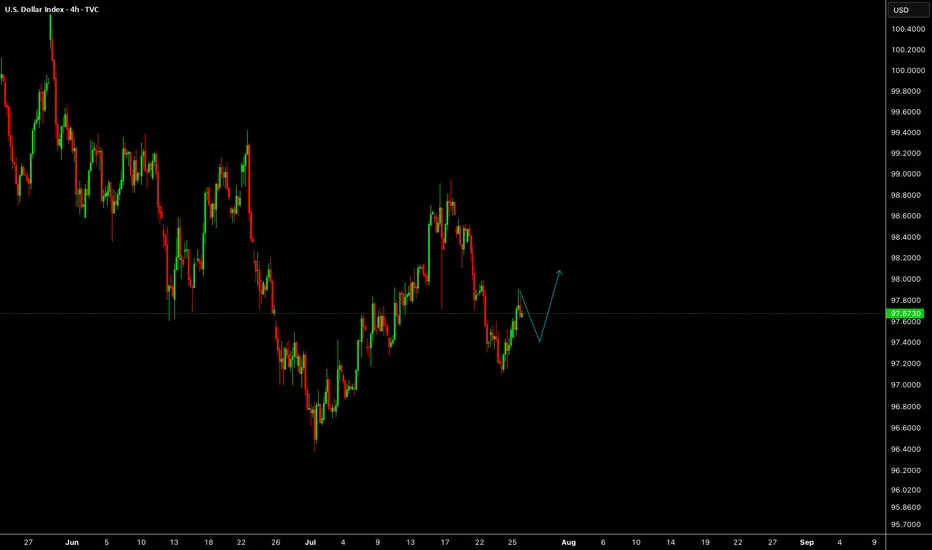
DXY Outlook: Can Fed Hold Spark a Move Toward 100?DXY Weekly Forecast – July Week 4
After reaching 96.50 early this month, DXY began showing bullish signs. Last week, price retested the extreme demand zone at 97.00 and closed with a bearish weekly candle that held some bullish pressure at the base.
This week, all eyes are on the Federal Reserve meeting. If the Fed holds rates steady, the dollar could strengthen further. A weekly close above 97.90 would confirm the breakout and open the door to a run toward 100.00 — a key psychological and technical level.
Bias: Bullish (if 97.90 breaks)
Key Zones:
• Demand: 97.00
• Breakout Level: 97.90
• Target: 100.00
This could be the beginning of a fresh bullish leg — especially if macro conditions align with technical structure.
—
Weekly forecast by Sphinx Trading
Let me know your bias in the comments.
#DXY #DollarIndex #ForexForecast #SphinxWeekly #SmartMoney #FOMC #USD #InterestRates

DXY forecast From weekly view the DXY is looking bearish at least till 95.123 key level the will see if we get a bullish power as the DXY is forming a reversal pattern. But of course many factors plays part in this economy, for example, global news like Tariffs and other factors.
So when DXY is trading on the 95.123 key level additional confluence will give us the right to put on trades, as the 95.123 key level is significant for what will take place next.
Take you all.......

DXY 4Hour TF - July 27, 2025DXY 7/27/2025
DXY 4hour Bearish Idea
Monthly - Bearish
Weekly - Bearish
Dailly - Bearish
4hour - Bearish
**We analyze DXY as an indicator of USD strength on a week to week basis**
This week is looking like we can expect bearish momentum on USD but here are two scenarios breaking down the potential:
Bearish Continuation - USD pulled a strong bearish reversal all last week which pushed us below our major 98.000 support zone.
We are now testing that same 98.000 zone as resistance and are looking to see if it will hold. Ideally, we can confirm further bearish structure to gain confidence in a bearish USD for the week ahead.
Bullish Reversal- For us to consider DXY as bullish again we would need to see bullish structure above our 98.000 zone. This would include: A break back above 98.000 with an established HH and HL.

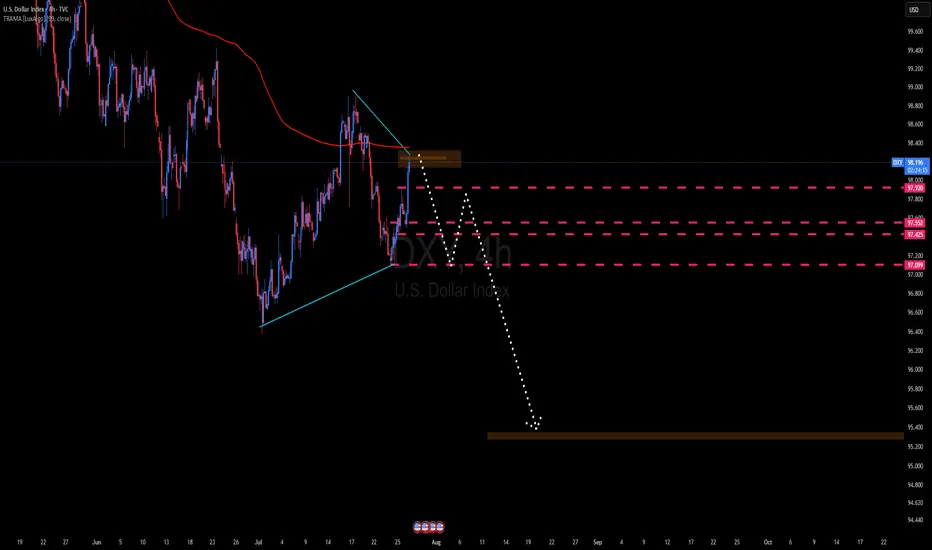
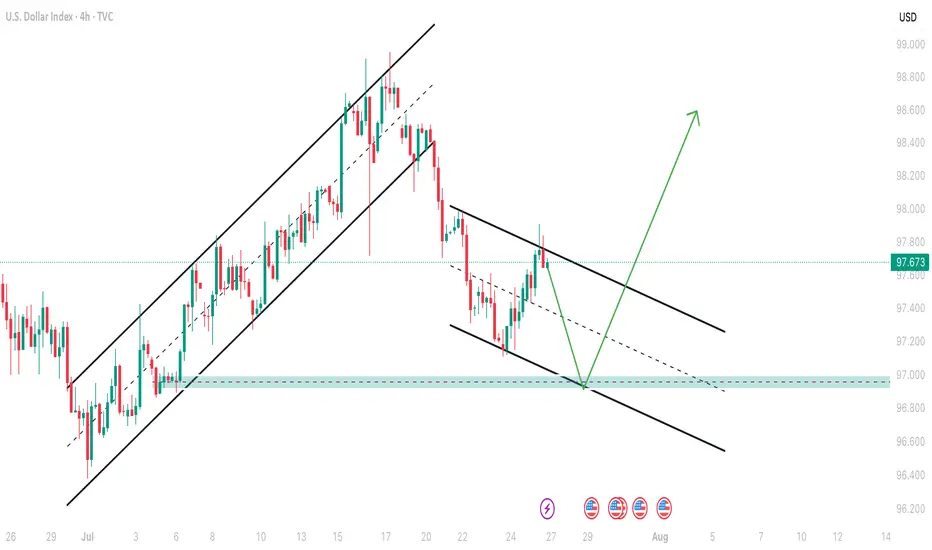
Breakout of the channelAfter the DXY broke out of the channel, it formed a range.
We can see a yellow trendline where the price is moving exactly along it.
If this trendline breaks to the downside, we can take a short position targeting the bottom of the channel.
Otherwise, it would mean the trend reversal in DXY is confirmed.

DXY weekly outlookDXY Weekly Outlook
This week, I’m watching to see if the dollar continues its bearish trend or breaks above the current supply zone. We've already seen a strong reaction from the 8hr supply, but price could still tap into the 1hr supply before making its next move.
If price drops from here, I’ll be looking at the 2hr demand zone below for a possible bullish reaction. If DXY pushes up from that zone, pairs like EU and GU could drop — which lines up with my overall short bias on those.
Gold may not always move in sync with the dollar, but DXY still gives a good idea of market sentiment.
Let’s see how it plays out and stay reactive.

DXYJULY 21-25 recap
Net was -296 last week
Price dropped until Wednesday
Hit the weekly demand zone (strong support)
Sellers paused or covered shorts there
Buyers stepped in → possible bounce or reversal

I HATETO BETTING. LET SEE WHY DXY Goes to there in my scenarioon August scenario
* Trumph's 10% import Tariff (Decision imminient)
* Powell speaking at Jackson Hole (August 22-24)
* Safe Haven printing Money

DXYDXY needs some more correction, if the correction is completed before Feds decision then a drop can follow otherwise Feds will push it up and NFP will drop it again.
Disclosure: We are part of Trade Nation's Influencer program and receive a monthly fee for using their TradingView charts in our analysis.
DXY index moving towards down in higher timeframeAs you can see DXY index is moving inside channel and now its time for second swing failure to go down.Then channel movement will finish and it will breakout towards upward so i recomand trade USD pairs accordingly.This is my analysis not a financial advice so trade according your risk management.
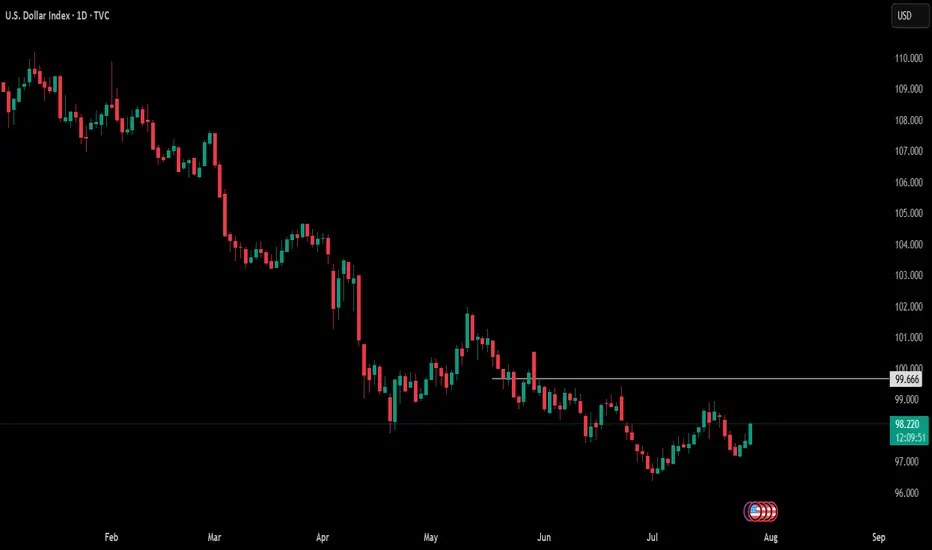
Dollar Index Dips – All Eyes on 97.600?The US Dollar Index (DXY) is currently trading just below the 100.000 🔼 resistance area, following a series of lower highs and lower lows that reflect a clear bearish trend. Price is now approaching the 97.600 🔽 level, which has previously acted as a key turning point and could influence the next directional move.
Support at: 97.600 🔽
Resistance at: 100.000 🔼, 101.500 🔼, 102.812 🔼, 104.223 🔼
🔎 Bias:
🔽 Bearish: The trend remains bearish while price stays below 100.000. A break below 97.600 may lead to further downside continuation.
🔼 Bullish: A bounce from 97.600 followed by a move back above 100.000 could open the door for a recovery toward 101.500.
📛 Disclaimer: This is not financial advice. Trade at your own risk.

DXY HEADING INTO LAST WEEK OF JULY DXY ZONES
WEEKLY TF, TO DAILY, TO 4HR ANALYSIS.
The successful devaluation of the dollar by the administration since the election continues.
DXY dumped below key daily support at 97.600.
It was reclaimed but failed at key daily resistance dating back to 2024 — the same zone as the 0.382 Fibonacci level.
Failure to gain support at 97.580 (0.23 Fib level) = a bearish signal for the dollar index (DXY), potentially sending it back down to the 97.100–97.200 range. If that breaks, look for a further continuation toward the 96.700–96.800 zone.
This is a big week for news, reports, and interest rate decisions for the U.S., EUR, and CAD, as we close out July.
Still bearish on DXY for now.
However, if the dollar can break through the 97.950–98.000 range and catch support — then push past the 98.135–98.200 zone (0.618 Fib level) — I’ll be looking for a long entry on DXY up to the 98.900–99.400 zone for the next test.
Again, I remain bearish for now, but depending on the data and what the Fed does with U.S. rates, we could see a strong DXY this week. Until we pass those zones, I’m staying bearish.
New to trading (6 months in) — before you leave any hate comments:
I’m here to learn and would genuinely appreciate any advice or help in becoming better and more thorough.

Dollar indexDollar index in deep discount
Looking for higher prices this month
This my idea not a signal
#ICT
DOLLAR DXY dollar index on monthly support and we are watching the price action.lets watch the price action.
#dollar

dxy buy tradeThe Relative Strength Index (RSI) is showing an upward trend, indicating increasing momentum. Additionally, the Moving Average Convergence Divergence (MACD) is showing a bullish crossover, further supporting the potential for an upward move
