🎋TKO-- Symmetrical triangle bottomThe price is trading in the lower part of the formation, and has recently bounced of key level (1.76) and dynamic support (lower trendline) A lot of resistance ahead, the setup is pretty much the same thing as BINANCE:FILUSDT (see related ideas). This is an opportunity to get a decent entry at low price for a long-term hodl.
Entry: buy in the green area (current price)
Targets:
TP1: 2.10
TP2: 2.33
TP3: 2.90
TP4: 3.48
TP5: 3.80
TP6: 4.96 (~160%)
TP7: OPEN++
------------------------------
About TKO:
Tokocrypto was launched in September 2018 and became the first entity registered under Indonesia's Commodities Futures Trading Regulatory Agency (BAPPEBTI) by November of that year. Tokocrypto’s latest project, TKO, is the first Indonesian cryptocurrency to offer a unique hybrid token model.
The token serves several purposes on the Tokocrypto blockchain platform and allows users to participate in crypto exchanges, deposit and savings programs, cross-platform DeFi applications, and NFT marketplaces. Toko Token was officially launched in April 2021 and has since attracted the attention of both private and enterprise users. The Tokocrypto platform was created in tandem with Binance, which serves as a significant backing for the project and its future development.
Source: coinmarketcap
TKOUSDT trade ideas

TKO - is there a pump soon ?!TKO has been in consolidation for a long time, it is likely that the big players are now accumulating their positions. Also, a trend line has been formed on the chart and the price is moving towards it little by little. It is worth noting the squeeze, which is a signal for a breakout and continuation of growth. But we should not reject the variant of correction, bitcoin has been growing for a long time without significant corrections, and therefore we should also keep the variant of the price decrease, and after the breakout of the trend line and growth.
Write in the comments all your questions and instruments analysis of which you want to see.
Friends, push the like button, write a comment, and share with your mates - that would be the best THANK YOU.
P.S. I personally will open entry if the price will show it according to my strategy.
Always make your analysis before a trade.

TKO is ready for BullTKO has a good accumulated, and it's ready now for bulling time it can reach 4usdt, and possible to continue till 5.6 as shown.

TKO / TOKOCRYPTO TRADING PLANNING SPOTTKO in the BEARISH SCENARIO
Good coin for the collection
We waiting for the best price
Hopefully we can reach that price
#tipsfortradingplanning

TKO strong trendline break up !!! TIME TO BUY as we can see the trndline is nearly broked and price pass it. personaly i bought it with 5 percent of my mony and i think it go to moon, if price go down to the green box i will buy 5 percent more.

TKOUSDT Take Profit 2.4 2.6 2.8TKOUSDT
Entry price near 2.080
Stop loss 1.940
Take Profit 2.4 2.6 2.8
Risk Reward 1:5

TKO breakout in processI believe TKO will hit 2.5 2.62 2.75 range soon as the breakout is currently in progress

TKO/USDTAdam and Eve didn’t have time to play before the cue ball fell, let’s be patient and wait for his work

🆓Toko Token (TKO) Oct-21 #TKO $TKOTKO is trying to conquer the $2.2 zone to continue rising to the $2.8 and $3.2 zone.
📈RED PLAN
♻️Condition : If 1-Day closes ABOVE 1.8$ zone
🔴Buy : 2 - 1.8
🔴Sell : 2.2 - 2.8 - 3.2
📉BLUE PLAN
♻️Condition : If 1-Day closes BELOW 1.8$ zone
🔵Sell : 1.8
🔵Buy : 1.6 - 1.5
❓Details
🚫Stoploss for Long : 10%
🚫Stoploss for Short : 5%
📈Red Arrow : Main Direction as RED PLAN
📉Blue Arrow : Back-Up Direction as BLUE PLAN
🟩Green zone : Support zone as BUY section
🟥Red zone : Resistance zone as SELL section

Tko chart analysis #TKO USDT 1D Chart SIGNAL by Sajjat Hossen
♻️ Add Toko In You WatchList. Try To Buy After Breakout Upper Trend Rejection. If Price Successfully Close Above $2.23 Without Rejection. Also
Stop-loss ❌ If 1D Candle Close Below The $1.85

TKO 2HRS BULLISH SIGNTKO
Tokocrypto was launched in September 2018 and became the first entity registered under Indonesia's Commodities Futures Trading Regulatory Agency (BAPPEBTI) by November of that year. Tokocrypto’s latest project, TKO, is the first Indonesian cryptocurrency to offer a unique hybrid token model.
❇️Entry Zone :- 1.6 - 2.07
🔥Targets :- 2.4 - 2.7 - 3 - 3.4 - 4
Only for Accumulate and HODL

TKO - buy after that...🚧TKO - preparing to break the key $2.22 level. Which acts as strong resistance. Previously, the price tried to break this level, but failed so far (marked with a red arrow + rising volumes, which is a bad signal).
Now the price is slowly moving towards the level. A good buying opportunity will be after a breakdown or a retest of $2.23.
Write in the comments all your questions and instruments analysis of which you want to see.
Friends, push the like button, write a comment, and share with your mates - that would be the best THANK YOU.
P.S. I personally will open entry if the price will show it according to my strategy.
Always make your analysis before a trade.

TKO - the best project for hodl ❗❗TKO is a very cool project from a fundamental point of view.
The token performs several functions on the Tokocrypto blockchain platform and allows users to participate in cryptocurrency exchanges, deposit and savings programmes, cross-platform DeFi applications and NFT marketplaces. Tokocrypto platform was created in tandem with Binance, which serves as a significant support for the project and its further development.
The coin has moved from the bottom of the triangle, which serves as strong support. It is now in a range near the resistance level. It is very likely that this level will be broken and the next target will be the area marked above.
The long term target is at $9-10.
If you want us to analyze your coins, write their ticker in the comments.

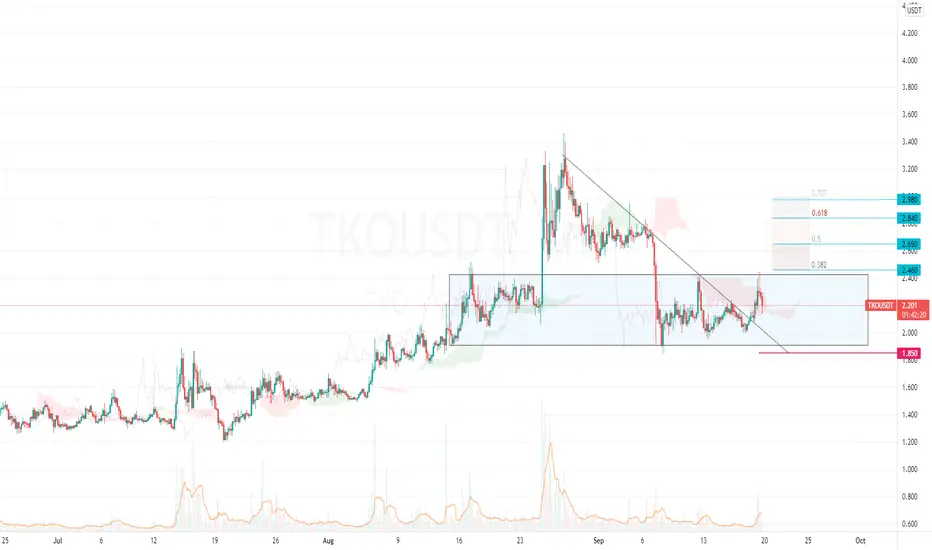
TKO/USDT Breakout TKO broke the trendline and retested on 1h and 4h graphs.
Blue lines are possible target prices and strong support/resistance places.
TP1: 2.506
TP2: 2.9
TP3: 3.460
TP4: 4.982
I believe that price will most likely follow the green path, as there is strong resistance at 2.9.
Let me know what you think about this forecast.
This is not a financial advise, just my opinion.

TKO NEEDS JUST A PUSH As described in the chart. If TKOUSDT succeed to broke the resistance the flight will take of.

$TKO has been monitorised Has the potential to attract $tko to be one of the preferred tickers from youravity-research.
Even though the stop loss is a bit far away, it's also possible that $tko can close the previous cvg.
Cheers - youra

FORMED PATTERN It formed a triangle pattern on the daily frame, and the pattern was broken and buying after retesting

TKO - one of the best project 🔥🔥TKO is a very promising project from a fundamental point of view. The capitalization is small, which is very good. Long-term potential is 5-10x.
On the chart, a triangle pattern has formed on the higher timeframes. Now the price is near the lower boundary, a good opportunity to take a long-term position with low risk. The best buying opportunity will be after a breakdown of the local trend line.
Write in the comments all your questions and instruments analysis of which you want to see.
Friends, push the like button, write a comment, and share with your mates - that would be the best THANK YOU.
P.S. I personally will open entry if the price will show it according to my strategy.
Always make your analysis before a trade.


TKO/USDTBuy Around 2.10$ - 2.19$
Selling Targets:
1️⃣ Target: 2.46$ = 14% Profit
2️⃣ Target: 2.65$ = 22% Profit
3️⃣ Target: 2.84$ = 31% Profit
4️⃣ Target: 2.98$ = 38% Profit
🔻4h Close below : 1.85$ = 15% Lose
Signal Type: Short-Term⏱1/7, D
2021/09/19🗓
#Risk/Reward: 1/4
🏦Ex: Binance/Spot
🧩Capital 5% or 10%
📊#Technical_Analysis_by_Phoenix
tkousdtTKO starting the fifth wave I thought we will buy after pass 2.6$ this level is s/r level I thought and targets are 3.9$ and 4.9$

TKO Crossing Resistance line + Bullish MA Crossover (1HR)TKO cleared the MA 100 line and used it as support, and currently the MA 20 + 50 are about to cross over the MA 200.
This 1 hour chart set up is looking for a break to 2.37.
BUY IN: 2.0 / 2.1
TP: 2.35 - 2.4
For long term, we want to see a retest of the resistance line for support.
This set up is good for the next week. Wait for new signal development, or check the daily TKO chart.

TKO Resistance line + Bearish rejection TKO is coming now to cross its local resistance line, which is expecting a short term up swing. For a quicker time analysis check the 1 Hr chart posted.
This chart is for the longer time frame up to Nov 15.
There is a bearish flip to bullish zone between 2.0 - 2.13
Similar pattern has been posted multiple times before on TKO, and this is a good long term hold.
BUY 1: 2.13
BUY 2: 2.00
TP 1: 2.37/2.4 --- > Supported by the 1hr chart 200MA crossover that's about to happen within this week (check linked chart)
TP 2: 2.67
TP3: 3.44
We need to close one daily candle above 2.4 for a push to 2.67
And after 2.67 we need to consistently close all candles above 2.67 for the push to 3.4 zone, aka TP 3.
Stop: 1.95 / 2.00
1 hr chart posted below.
