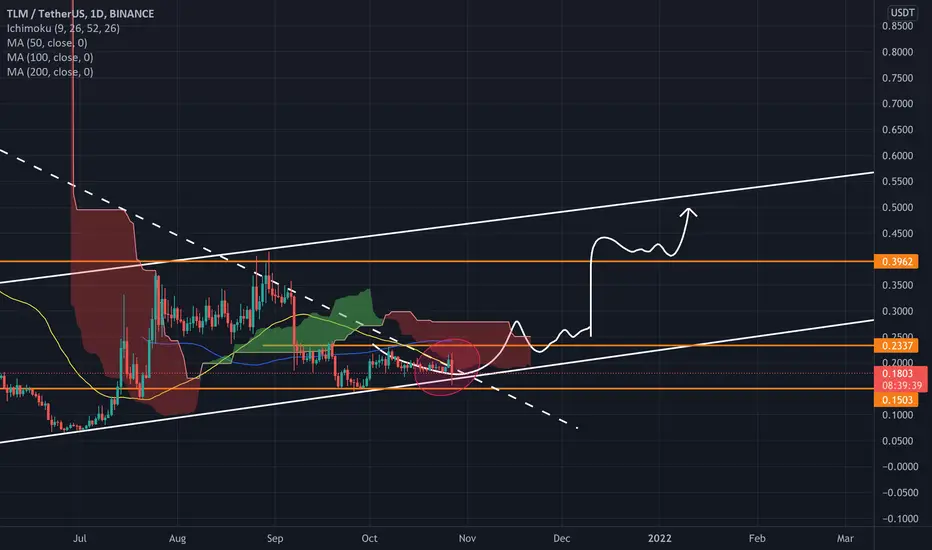
TLMUSDT Daily Timeframeif Daily close above red line
Every thing is clear in the chart
Red is resistance
Happy trade
not a advice
TLMUSDT trade ideas

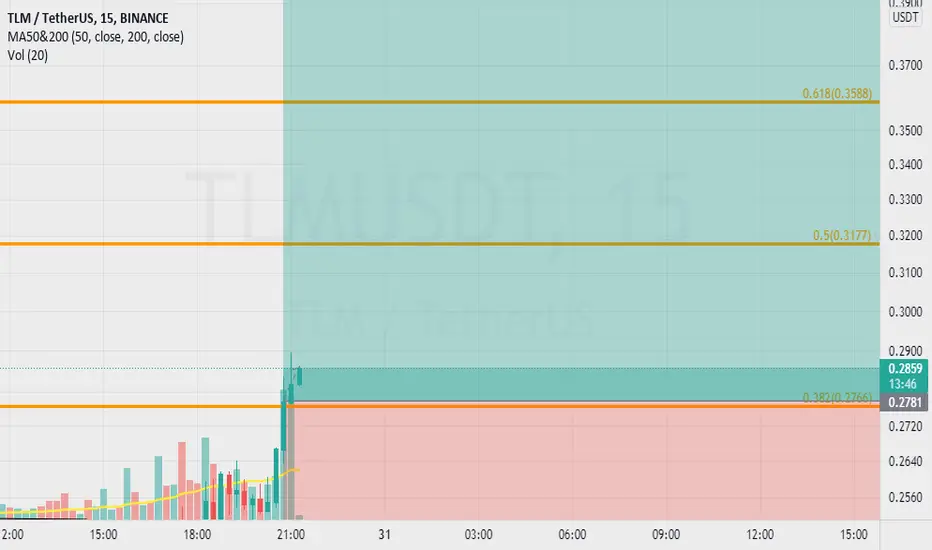
TML close to apexhuge triangle breaking out potential in mid Dec, short term price is at fib 0.618 at 0.276

#TLM ready to go to $1 in Q4#TLMUSDT broke out the resistance in 0.27 and ready to go to 0.41 - 0.50 - $1 (Midterm)

TLM/USDTTLM - USDT 🔚BINANCE
buy now : 0.184 $
🔸TARGET💰
🔹0.85
🔹1.29
🔹 2.02 🔥 for hodl
🎯 time about 2.02 : 2 months or 3 month

TLMUSDT AnalysisHello friends.
Please support my work by clicking the LIKE button(If you liked).Thank you!
Everything on the chart.
open pos: market and lower
target: 0.25 - 0.28 - 0.31 and maybe 0.36
after first target reached move ur stop to breakeven
stop: 0.137(depending of ur risk). ALWAYS follow ur RM .
risk/reward 1 to 4
risk is justified
Good luck everyone!
Follow me on TRADINGView, if you don't want to miss my next analysis or signals.
It's not financial advice.
Dont Forget, always make your own research before to trade my ideas!
Will be very APPRECIATE FOR UR DONAT/coins :)
Open to your questions or suggestions(Looking for investors!).

TLMTLM / USDT
if price hold above horizontal support next few hours/ days expecting bullish wave
Keep your eye on it
Best of wishes ❣️

TLM Long positionIf my counting is correct, TLMUSDT would start a huge increase marked, firstly, in those two targets.

TLM (Alient World) 276% potential gainsHello Traders,
As you can see here we have a long term trend line on TLM that is just being broken. Wait for the retest on this one!
Have a green week,
Savvy
As always, here is some useful information regarding this coin below.
TLM Price Live Data
The live Alien Worlds price today is $0.288723 USD with a 24-hour trading volume of $598,585,647 USD. We update our TLM to USD price in real-time. Alien Worlds is up 33.74% in the last 24 hours. The current CoinMarketCap ranking is #268, with a live market cap of $263,901,689 USD. It has a circulating supply of 914,030,370 TLM coins and a max. supply of 10,000,000,000 TLM coins.
If you would like to know where to buy Alien Worlds, the top exchanges for trading in Alien Worlds are currently Binance, Mandala Exchange, FTX, Bitget, and KuCoin. You can find others listed on our crypto exchanges page.
To learn more about this project, check out our deep dive of Alien Worlds.
What Is Alien Worlds (TLM)?
Alien Worlds (TLM) is a decentralized, non-fungible token (NFT) metaverse, where players compete for scarce resources, Trilium (TLM), in a stimulated economy centered around planetary worlds. Due to this, Alien Worlds also has a decentralized finance (DeFi) element to the game, as players advance by staking TLM and using TLM to vote in Planet Decentralized Autonomous Organizations (DAOs).
Play-to-earn (P2E) NFT games have seen an exponential rise in popularity and value this year. Alien Worlds allow the players, called “explorers” to earn monetary rewards through gameplay or participation in Planet DAOs. By mining in Alien Worlds, a user is rewarded with the native, in-game currency — Trilium (TLM) or NFT packs. Players can stake TLM to boost their rewards or battle with other users for NFTs.
To date, Alien Worlds has established a fair amount of its roadmap, having TLM on Binance launchpad and farming period of TLM on Binance Launchpool. A large portion of game developments have been forged as well. Moving forward, Alien Worlds aims to automate the claiming process of daily allocation to landowners in the game. Artifacts NFTs are soon to be released, and future plans include NFT interoperability.
Who Are the Founders of Alien Worlds?
The game is developed by German developers Dacoco GmbH, who have created three projects to date. Alien Worlds was created in 2020.
Dacoco is based in Zug, Switzerland, which is deemed Switzerland’s ‘crypto valley’, due to the number of blockchain and crypto companies based there. They claim to be decentralized autonomous community organizations experts, and also act as guild validators on WAX.
What Makes Alien Worlds Unique?
Alien Worlds’ first unique feature is that it is a gaming metaverse that features numerous DAOs, giving every TLM coin holder a stake in deciding who runs the platform, allowing people to use TLM to stake, vote or even become a leader.
Players can stake their TLM to Planet DAOs, which then shows their alliance to a planet and allows them to receive more daily TLM rewards. Based on the amount of TLM staked, it affects the extent to which a user can vote for the future of the planet.
Becoming a leader in Alien Worlds is no foreign feat, as the platform allows players to run for candidacy to be a Councillor in more than one planet. Each planet can be managed by more than one elected Councillor, who will share multi-sig control over the respective Planet DAO account.
Another unique feature of Alien Worlds is that it is free-to-play, bypassing expensive barrier costs that are a feature of many traditional games and making it newbie-friendly.
In a testament to Alien Worlds popularity, it is the second fastest growing NFT game. According to DappRadar, it is the second in all decentralized applications (DApp) and first in all DApp games by 24 hour users. This could be attributed in part to the Alien Worlds community development efforts — they are active in 18 languages on Discord, a popular messaging platform for crypto communities, targeting english-native countries, China, Russia, Japan and Turkey. Furthermore, the team are also undertaking localization efforts to support Filipino, Indonesian and Indian players, where P2E games are extremely popular, as seen in the rise of Axie Infinity. Other community efforts include: onboarding well-known intellectual properties, supporting active Telegram and Discord communities, sponsored drops and promotion, supporting expansion effort and conducting regular AMAs.
Related Pages
Take a deep dive into Alien Worlds.
Learn about what play-to-earn is, and the top NFT games in 2021.
Read more about other P2E games: Binemon, My DeFi Pet, MOBOX, CryptoZoon, Kaby Arena and Guild of Guardians.
Find out more about CryptoBlades versus Axie Infinity, two of the top P2E games.
Visit CoinMarketCap Alexandria to learn everything you need to know about cryptocurrency and more.
How Many Alien Worlds (TLM) Coins Are There in Circulation?
As of September 2021, the total supply of Alien Worlds TLM token is 5,135,726,585 and the maximum total supply of TLM is 10,000,000,000. The allocation of the TLM token is as follow: 13.75% to seed sale; 6.69% to the TLM presale; 2.92% to the Binance launchpad; 3.5% for external protocol development; 9.24% for marketing expenses; 13.14% to the Alien Worlds foundation; 5.35% to the project advisors; 14.6% to the team; 3.89% for governance; 5.84% for liquidity provision; 3.41% as staking rewards; 0.78% used for security audits; 14.24% for ecosystem grants; 2.72% used for participation rewards.
How Is the Alien Worlds Network Secured?
Alien Worlds runs on three blockchains on which its native token TLM has been deployed: Binance Smart Chain (BSC), Ethereum and WAX.
Each of the three blockchains supports Alien Worlds’ various functions that let it run smoothly and safely. For a start, Binance supports the staking functionality, letting BEP-20 TLM holders to run missions. On the other hand, WAX allows for a free transactional layer for most of the core gaming logic.
NFT image data is stored on the peer-to-peer Inter Planetary File System (IFPS), allowing this data to remain decentralised and allowing external applications to stay in touch with on-chain functions and data so that the games and functionality can run as per usual.
Can Alien Worlds Coin Hit $10?
Across the year, Alien Worlds has hit a low of $0.0666 and a high of $$7.19. To reach $10 would imply an over 50 times price increase from the current price, as of Sept. 13, 2021. While this is not a large jump in the crypto world and is a reasonable target to achieve. As with all coins, hitting this target would greatly depend on the project team reaching its objectives and the community backing it.
Where Can You Buy Alien Worlds?
Alien Worlds is listed on several cryptocurrency exchanges. Among them: PancakeSwap (V2), Gate.io and LBank.
Cryptocurrency newbie? You can read more about how to enter the market and how to buy BTC, TLM or any other token in CoinMarketCap education portal — Alexandria.

TLM: *pop*Easy trade imho. Broke $0.25 resistance, i’m going to ride this to $0.37. Given the current gaming narrative it should be a breeze.
Good luck!

TLM - is going to sky rocket 🚀🚀A global trend line has formed on the TLM chart. In addition, the price has been in accumulation for almost two months. If the price breaks the trend line, it would be a good buying opportunity. After that, the price will reach the marked targets marked at the top of the chart quite quickly.
Write in the comments all your questions and instruments analysis of which you want to see.
Friends, push the like button, write a comment, and share with your mates - that would be the best THANK YOU.
P.S. I personally will open entry if the price will show it according to my strategy.
Always make your analysis before a trade.

200%+! Must buy TLM!We saw the madness of the metauniverse and analyzed different cryptocurrencies,
Finally, we think TLM has great potential.
Buy him and hold him can get 200% profit
buy zone:0.17-0.19
SL:0.15
Target1:0.23
Target2:0.3
Target3:0.38
Good luck!


TLM A true coin which comes from bottom cheeks which always pumps when btc red. and it is getting ready. BTC pair supports the idea


#AlienWorlds #TLM: The Bull Run of Q4 (5X)Alien Worlds TLM: The Bull Run of Q4 (5X)
Resistance R: .23, .37, ATH (.87)
Potential of 5X- (1$-1.4$)

$TLM- STUCK INSIDE A BEARISH FLAG$TLM is like an emotionally abused partner in a relationship. They have continually manipulated the price movement that it is becoming boring charting the same thing over and over again.
hoping that the metaverse news will really push it out of that bear flag for good.
Until it makes it above 0.3 resistance area, it is going to be the same boring ol' story.

TLMUSDT 4h short-term forecastTLMUSDT 4h short-term forecast from Wunderbit
Confirmed divergences on 7 indicators
Flag pattern. White lines are targets for pattern development.
A large level along the volume profile coincides with the channel border. If the pattern is worked out, a breakout of a strong level.
The border of the global triangle.
In case of a breakdown, the expectation of a movement to 0.5.
As the viola season approaches, this is very likely.
Given the divergence, the probability of a stochastic reversal is high.

TLMThe L Massive gain
TLM for all who watching this!
watch this again NEXT YEAR.
YOU ARE A ALIEN?
alien gains? moon? where??
safe all lol..
Stone!!!!!!!!!!!!!!!!!

TLMUSDTI think it will be more correction movement.
I setted limit for futures:
buy at 0.162
stop: 0.139
target1: 0.2315 (43%)

TLM|USDTHey hey my friends👋
TLM is in a period of accumulation here, after long periods of accumulation you get crazy run ups - make sure you have some in your bags

TLM/USDT Will breakdown after price crosses lineWhy is that?
Ans1: I have noticed that people are no longer interested in getting back into the market. Usually everyone knows that when the price is near the crossing line. The price tends to rise as a bull market. But now that's not the case.
In the past, I have often seen that when the price reaches the crossing line. The market will become completely bearish.
BINANCE:TLMUSDT
