NATURAL GAS (18th - 20th SEP) OverviewNatural gas is supported by level 219.9 and is expected to rise in the near future, with a target of 228 in the coming sessions.
a breakout above 222.5 to confirm the bullish trend. If natural gas fails to break through this level, it could retrace back to the support zone at 219.9-221.9.
Overall, the technical outlook for natural gas is bullish. A breakout above 228 could lead to a further rally to new highs.
LNG1! trade ideas

NG1! SELLERS WILL DOMINATE THE MARKET|SHORT
Hello,Friends!
NG1! uptrend evident from the last 1W green candle makes short trades more risky, but the current set-up targeting 2.606 area still presents a good opportunity for us to sell the pair because the resistance line is nearby and the BB upper band is close which indicates the overbought state of the NG1! pair.
✅LIKE AND COMMENT MY IDEAS✅

NG1!: Market of Buyers
Balance of buyers and sellers on the NG1! pair, that is best felt when all the timeframes are analyzed properly is shifting in favor of the buyers, therefore is it only natural that we go long on the pair.
❤️ Please, support our work with like & comment! ❤️

Natural Gas Gold silver DXY Price Forecast support & resistance guide of Natural Gas Gold silver DXY

NG1! What Next? BUY!
My dear friends,
My technical analysis for NG1! is below:
The market is trading on 2.643 pivot level.
Bias - Bullish
Technical Indicators: Both Super Trend & Pivot HL indicate a highly probable Bullish continuation.
Target - 2. 693
About Used Indicators:
A pivot point is a technical analysis indicator, or calculations, used to determine the overall trend of the market over different time frames.
———————————
WISH YOU ALL LUCK

Will there be new annual lows for Natural Gas?Will there be new annual lows for Natural Gas?
The current period is characterized by strong volatility in the natural gas markets of the United States and Europe.
U.S. natural gas futures ranged between $2.5/MMBtu and $2.6/MMBtu.
The IEA reported that inventories are increasing more slowly than expected, with demand declining due to seasonally cooler temperatures.
However, some restrictions on operations at LNG export facilities limit extraction from American soil, and strikes at Chevron's LNG plant in Australia contribute to price volatility.
Despite all this, Natural Gas futures remain stable around 36 euros/MWh in Europe and 2.55 in the USA.
One wonders why American natural gas prices have not risen, despite rising global temperatures, dwindling offshore platforms around the United States and several hurricanes in the Atlantic Ocean.
Europe and the United States have ample supplies of natural gas.
Last summer, after large purchases during the war between Russia and Ukraine, fossil energy supplies remained adequate thanks to the abnormally mild winter.
All this allowed the supply to be quite stable in the first months of the year.
There is no need to worry about the effects of natural gas shortages, both for users and companies.
We have adequate supplies to ensure an economical and reliable supply.
The tremendous winter humidity and high snowfall that hit the western United States in 2022 wasn't just a nuisance; they have also caused an increase in demand for hydroelectricity, which decreases demand for natural gas energy.
Last year, the West saw a sharp increase in natural gas consumption, but this season appears to be different.
There will not be as much consumption as initially expected.
Furthermore, storms in the Atlantic do not have the expected negative impact on American production.
El Niño blows into the Gulf, offering protection from major hurricanes.
Remember that investors have another option besides trading natural gas futures.
In fact, they can focus on related stocks such as gas producers and distributors.
These securities offer dividends and are ideal for all those who do not want to commit to studying the futures curve.
Antero Resources Corporation is a company engaged in the development, production, exploration and acquisition of natural gas, natural gas liquids (NGLs) and oil properties located in the Appalachian Basin.
It is one of the largest independent energy companies. Their business is divided into three sectors: exploration, development and production of natural gas, NGL and oil.
From the technical analysis standpoint, you can easily notice a medium-term bearish trend.
Prices are sitting well below the 200-period moving average, with high volumes supporting the move.
The negative trend is therefore well-defined.
My model predicts annual lows in the $2 area.

Is Natural Gas(NG) Preparing for a Big Bounce???Technical Analysis:
- Natural Gas is in a weekly edging buy area and any moment it can bounce once wave (5) in blue will be done
- Anyway, the big probability with actual data is that a small extend could happen in the wave (5)
- H1 right side is turning down
- H4 right side is down
Technical Information:
- If you're a position trader or long term investor, you may buy in the actual level
- And if you're a swing trader, wait for possible extend in wave (5)

DAILY UPTREND CONFRIM natural gas gold silver DXY price forecastsupport and resistance guide natural gas DXY gold silver forecast
DAILY UPTREND CONFRIM


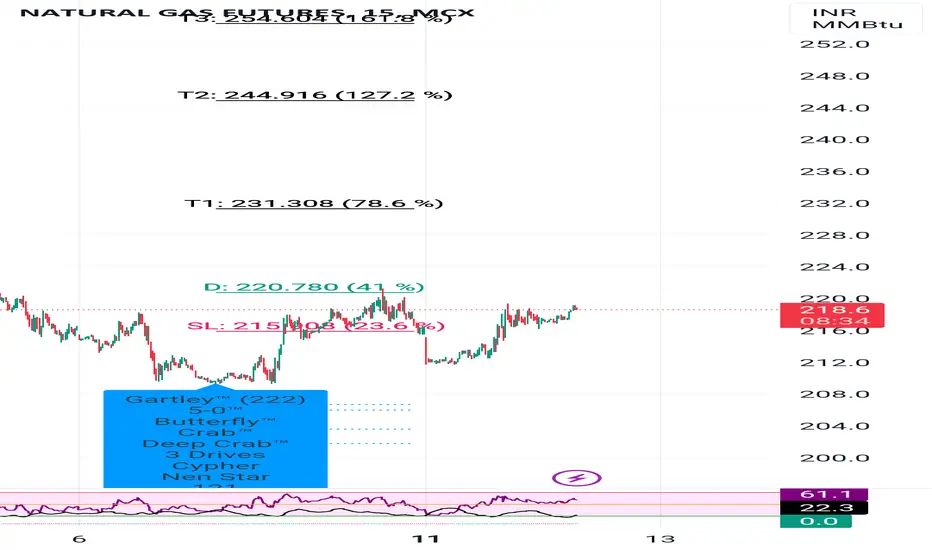
Natural gas ready for Upmove For all trade on my Auto Harmonic patterns indicator trade setup -
Risky trades can take trade after crossing 23.6% on either side and safe traders can take trade after 41% We can start buying when our Trailing SL hit at 23.6% with SL of recent low our Target will be 41%, 78.6% , 127.2% 161.8% and 223.6 % , when reversal pattern appears on chart we have to trail our SL if trailing SL hit exit from long trade and initiate sell trade ,
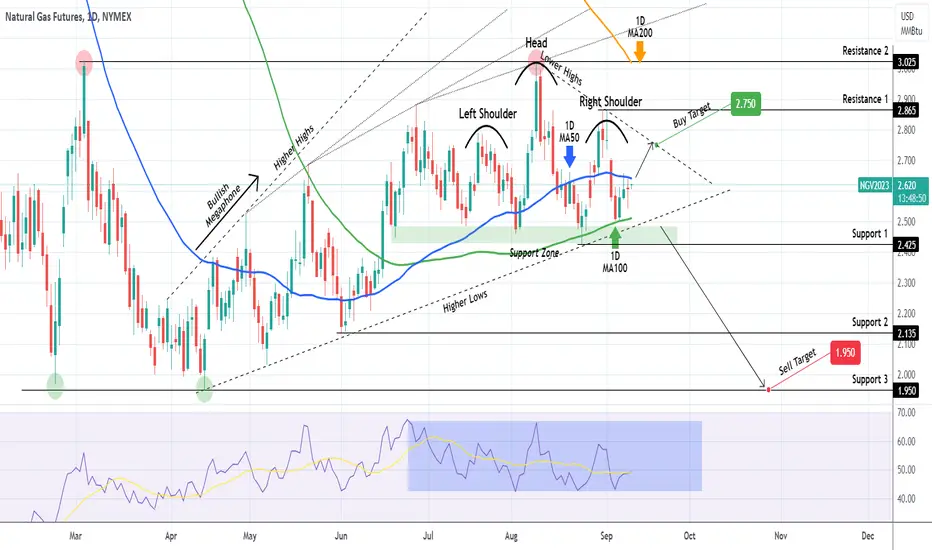
NATURAL GAS Short-term buy but expect long-term reversal soon.Natural Gas (NG!) is struggling to get past the 1D MA50 (blue trend-line), which is the short-term Resistance and at the same time is supported by the 1D MA100 (green trend-line). The long-term pattern is a Bullish Megaphone and besides the 1D MA100, the price action is supported by the pattern's bottom (Higher Lows trend-line).
Recently however the pattern that has emerged is a Head and Shoulders (H&S) and it remains to be seen if it establishes itself on the immediate price action, which technically means a sharp decline, as in theory it is a bearish pattern.
On the short-term, you can buy up to the Lower Highs trend-line and target 2.750. On the long-term we believe the upside is limited by the 1D MA200 (orange trend-line), which is now on Resistance 2 (3.025) and most likely will reject any spike on Resistance 1 (2.865).
So on the long-term, if the price breaks and closes a 1D candle below the 1D MA100 and Higher Lows trend-line, we will open a long-term sell and target 1.950 (Support 3).
-------------------------------------------------------------------------------
** Please LIKE 👍, FOLLOW ✅, SHARE 🙌 and COMMENT ✍ if you enjoy this idea! Also share your ideas and charts in the comments section below! **
-------------------------------------------------------------------------------
💸💸💸💸💸💸
👇 👇 👇 👇 👇 👇
Natural Gas Gold Silver DXY Price forecastsupport & Resistance guide Natural Gas Gold Silver DXY Price forecast

NG1! Buyers In Panic! SELL!
My dear subscribers,
NG1! looks like it will make a good move, and here are the details:
The market is trading on 2.605 pivot level.
Bias - Bearish
Technical Indicators: Both Super Trend & Pivot HL indicate a highly probable Bearish continuation.
Target - 2.495
About Used Indicators:
The average true range ATR plays an important role in 'Supertrend' as the indicator uses ATR to calculate its value. The ATR indicator signals the degree of price volatility.
———————————
WISH YOU ALL LUCK

natural gas dxy gold and silver forecastsupport and resistance natural gas dxy gold and silver forecast

NG1! BEARS WILL DOMINATE THE MARKET|SHORT
Hello,Friends!
We are targeting the 2.478 level area with our short trade on NG1! which is based on the fact that the pair is overbought on the BB band scale and is also approaching a resistance line above thus going us a good entry option.
✅LIKE AND COMMENT MY IDEAS✅

Natural Gas Gold Silver US dollar ForecastSupport and resistance guide of Natural Gas Gold Silver US dollar Forecast

NATURAL GAS: Trade above or below these levels.Natural Gas is basically neutral on the 1D timeframe (RSI = 47.497, MACD = -0.005, ADX = 30.454) supported by the S1 Zone (holding since June 21st) and restrained below the LH trendline. The 1D RSI is inside a Rectangle, which since May 4th has given excellent sell entries on its top and buy entries on its bottom. You may trade according to that but we will take a breakout approach and sell if the price breaks under the S1 Zone on the first rebound and target S2 (TP = 2.210) or above the LH trendline and target the 1D MA200 (TP = 2.900).
## If you like our free content follow our profile to get more daily ideas. ##
## Comments and likes are greatly appreciated. ##

NATGAS Potential Long! Buy!
Hello,Traders!
NATGAS is falling down
Again to retest the same
Horizontal support of 2.439$
So after the retest the price
Is likely to make a bullish rebound
Buy!
Like, comment and subscribe to help us grow!
Check out other forecasts below too!

Natural Gas DXY Gold Silver Forecastsupport and resistance guide Natural Gas DXY Gold Silver Forecast
and price action analysis

natural gas DXY gold silver forecast Natural Gas Natgas Stock in daily neutral trend
- Natural Gas Natgas needs a daily trend change to uptrend
- Next level for natural gas needs break hold 2.54

The Lengthy Wave 4 BeginsWe don't usually advise trading wave 4's as they can get overly complicated, however upon waiting for what should be the minute wave B we are advising our clients to go long as there is an off chance the minute wave C could be a minor wave 3 if the bottom is in. This is not our primary count though and we believe there is one more intermediate wave down to complete the primary wave C. Going long in our green box around $2.4 should provide us with at least 800 points of movement to $3.2 to complete the minor wave A. As always when trading natural gas you have to be prepared for extreme volatility and manipulation so be sensible with your position sizing.
Here's a closer look at the recent price action -

What do I mean when I use the word GAPS9.4.23 I know that my use of the word gaps Is a typical And that I am looking for something that's complicated than a simple one bar gap. I know that it has to do with my way of looking at the market to define Buyers and sellers. Buyers are at the bottom trying to push the market higher and sellers are at the top trying to push the market lower... and I am looking for how the market Comes back to retest either the buyers or the sellers depending on how the Market's moving. I view this as more than just one single bar that gaps. I even can call a gap one bar Moving higher or lower and there really Is not actually a gap per se.... it's probably more of a range and a continuation in a certain direction and I would think of that as part of the gap. there's probably a much better way to explain the behavior however from my point of view it's an effective way to determine how markets will auction higher and lower with me thinking about failures of markets to test gaps in either direction that gives me more reassurance on how I can come to a better trade decision. One way I define market behavior can take in the bullishness of a swing that is moving higher that would give me the sense that the market was going to continue higher versus A market that is Moving higher but isn't closing where the market gap lower from the Sellers that changes my perspective that the market may go lower If the current bar Starts moving lower before it can come back to touch the bearish gap that was made at an earlier time. The same is true if the Market's moving lower towards the buyers.
What's going on Is that I have a feel for the market as I think it will move and how that will look as I think about buyers versus sellers. And the same thing happens when I use the terminology to bar reversal. this is why I try to show numerous examples in real time as much as possible.If I were younger I would probably have a better way of articulating what I see.

NG1! BEARS WILL DOMINATE THE MARKET|SHORT
Hello,Friends!
It makes sense for us to go short on NG1! right now from the resistance line above with the target of 2.448 because of the confluence of the two strong factors which are the general downtrend on the previous 1W candle and the overbought situation on the lower TF determined by it’s proximity to the upper BB band.
✅LIKE AND COMMENT MY IDEAS✅
