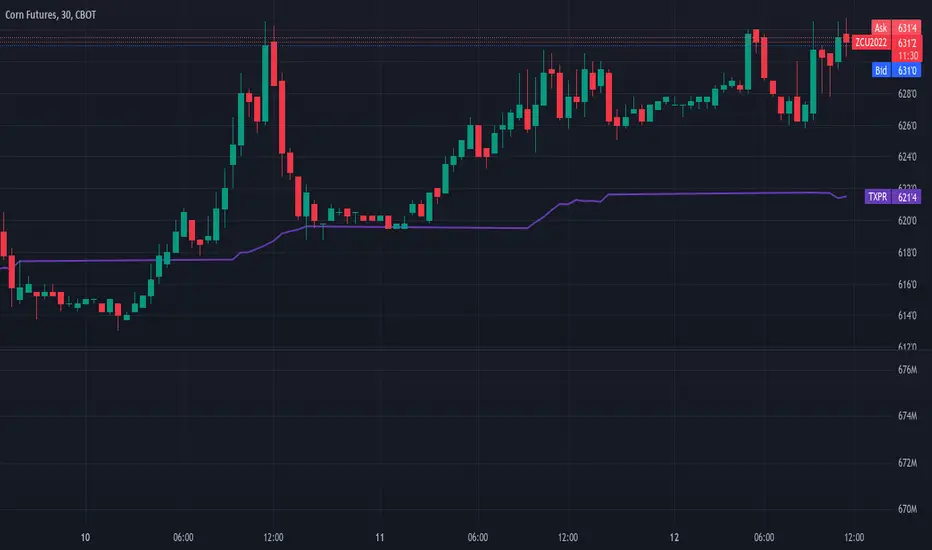
CORN - SHORTHead and shoulders not withstanding nor the break of the LT trend, this is a nice rally to take a stab at a short in the current commodity deflation we are experiencing.
No real wave pattern yet even lower time frames but given the macro and the price, volume, volatility calculated daily range near its top end, that confluence or an emerging pattern is believed (by me) will come soon. And its at a (random line, not really part of a strategy) that some may identify as an area to sell as well
TGCN1! trade ideas

Corn FUTURES (ZC1!), H4 Potential for Bearish DropType : Bearish Drop
Resistance : 686'6
Pivot: 673'6
Support : 654'4
Preferred Case: On the H4, with there's a bearish divergence of price and MACD , and there's potential double top pattern, we have a bearish bias that price may drop from the pivot at 673'6, where the 61.8% fibonacci projection is to the take profit at 654'4, which is in line with the 23.6% fibonacci retracement and neckline of "double top" pattern.
Alternative scenario: Alternatively, price could rise to 1st resistance at 688'6 where the swing high is.
Fundamentals: No Major News

Corn FUTURES (ZC1!), H4 Potential for Bearish DropType : Bearish Drop
Resistance : 686'6
Pivot: 673'6
Support : 654'4
Preferred Case: On the H4, with there's a bearish divergence of price and MACD, and there's potential double top pattern, we have a bearish bias that price may drop from the pivot at 673'6, where the 61.8% fibonacci projection is to the take profit at 654'4, which is in line with the 23.6% fibonacci retracement and neckline of "double top" pattern.
Alternative scenario: Alternatively, price could rise to 1st resistance at 688'6 where the swing high is.
Fundamentals: No Major News

It's Corn! - Long and juicy for upsideCorn future is looking almost perfectly ripe for the picking.
Cup and Handle forming nicely and just waiting for the breakout.
RSI broke out of its downtrend bearish divergence and has bounced on the new support - showing more upside to come.
Then will be an easy long (buy) to hold.
Stop loss will be just under the Handle and the take profit will be 2X risk...
It's corn!

Corn Futures ZC1 - Spooling Like a TurboBecause virtually the whole world is suffering from massive drought this summer, many crops are in bad shape. This is true with the U.S. cotton crop and it's also true with the U.S. corn crop, which according to USDA reports, barely half of is in good or excellent condition as of last week.
This is significant because the U.S. is the largest global producer of both, and by a huge margin.
This gives good cause to believe that a pump is on the horizon, but when, and how easily will it arrive?
The good news is for latecomers is that it seems as if the Ukraine panic pump and dump from April+ bottomed out in July, based on recent price action. "The second mouse gets the cheese."
There's a big gap on corn and wheat remaining from the June doom candle, which should transpire as a range that gets eaten into as we head into later September and October.
Winter may very well be new all time highs, because the world and humanity is in a lot of trouble. The environment is not in good shape, but to understand what this really means, you have to throw away the leftist-socialist-establishment "carbon" narratives, because those things are not only distractions, but they exist as a Communist Party pretext to take away your Freedom of Movement.
But just look at the lack of water and functioning ecosystem and ask yourself how long the happy is going to remain in North America.
The situation in Europe is already very dangerous.
Regardless, with the way price action has traded this month, it seems likely that corn futures has a good shot of breaking July's high before the end of the month. But it also looks like it may not run in a straight line up and take care of that business on Monday or Tuesday.
If you get a retrace into the 597 range, it seems there's a functional trade. However, it's entirely possible that August fails to break July's high. But if you can get out over 640 all the same before the month closes, you'll have done pretty well.
As for the rest of that gap above, I don't think we see that until the next commodities supercycle starts, likely beginning to ramp in late September-October.
Today is like a turbocharger. They all take a bit to spool. But once they do, it's really fun.
Unless you're the one standing in front of the Ferrari.

Corn Futures Continue to Slide LowerFundamental Spotlight
Flash Sale Alert
Private exporters reported sales of 167,000 metric tons of soybeans for delivery to China during the 2022/2023 marketing year.
(More) Lower Yield Estimates
Commodity Consultant, Dr. Michael Cordonnier released his yield estimate for the U.S. corn crop. He dropped his estimate 3 bushels per acre, to 170 bpa. As mentioned, several times over the last week+, we feel the market has digested the lower yields and believe the market is likely trading closer to a 170-172 yield, below the most recent USDA estimate of 175.4.
Taiwan Strait
U.S. military vessels and aircraft have returned to the Taiwan Strait as tensions escalate. It's being reported that Taiwan fired shots at a done belonging to mainland China. We don't believe that this conflict will go away anytime soon. If the tensions rise to the point of U.S. intervention, it would likely be extremely bearish for grain futures.
Outside Markets
Outside markets were sharply lower yesterday with indices down to their lowest level since the end of July. Crude oil futures were sharply lower yesterday, erasing all the gains and then some from the previous session. That weakness has spilled into today's session, with October futures currently trading down another 3% and below the psychologically significant $90 handle.
December corn futures are lower to start the day, filling the gap left from Sunday night. If the Bulls fail to defend this pocket, we could see prices pullback towards the low end of the back half of last week's range, near 650. We discussed our near-term outlook in yesterday afternoon's Tech Talk: Watch Now!
Bias: Bearish/Neutral
Previous Session Bias: Bearish/Neutral
Resistance: 682-685****, 700**, 725 3/4-728 1/4****
Pivot: 665-667
Support: 647 1/4-650 1/4****, 624-631***, 606 3/4**, 584 1/4-587 1/2****
Futures trading involves substantial risk of loss and may not be suitable for all investors. Trading advice is based on information taken from trade and statistical services and other sources Blue Line Futures, LLC believes are reliable. We do not guarantee that such information is accurate or complete and it should not be relied upon as such. Trading advice reflects our good faith judgment at a specific time and is subject to change without notice. There is no guarantee that the advice we give will result in profitable trades. All trading decisions will be made by the account holder. Past performance is not necessarily indicative of future results.

forecasting CORN FUTURES ZC in 240 min Hello to all investors, according to my previous studies and according to my experience as a trader, I see a good investment opportunity with a high probability of success, the details are reflected in the graph

forecasting CORN ZC in 1H Hello to all investors, according to my previous studies and according to my experience as a trader, I see a good investment opportunity with a high probability of success, the details are reflected in the graph

Corn Shortage! Blah Blah BlahThis week has brought about news on the projected corn yields dropping marginally, which in turn, is pushing this beast into higher territory. As we check out the chart we can see we have a significant golden pocket that will act as the Berlin Wall for corn. Prices below the golden pocket will act as East Berlin, controlled by the soviets during the Cold War. Trapped in a descending trend. If corn manages to push past the golden pocket + trend line resistance, corn will now be on the west side of the Berlin Wall. Free to explode into the June highs of $7.5.
In this analogy, I personally think that the soviets will maintain control and rule over corn until harvest is over. Corn harvest has started in the south and will continue into Nov. As we harvest we will have more corn in the bins and ready to use. Which will lead to lower prices IMO. Simple supply and demand.
Based off of the chart technicals, I am even more confident in saying that corn will be rejected because of where the GP and trend resistance lays. Once price reaches those levels I am expecting to see a bearish divergence on all three oscillators, and then I will go short big time. This could be a multi-month trade. But as always take profits on your way at key targets.
Major short target: $5.70-$5.30

zc down !according to my analysis, Corn future makes a squeeze after a bullish trend. It can decline towards the 646'6 level

corn (edible) zc1! | gap fillnice div loooking to confirm on 3d. tapped oversold. huge gap above.
think this could run up.

Chinese Data Sends Grain Markets LowerFundamental Snapshot
China
Weaker than expected growth in China was reported overnight, with real estate leading the way to the downside. The weaker than expected data prompted their Central Bank to announce a surprise interest rate cut. We are seeing the slower growth data have ripple effects in commodities this morning with oil down over 5% and soybeans down over 3%, just to name a few.
U.S. Dollar
The US Dollar is firming on the back of poor Chinese data, continuing the relief rally from Friday. The U.S. dollar was able to defend 105, which was previous resistance in May and June and the eventual breakout point in July. If the dollar continues to rally, it could be a headwind to some commodities.
Weather
Weater throughout the Midwest looks cooler and wetter for the next 1-2 weeks. For some problem areas, it may be too little too late. The conversation around weather will be shifting to South America in the coming weeks as they begin planting.
Corn
December corn futures "broke out" above resistance on Friday which took prices to the 50-day moving average and our next resistance, 640 1/2. Futures are weaker this morning, giving back all of the gains from Friday and then some. This takes prices back to trendline support. A failure to defend this area could open the door for a retest of the psychologically significant $6.00 handle.
Bias: Neutral
Previous Session Bias: Neutral
Resistance: 638-643**, 650-655***
Pivot: 620
Support: 584 ¼-587 ½***, 561 ¾**, 542 ¼-547 ¾***
Futures trading involves substantial risk of loss and may not be suitable for all investors. Trading advice is based on information taken from trade and statistical services and other sources Blue Line Futures, LLC believes are reliable. We do not guarantee that such information is accurate or complete and it should not be relied upon as such. Trading advice reflects our good faith judgment at a specific time and is subject to change without notice. There is no guarantee that the advice we give will result in profitable trades. All trading decisions will be made by the account holder. Past performance is not necessarily indicative of future results.

US Corn Commodity USA Sun Storm Investment Trading Desk & NexGen Wealth Management Service Present's: SSITD & NexGen Portfolio of the Week Series
Focus: Worldwide
By Sun Storm Investment Research & NexGen Wealth Management Service
A Profit & Solutions Strategy & Research
Trading | Investment | Stocks | ETF | Mutual Funds | Crypto | Bonds | Options | Dividend | Futures |
USA | Canada | UK | Germany | France | Italy | Rest of Europe | Mexico | India
Disclaimer: Sun Storm Investment and NexGen are not registered financial advisors, so please do your own research before trading & investing anything. This is information is for only research purposes not for actual trading & investing decision.
#debadipb #profitsolutions
Corn Gains Ground Ahead of Tomorrow's WASSDE Report
Fundamental Snapshot
WASDE Estimates
Reuters has complied estimates for Friday’s WASDE report. The average analyst estimate for corn yield is 175.9, with production at 14.392. The average estimate for soybean yield is 51.1, with production at 4.481. Over the years, the August report has been known to offer big surprises to the market.
Weekly Export Sales
Corn: Net sales of 191,800 MT for 2021/2022 were up noticeably from the previous week and from the prior 4-week average. Net sales of 191,300 MT for 2022/2023 were reported.
Soybeans: Net sales reductions of 66,700 MT for 2021/2022. Net sales of 477,200 MT for 2022/2023.
Wheat: Net sales of 359,200 metric tons (MT) for 2022/2023 were up 44 percent from the previous week, but down 34 percent from the prior 4-week average.
Corn
December corn futures have been testing the upper end of the recent range for the past 2 ½ sessions, that comes in near 625-630. This pocket also contains the 200-day moving average. If the Bulls rea able to chew through this pocket we could see an extension towards 650, which is both psychologically significant and technically significant. A move out above there could spark a bigger directional move, until then we continue to believe there will be plenty of short-term opportunities for participants on both sides of the market.
Bias: Neutral
Previous Session Bias: Neutral
Resistance: 625-630***, 640 ½**, 650-655***
Pivot: 600
Support: 584 ¼-587 ½***, 561 ¾**, 542 ¼-547 ¾***
Futures trading involves substantial risk of loss and may not be suitable for all investors. Trading advice is based on information taken from trade and statistical services and other sources Blue Line Futures, LLC believes are reliable. We do not guarantee that such information is accurate or complete and it should not be relied upon as such. Trading advice reflects our good faith judgment at a specific time and is subject to change without notice. There is no guarantee that the advice we give will result in profitable trades. All trading decisions will be made by the account holder. Past performance is not necessarily indicative of future results.

Corn Futures A small update on the corn futures possible breakout of a channel. We have even more confirmation of a channel now, with a total of 6 obvious points, 3 on each side of channel. The breakout of the channel should result in a big movement, I personally believe, it will be a shortside trade, however, we must wait for confirmation before making any major decisions.

Corn Corn Corn 🌽🌽🌽This is my plan for corn. It is being orientated mainly on seasonality. That means:
I expect the price to drop a bit further or to go sideways during this summer.
According to seasonality, the low should occur around September.
Then the corn price should rise again according to typical seasonal patterns.
IF the FED keeps increasing the interest rates, the dollar's value will increase, and the price of corn shouldn't get so high.
IF the FED stops increasing the interest rates, the price of corn gets an inflation bonus on top.
I expect a food shortage to come up at the end of this year or next year, maybe because of the lack of fertilizer, infrastructural problems, or something else.

Corn Futures Channel Possible Breakout Possible breakout either side of the corn futures channel that I have created. As you can see there have been multiple touches on the channel on the upside and downside. Once the stock decides to breakout of the channel, there is possibility for either a long or short position of the stock. The target should be the a movement of half of the size of the channel either upwards or downwards depending on the breakout situation.

Is an Inverse Head and Shoulders Pattern Forming? Fundamental Snapshot
Crop Progress
Yesterday’s weekly crop progress report showed further declining crop conditions. Good/Excellent conditions for soybeans were down 1%, to 59%, which was in line with expectations. However, corn G/E ratings fell 3%, to 58%, 2% lower than expectations.
Private Estimates
DTN released their yield estimates for corn and soybeans yesterday afternoon, and boy were they bullish. They have the national average corn yield at 167.2 bushels per acre, well below the USADA’s July estimate of 177. We have been assuming the market has been trading 174-175. DTN’s estimate for soybean yield comes in at 48.9, well below the USDA’s 51.5. As with corn, we’ve been assuming the market is trading closer to 50bpa.
WASDE Estimates
Reuters has complied estimates for Friday’s WASDE report. The average analyst estimate for corn yield is 175.9, with production at 14.392. The average estimate for soybean yield is 51.1, with production at 4.481.
Corn (September): September corn futures got some friendly news yesterday afternoon which helped propel prices back to technical resistance. The last few times we have been up at this level we moved our bias back into bearish territory, but with a potential inverse head and shoulders pattern forming and a WASDE report looming, we are keeping our bias Neutral. A breakout and close above 628-632 could open the door for an extension towards 650.
Bias: Neutral
Previous Session Bias: Neutral
Resistance: 628-632***, 645-652 ½***
Pivot: 600
Support: 580 ¾-586 ¼****, 561 ¼**, 542 ¼-547 ¾***
Futures trading involves substantial risk of loss and may not be suitable for all investors. Trading advice is based on information taken from trade and statistical services and other sources Blue Line Futures, LLC believes are reliable. We do not guarantee that such information is accurate or complete and it should not be relied upon as such. Trading advice reflects our good faith judgment at a specific time and is subject to change without notice. There is no guarantee that the advice we give will result in profitable trades. All trading decisions will be made by the account holder. Past performance is not necessarily indicative of future results.

Corn Developing Running Triangle for Intermediate Wave 4It appears that corn is developing a running triangle for intermediate wave 4. Corn should eventually break out to the downside and reach the target of 521'0, the 0.618 Fibonacci level.

Corn Fills the Gap (partially) Fundamental Snapshot
Weekly Export Sales
Corn: Net sales of 57,900 MT for 2021/2022 were down 62 percent from the previous week, but up 31 percent from the prior 4-week average. Net sales of 256,700 MT were reported for 2022/2023.
Soybeans: Net sales reductions of 11,000 MT for 2021/2022 were down 81 percent from the previous week and 90 percent from the prior 4-week average. Net sales of 410,600 MT were reported for 2022/2023.
Wheat: Net sales of 249,900 metric tons (MT) for 2022/2023 were down 39 percent from the previous week and 55 percent from the prior 4-week average.
Ukraine Production
Ukraine’s Prime Minister said on Wednesday that their harvest could be in the ballpark of 65-67 million tonnes. This would be a decline of roughly 20% from the previous year, which all things considered doesn’t sound too bad.
Ukraine Exports
There are 17 more vessels ready to leave ports in Ukraine, but there has not been a timeline established for departures. Those involved with the export deal have noted that it may take a few weeks for things to start picking up.
Technical Landscape
Corn
Technicals (September): Corn futures worked into the gap yesterday, which we used as our 4-star support pocket, 580 ¾-586 ¼. Though the gap was not all the way filled, the price action was friendly enough to move our short-term bias back into bullish territory. A break and close below that support pocket would likely move our bias back into bearish territory as it could take us back to the July 22nd low, 561 ¼. Upside objectives for the Bulls; 6.00. If the market can achieve consecutive closes back above $6.00 we could see a retest of our first resistance pocket, 624-630.
Bias: Bullish/Neutral
Previous Session Bias: Bearish/Neutral
Resistance: 624-630***, 645-652 ½***
Pivot: 600
Support: 580 ¾-586 ¼****, 561 ¼**, 542 ¼-547 ¾***
Futures trading involves substantial risk of loss and may not be suitable for all investors. Trading advice is based on information taken from trade and statistical services and other sources Blue Line Futures, LLC believes are reliable. We do not guarantee that such information is accurate or complete and it should not be relied upon as such. Trading advice reflects our good faith judgment at a specific time and is subject to change without notice. There is no guarantee that the advice we give will result in profitable trades. All trading decisions will be made by the account holder. Past performance is not necessarily indicative of future results.

ZC / Corn futures ZC / CORN FUTURES
About FUNDAMENTAL ANALYSIS.
---We are now in the corn-demand zone and there are many factors supporting the buying.
1-The Ukrainian war.
2- - dehydration.
3-The rise in the price of oil will lead to a rise in the price of transportation.
About TECHNICAL ANALYSIS
--- we look at (" Sell VOLUME ") and ("Sell pressure") is in decreasing , Volume drives all markets.
About Psycho-
--- The short sellers start to take their money from CORN market because of a psycho- demand zone.


Corn Futures Firm Corn
Technicals (September): September corn futures didn’t see much follow-through early in the overnight session but are firming up this morning, taking out yesterday’s highs. Previous resistance is now support, that comes in from 586-589. If the Bulls can continue to defend this pocket, we could see an extension of the relief rally take us to the 624-630 area. This pocket represents many previously important price points as well as the 200-day moving average.
Bias: Bullish/Neutral
Previous Session Bias: Bullish/Neutral
Resistance: 624-630***, 645-652 ½***
Pivot: 586-589
Support: 574 ¼-579 ¼**, 542 ¼-547 ¾***
Futures trading involves substantial risk of loss and may not be suitable for all investors. Trading advice is based on information taken from trade and statistical services and other sources Blue Line Futures, LLC believes are reliable. We do not guarantee that such information is accurate or complete and it should not be relied upon as such. Trading advice reflects our good faith judgment at a specific time and is subject to change without notice. There is no guarantee that the advice we give will result in profitable trades. All trading decisions will be made by the account holder. Past performance is not necessarily indicative of future results.
