TGCN1! trade ideas
Corn bottomed?Corn bounced right off the range I mentioned on my last idea, Aggressive traders might go long here but it's probably best to wait for MACD signal and further strength. Seasonally corn is Not bullish at this time of the year, so it's best to be careful with longs
**If you're interested in joining a group of like-minded traders, send me a PM. This is NOT a subscription service, just bunch of average traders sharing insights in a FREE group


Looking for a tradeable low in Corntarget for short corn idea that I posted was hit, now I’m looking for a tradeable low, more downside is likely but it’s probably better to stay flat and let the market figure out from where to bounce and then get on the trend.
If 400 doesn’t hold, a low might form in the 380-391 region
** Just an idea NOT a forecast

Corn likely to sell off next weekWith commercials holding record high shorts in corn, we might see a sell off next week to 412 support. if it doesnt hold there, it could go to 404-400
** Just an idea NOT a forecast

corn trading analysisthis is an idea based on fundamental and technical analysis, we are at a potential buy setup as the fundamentals(the report referred) suggest a minor supply and bad planting timing of the crop.
it has to be remarked to read the comment of the acreage report at the end of the document and understand how the crop grows.
if focused only on the first page of the acreage report (acreage of corn +3%) you can see that at the date the market receipted as a major supply(a sharp drop of price) but it did not account for the very late planting time and it can affect the developing of the crop.
all the important reports:
USDA acreage acrg0619 pdf (28/06/2019)
USDA crop progress prog2919 pdf (15/07/2019)
(search by your self)
the setup is a buy if do not drop significantly below the parallel channel and watch the further development of the crop to maximize the profits in the closing of the positions.
the latest report of the USDA indicate an improvement of the growing stage of the corn, but it is still significantly below compared year on year, also the crop quality has this deficit.


Corn B3 - Second chanceCorn B3
Enter = open candle day when MME15 crossunder MME60
and Price at ~36.00
Stop = 36.90
Target = to infinity and beyond
or 32.40
or 4 DAYS- close 4th candle day.

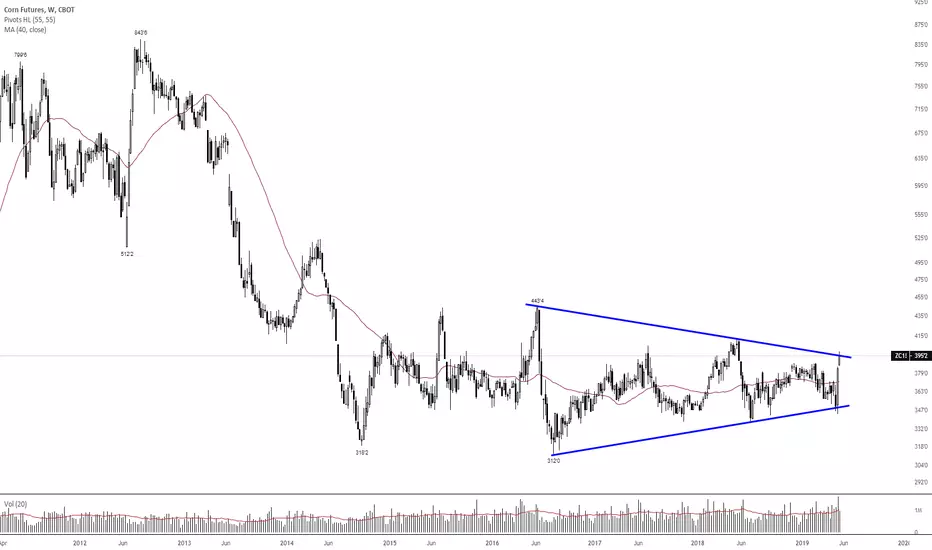
Corn sell signalsCorn, weekly chart: 4 years long resistance zone + "Evening Star" candles pattern + Divergence on RSI(14) + "Shooting Star"/Pin bar candle pattern on monthly chart.

CORN has reached exhaustion (for now)Yellow line is entry;
Stop loss is the red line;
Take profit are the green lines;

Corn B3Corn B3
Enter = open candle day - 02/07/2019
Stop = 37.50
Target = to infinity and beyond
or
05/07/2019 - clande day.


ZC1 en graf HORA Estamos ante la baja de la onda 2 que puede llegar hasta los 433/440 pts ahi se apoya en un baderin, la onda 3 estaria por salir dentro de un par de dias.

Corn Weather Market Losing Steam?
In the ZCZ2019 chart, I see the potential for another leg up however I believe it could retreat down to test the current support line. On 4/30 I bought corn around $3.80 feeling the low had been put in, after a few discomforting days I was correct. Due to delayed plantings and not optimal weather looking forward the market exploded up. I exited this position around the $4.40 range and enjoyed the nice profit, skeptical the market could not bust through the $4.54 price level.
Now that the market has broken through that level of $4.54 I am not adding to a Spec long position, while there is certainly upside potential left, I feel the market will struggle in the coming days and weeks to continue the great run it has displayed over the past weeks. That does not mean I am ready to initiate a short position, I feel the upside potential of 8.5% to the upside is still greater than a potential selloff.
I will be keeping a close eye on the market in the coming days and weeks if we do continue to rise an additional 8.5% and reach $5.00 +/- I will be preparing to enter the market as a bear. I do not forsee a freefall taking place but do see the potential for significant price reductions if we reach these levels. For the time being, I remain patient, sitting on my hands.
**Educational purposes only**

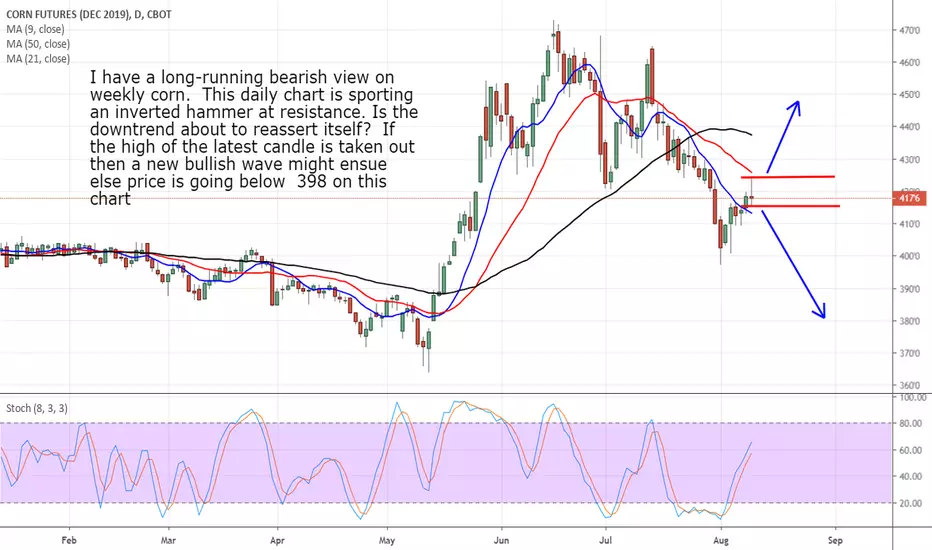
ZC1! - What to expect on the 4hr - CORN FUTURESSo check my last chart to see where I told you what needed to happen to get here. Spoiler alert. I was spot on. Now we have a fresh high and fresh failed to gain. Not a bad place to get short with tight stop just above previous highs. BUT TO TRULY KNOW IF THIS IS THE TOP... you have to lose the high. Look for a close below the last leg that took you up and then get short on the pull back to test that previous local high. This could be the last pullback before the drop, if there are no closes above the top green line. But typically there is a significant pull back after it close below the last leg up and thats usually where I get in on trend reversal signals.


Corn***Red bullIt has broken out the range, there's a potential IHS pattern.
Buy after pull back in lower fime frame


Delayed planting progress is launching a bull market in CornA massive H&S bottom is unfolding in the Corn market due delayed plantings in the major Corn growing states. Corn has already completed a very rare V-extended bottom, accompanied by a series of potential breakaway gaps.


Corn, the Weather Drives the RallyFollowing the disappointment of the failed talks between the United States and China about two weeks ago, grains, particularly corn and soybeans, have fallen. The corn price dropped to a new low of the year (Monday, May 13). Since that time, the corn has started a steep rise due to the known meteorological problems.
If we take the chart of the futures contract delivery July, we can see how strong has been the rise over the last seven days, and that has led the price to break the trendline resistance of the bearish channel, within which corn was moving from July 2018.
When these situations happen, when an external factor (in this case the climate, the heavy rains) influences so strongly the price of a commodity, the best thing to do is to wait for the effect ends, and for the price to start a "return" towards a normal value.
Yes, because if we exclude the weather, the situation for corn (and all other grains) is not improved, on the contrary...
This rally of the price is a real breath of fresh air for American corn farmers. The collapse of the price has brought to their knees many of them. The trade disputes have already caused a $6.3 billion loss to corn farmers in 2018, and 2019 could be even worse.
It does not mean the rally has to stop right here. The forecast promises more rain the next ten days, and that will give new fuel to the strong bullish phase, but do keep in mind that the rallies, particularly short-covering rallies, can end just as abruptly as they began.
So, I repeat, we have to be patient, wait for the climate effect ends, and only then will we be able to open bearish positions, taking advantage of a return of the price to a value more consistent with the moment we are living.
A fundamental rule in trading is to never anticipate market entry. Remember that it is always better to take a small part of a big movement, rather than a large part of a little movement.
So never be impatient to click on buy or sell.
