SOJA BEANS ! I RECOMMEND YOU BEARISH MOVEMENT! Hey traders, please support my idea with LIKE or comment if you agree!
GOOD LUCK!
TGSB1! trade ideas


Week 37: ZSX 20202 is getting close to our Sell LimitThe bullish week for ZSX 2020 will come to an end, the price is approaching the Supply Zone soon.
If you are following the LONG position last week, this week is time to exit from your trade and switch to sell.
Despite until today there is still no sign of slowing down, but historically $975 will hold its level.
And here is my personal trade opinion on ZSX 2020 (Same as last week):
Sell Limit at $975
Stop Loss at $985
Take Profit at $960
Risk Reward Ratio = 1.4R
Disclaimer :
The analysis above for educational purposes only, I do not responsible for your losses. Please adjust your own lot-sizing according to your appetite.
If you are benefiting from my trade opinion, please buy me coffee.
As always, move your SL when you are in the profit zone.


Soybean and Wyckoff AnalysisBullish Wyckoff Analysis.
Background:
After a series of Sell Down in Soybean, we finally see a accumulation and breakout of the chart signal that probably telling us the sell off is over.
The composite man has probably done their accumulation phase and now is the time to bring the real rally out from water.
We see Gold and Silver flying to sky, and why not the commodities now with the fact of Falling Dollar ?
In all the 3x Previous rally
are followed with relatively Higher
Volume. Each Pull back forming
a Higher Low and
showing a Up trend
line is FORMED.
Wyckoff Analysis Events
PS Preliminary Support
SC Selling Climax
AR Automatic Rally
ST Secondary Test
Spring Test
SOS Sign of Strength
LPS Last Point Of Support
BU Back-Up (Small Pull Back After SOS)
Entry : 890-900 (Range)
Target : 980 in Nov (Before the ZSX2020 Contract Expired)
Stop : 860
From Source
www.wyckoffanalytics.com
I am not affiliate of wyckoffanalytics.com and just a follower of Wyckoff Method. Thank.
Like my Idea, Follow me and Click the Like button.


Soybean Trying to Break OutChina Behind on Imports
Dryness threatening new crops hurting supply
Worthy Gamble

soybean bullish trends & seasonal tendancies bullishnessThe seasonal tendancies coming...
We're a the resistance level where we wait for the retracement at 910
Before the market continues bullish
- first target at 1000 THEN see the price structure for next leg

According to my experience. I expect a rise. Short term dealbuy order
I am not using take profit. And stop loss
If you want to exit the deal. right on time. you can contact me.
I welcome everyone

Week 36: ZSX 20202 let's do the counter trend!Bullish week for ZSX 2020, the resistance level was breached and no sign of slowing down.
When everyone is having bullish reading, it is a good opportunity for us to Short.
I would split my call today into two sections:
If you are a scalper and speculator, now or today is a good time for you to LONG ZSX 2020.
Not much upside, but you can do a "quicky" as follows:
Buy at market which is now around $964.50
Take Profit at $975 area
Stop Loss at $960
And here is my calculated trade opinion on ZSX 2020:
Sell Limit at $975
Stop Loss at $985
Take Profit at $960
Risk Reward Ratio = 1.4R
Disclaimer :
The analysis above for educational purposes only, I do not responsible for your losses. Please adjust your own lot sizing according to your appetite.
If you are benefiting from my trade opinion, please buy me coffee .
As always, move your SL when you are in the profit zone.

According to my experience. I expect a dropsell order
I am not using take profit. And stop loss
If you want to exit the deal. right on time. you can call me.
I welcome everyone

Week 35: ZSX 2020 Bullish FlagLast week ZSX 2020 had hit our target profit at $918 and immediately retraced to $902 level.
This week, the price action shows that now the price is still consolidating at $902 to $906 region; in addition, we also saw two potential entries to long.
In general, I am still Bullish bias this week, similar to last week, $902 hold an important significant Support.
My trade opinion on ZSX 2020 is as follow:
Buy Limit at $902
Buy Limit 2 at $893
Stop Loss at $892 ( yes, just $1 Stop Loss )
Take Profit at $918
Risk Reward Ratio = 1.67R
Disclaimer:
The analysis above for educational purposes only, I do not responsible for your losses. Please adjust your own lot sizing according to your appetite.
If you are benefiting from my trade opinion, please buy me coffee .
As always, move your SL when you are in the profit zone.

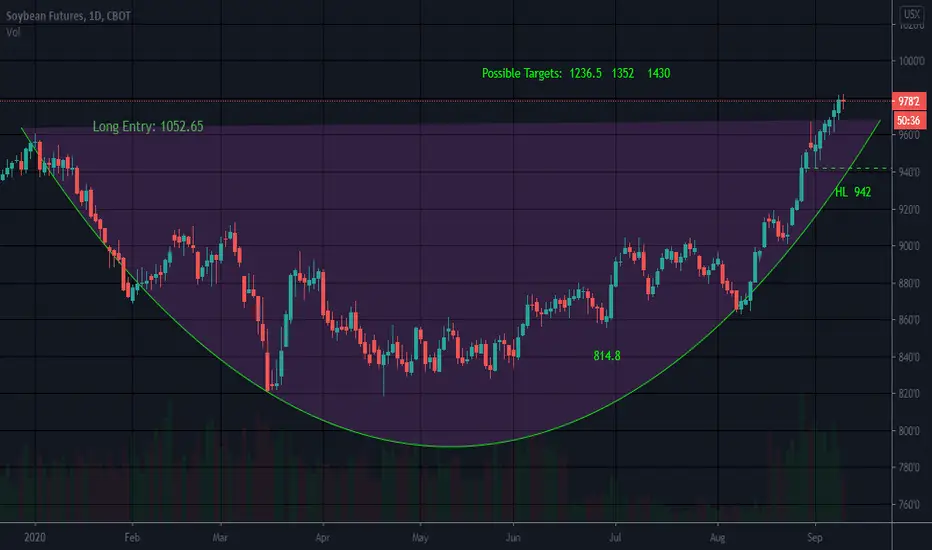
I like soybeans long , a long-term bottom might has been formed I like soybeans long .
Again im not a long-term position type of a guy , but this does look like it has bottomed in the long-term as well .
Short-term I think we can easily hit the 960 level , and based on some extensions I see it hitting the 1030 level within 1-2 months .
The massive trend line break since 2016 is pretty huge .
We had a false breakout in the past but this one I think is real .
We will see how it goes but right now just buying the 960 calls with nov expiration (50+days) its an easy 200% return minimum .


Week 34: ZSX 2020 Slight bullish sentimentCurrently the price is soaring up to the upper part of the zone and if we look to the left, we can expect the price to move sideways before collecting the Supply Zone.
Despite being bullish bias, I will not buy at market, instead, I prefer to buy at a better price (discounted price).
My trade opinion on ZSX 2020 is as follow:
Buy Limit at $902
Stop Loss at $893
Take Profit at $918
Risk Reward Ratio = 2.13R
Disclaimer :
The analysis above for educational purposes only, I do not responsible for your losses. Please adjust your own lot sizing according to your appetite.
If you are benefiting from my trade opinion, please buy me coffee .
As always, move your SL when you are in the profit zone.

Soybean export prices on the rise.Soybean export prices rose in July ‘20 averaging $364/ton an increase of $14 from June. Oilseed production is forecast at 610 million tons, up 6 million from July ‘20 due to an increase in soybean crop in the U.S. The U.S. Farming Department on Thursday said Chinese purchasers booked arrangements to purchase 197,000 tons of U.S. soybeans, the seventh weekday in succession that the administration has detailed a deal to the world's top purchaser of the oilseed.
In a different report, USDA said week by week send out deals of soybeans through Aug. 6 added up to 2.13 million tons, the most since November 2016. USDA helped its 2020/21 U.S. soybean send out gauge by 75 million bushels to 2.125 billion bushels in its month to month World Agriculture Supply and Demand Estimates report it delivered on Wednesday.
Soybeans futures rose 1% during this morning's European session recapturing the 9th July highs (908.9). Large and small speculators have significantly increased their bullish exposure to this soft commodity, while Smart Money Hedgers are heavily net short. Sloping trendline resistance zone (1) now joins with 61.8% fib retracement, taken from the January highs of this year and the lows of April, which could provide a good selling opportunity. Above resistance at (2) negates this downside view. Above 930s puts the Bulls firmly in control paving the way to 960s as a first target to watch for (Jan Highs)

SX20 Soybeans Nov LONG w/ large upsideSure, many people don't get excited about Soybeans when market volatility is moving, COVID is a story with vaccines introduced and Gold rocking the world of some...but, Grains like Corn, and Soybeans I believe are about to move North in a BIG way. Look at the chart going back for a couple of years and you will see a big bullish Gartley, 1/3/5 bottom pattern, and the newer bullish Gartley that are yielding positive results today with a break out candle.
Good trading everyone and be safe!
8/12/20 Jason Roose, U.S. Commodities, says that this August report is different than last year's.
“The difference is that the expectations for an increase in yield, production and carry out for corn and soybeans eliminated any shock this year, with increased yields for corn of 3.3 bushels and a 3.5 bushel soybean yield. Plus, production increases in both corn and soybeans left very little bullish surprises on this report. But, key to the numbers released today is how much of the premium is dialed in. With 2019 world ending stocks lower than expected for corn and soybeans, combined with the weaker dollar, that scenario could offset larger ending stocks," Roose says.

SOYBEAN IS TRYING TO MOVE AWAY FROM DOWNTREND - ZS1! - 30MNWe have observed several forces acting as a brake and pushing the price above the red down trending line. But a very strong squeeze front last tops have seen the market being inconsistent with its which to move upwards.
The two horizontal black lines are the new tops and bottoms of the horizontal trending range.
We could observe during this week a market which will try to break above by going directly to it or by finding first a a support point on the top of the red down trending line. The probability to see the market breaking above the black resistance line is less likely than seeing a pullback down again at that level. It could probably be a good sells entry point (possibily from Thursday). For the moment the last volume have shown signs of a force pushing up against sellers.
Keep an eyes on the $900 mark, still legit and try to trade it during the morning Asian session (Tokyo time from 9am30 to 12pm and opening of the Frankfurt & London 8am to 10am GMT0) as it is more stable and easy to read.

The ZS1 is showing some strong bearish down trendI see a strong movwe to the bottom since there is a strong volume confirming that. Also, it will be risky to go for long postions at least during this week.


Soybean - 2 possible entriesWe already talked about coming decline in Soybean and finally, we are close to an entry. Commercials are heavily short and evaluation index shows Soybean is overvalued. If on Monday, we break below Friday’s low to form a lower high, that’s our entry. Otherway, wait till trendline breaks.
