Crypto Total Market Cap (CRYPTOCAP:TOTAL) As of March 12, 2025, the Total Crypto Market Cap sits at 2.63T USD.
Let’s dive into the monthly chart for a technical breakdown:
Since 2016, price has been moving within a long-term ascending channel. Right now, we’re testing the lower trendline support zone (2.4T - 2.5T).
This level has historically acted as a strong base – both the 2017 and 2021 bull runs kicked off from similar support zones.
Volume profile shows a 15-20% increase over the past 3 months, indicating growing buyer interest and improving market liquidity.
RSI is at 40 (neutral zone), not yet in oversold territory but signaling a potential base for a recovery.
Bullish Scenario: If the 2.5T support holds, we could see a move toward the channel’s midline (3T - 3.5T range), potentially retesting the 2021 highs above 3T.
Bearish Risk: A break below 2.5T could lead to a deeper pullback toward 2T, so keep this level on your radar.
💡 My Take: I believe we’re either at the bottom or just a few weeks away from the start of a new uptrend. April could mark the beginning of a bull run, signaling the end of the bloodbath – at least based on the technicals of the Total Market Cap.
What’s your view? Will the 2.5T support hold, or are we in for another correction?
TOTAL trade ideas

$TOTAL big view🔥 Check out this incredible trendline!
📉 Since 2014, it has acted as an impenetrable wall, pushing the price back up every time.
🔄 Will this magic support hold once again?
❌ Or are we finally seeing a historic breakdown?
📊 Drop your thoughts!
#Bitcoin #Crypto #MarketAnalysis #Total

TOTAL Marketcap at important support?Upcoming period could be more positive?
Many cryptocurrency dominance charts, as well as Nasdaq and stock charts too, showing the same pattern. Is the reversal starting?
We’ll see.
This is not investment advice. Please do your own research.
Wishing you best.
-YusufDeli

MARKETS week ahead: March 10 – 16Last week in the news
The February US NFP data were below market expectations, however, the market sentiment is still highly under the influence of US trade tariffs. The US equity market had a correction during the previous week, with S&P 500 closing the week at the level of 5.770. The weakening of the US Dollar stopped further surge in the price of gold, but it still ended the week with a weekly gain, reaching the level of $2.909. The US Treasury yields reversed after reaching the lowest weekly level at 4,1%, ending the week at 4,30%. BTC is still in a roller coaster mood, testing the $90K, but still ending the week around the $86K.
The US Nonfarm payrolls data for February came a bit lower from the market forecast. The US economy added 151K new jobs, while the market was expecting to see a figure of around 170K. At the same time, the unemployment rate for February was modestly increased to the level of 4,1%, from 4,0% posted previously. Regardless of a weaker than expected jobs data in February, the major concern of investors continues to be trade tariffs of the US Administration toward the main trading partners, including Mexico, Canada, China and the European Union.
The trade war started by the US Administration is spilling its effects on other countries. As per latest news, China is planning to impose sanctions on some Canadian goods, including agriculture and oil products, from 100% to 25%, depending on the goods. Tariffs are scheduled to come into force on March 20th. At the same time, Canada imposed 100% tariffs on Chinese electric vehicles, which came into force in October last year.
“We do not need to be in a hurry, and are well positioned to wait for greater clarity” said Fed Chair Powell at a Policy forum during the previous week. This comment was made on the latest trade tariffs of the US Administration, noting that the combination of measures in the sphere of tariffs, immigration, fiscal policy and regulation will have a combined effect on the US economy.
During the previous week, the US President signed an executive order to establish a Strategic Bitcoin Reserve and a US Digital Asset Stockpile. The BTC market had only a mild reaction to this news.
UBS analysts are noting in their research that China might experience its own “GPT moment”. They noted that Chinese start-ups are rapidly innovating and integrating AI technology. The bank emphasized a product called Monica.ai Manus as a standout example of a program capable of doing many tasks including data analysis and coding.
Crypto market cap
The crypto market was following general sentiment on financial markets during the previous week. The correlation with the US equity market continues as the crypto market entered the mainstream. The US President signed the executive order establishing a Strategic Bitcoin Reserve, however, the market reaction was relatively mild. Total crypto market capitalization remained relatively flat during the previous week, regardless of a higher volatility within the week. Daily trading volumes were also relatively flat compared to the week before. Total crypto market increase from the beginning of this year, currently stands at -14%, with $460B outflow of funds.
BTC had a relatively volatile week, however, it managed to close the previous week relatively flat compared to the week before. ETH had a modest drop in the market cap of 2,2%, with an outflow of $ 6B in funds. Other major altcoins also had a relatively negative week. DOGE was traded down by 8,4%, decreasing its total market cap by $2B. Solana had also a modest drop of 2,3% w/w, decreasing its cap by $1,6B. BNB was down by 3%, with a decrease in the value of $1,6B. On the opposite side was ADA, who managed to end the week in positive territory, with a surge in value of 22% or $5,1B. Tron also had a good week, increasing its value by 13,6%, or $2,7B. Other altocins were traded in a mixed manner.
During the previous week Tron had an increase in the market value, but it also increased its coins in circulation by 10% on a weekly basis. This was one of the highest weekly increases for this coin. Stablecoin Tether is back on a positive territory, with an increase of circulating coins of 0,3% this week. Solana and IOTA also had an increase in the number of coins on the market by 0,3% each.
Crypto futures market
The general market sentiment impacted the crypto futures market to trade in a mixed manner during the previous week. Although BTCs spot market remained flat, still, its futures market gained above 3% for all maturities. In this sense, futures maturing in December this year closed the week at $93.550 and those maturing a year later were last traded at $101.800.
On the opposite side were ETH futures which closed the week around 3% lower from the week before. Futures maturing in December this year were last traded around 3,2% lower, at $2.298. At the same time, futures maturing in December 2026 were traded lower by 2,7%, closing the week at $2.470.

TOTAL Market Cap Timeline PredictionIf history repeats itself, the total market cap is likely to peak in September 2025.

(TOTAL) total crypto mcap "candles on record [history"worst red candles on record in the past four years and various progresses of positive growth measured from lowest in between points.

Crypto Total Market Cap ($TOTAL)Disclaimer: All the information and analysis serve only as educational purposes and hence should not be regarded as investment advice.
Here is my thought on the potential weekly price action of the crypto total market cap, $TOTAL.
Overall, the market structure still remains bullish by consistently creating higher highs and higher lows since 2023 - currently price is forming the higher low. Horizontal support and diagonal uptrend trendline are both still respected. Historically, an RSI around 43 indicate a market bottom - current RSI is 43.1. Also, starting 2023, the return in Q1 and Q4 have proven to be positive while Q2 and Q3 have shown the opposite.
However, the tariff announcement by the U.S. President Donald Trump to Canada, Mexico, and China in Q1 2025 have created market uncertainty and thus, leading to market pullback in this quarter. BTC and ETH Spot ETFs have experienced net outflow in February 2025 although the outflows are slowing down in the beginning of March 2025. The fear and greed index has also entered into the fear area.
On the other hand, the signing of the U.S. Bitcoin Strategic Reserve and the social media post of U.S. Crypto Strategic Reserve (BTC, ETH, XRP, ADA, SOL to be specific) by President Donald Trump suggest improved future adoption of crypto not only by institutions, but also nations. For this reason, I believe that as of the date of writing, the total crypto market cap chart ( CRYPTOCAP:TOTAL ) is reaching a local bottom of around $2.5T and will remain bullish for the rest of 2025 with a target of around $7.2T-$8.7T by the end of the year.
Invalidation: If the price action shows a weekly candle close below the diagonal trendline and the previous low of $1.69T, then the above analysis will be invalidated and the crypto market may enter turn into bearish.

Why the US strategic reserve is a bad thing for crypto.Another Controversial Opinion
Honestly, I’m frustrated with how this is unfolding. Crypto was never meant to be controlled by the USA—it was created as a humanitarian concept to empower individuals, offering a decentralized, anonymous, and universally accessible financial system.
But, as always, when there's money, resources, or anything valuable, the USA steps in to take control.
Take the music industry as an example—one of many sectors transformed (or destroyed) by the US.
Why Is the US Crypto Stockpile a Bad Thing?
Because it goes against Satoshi Nakamoto’s vision.
By aggressively accumulating and stockpiling Bitcoin, the US is making crypto less attractive to the rest of the world. People who assume every country will blindly follow the US are mistaken. What's beneficial for the US is not necessarily good for China, India, Pakistan, Indonesia, or any country competing against US financial dominance.
Unlike gold, which can be mined anywhere, the US stockpiling over 200,000 Bitcoin gives it a massive advantage. Other nations may reject crypto simply because they see it becoming a US-controlled asset.
The Political Weaponization of Crypto
Now, Trump is positioning himself as "The Crypto President"—which, while beneficial under his leadership, means that Democrats will inevitably become the anti-crypto party.
Turning crypto into a political weapon is dangerous in the long run. Is gold tied to a political party? No. So why should crypto be?
Conclusion
Crypto needed regulation, and that’s it.
The US obsession with controlling everything valuable often ends up destroying it.
Let’s not forget: crypto is nothing without its global communities—and where are most of these people? In countries that are actively resisting US financial dominance, primarily in the BRICS nations.
When Trump and his family rug-pulled $1 billion through Trump/Melania meme coins, that money didn’t just come from the US—it came mostly from foreign investors gambling on memes.
This is not what Satoshi Nakamoto envisioned when he released Bitcoin as open-source software for humanity.
The end result? The SPX500 dictates the market, Bitcoin follows, and altcoins mirror Bitcoin. Wall Street is now the puppet master of crypto.
If crypto follows the path of the music industry, billionaires will get richer, but ordinary people won’t. Altcoins will be wiped out, and Bitcoin will dominate everything.

MARKET LOSING $600B IN MARCH-APRIL 2025: WHAT WILL YOU DO?MARKET LOSING $600B IN MARCH-APRIL 2025: WHAT WILL YOU DO?
Hey everyone, it’s the beginning of March 2025 —the road ahead is bumpy, and the market is playing a crazy psychological game. You loaded up at $78K, thinking it was the perfect bottom, right? Your DCA bags are full, yet the market refuses to climb—worse, it's about to drop further.
In March-April the total market cap is set to shed another $500B, dropping from ~$2.85T to $2.35T—a prime buying zone. But here’s the issue: your funds might already be drained from “catching knives” earlier. When the market cap dips to $2.35T, how long it stays there before recovering depends on the W (wave bottom) and M (monthly cycle) timeframes—that’s the time factor.
Here’s my take:
Choosing price: Buying cheap is good, but it’s not enough.
Choosing timing: Enter at the right moment so your assets move up quickly—lock in profits fast without enduring more psychological pain.
If you only focus on getting the lowest price , you might end up holding bags with no gains—brutal. But if you time it right , you get both a good price and fast profits , avoiding the market's punishment.
So, with $500B about to vanish from total market cap , what’s your plan? Will you wait for the bottom or start accumulating now? 🚀

Zoomed out perspective of 2025 bull cycle.I don't think i need to say much...
*This is not financial advice. This is my attempt of practicing and learning about Elliot Waves. Please let me know how I can improve*

Crypto Total Market Cap Headed towards 5TTotal Crypto marketcap has sit the support zone around 2.6T and successfully bounced back from the support after forming two wicks on the weekly candle. This is a good sign that there is still bullish momentum left in the overall crypto market.
Currently the market-cap is around 2.9T and steadily increasing. I'm expecting the further growth in the overall market cap and to reach 5T in the next couple of months.
Follows us for more updates.
Cheers
GreenCrypto

Wyckoff Distribution 101Lots of uncertainty in the economy the past few years and lately. Just meant to show a possibility of what can happen. Good luck!

5 Billionaires Enter The Cryptocurrency MarketFive new billionaires are entering the Cryptocurrency market and bringing billions of dollars worth of capital in. These are not the same participants we are familiar with. These are in and still playing. I am talking about players that have never played before. Each participant will bring in capital in the tune of 2-3 billions. This can make a huge difference.
Just 1 billion USD can create a noticeable effect on the price and dynamics of Bitcoin and the Altcoins market. When you inject 10 to 15 billion of new capital, the results can be something palpable.
In the short-term, this is bigger than the Crypto Strategic Reserve because it affects the entire market and not only a few projects.
You have the chance to be in, ALL-IN, before this massive injection of force.
This is Master Ananda, and I am here for your entertainment and continued support.
Namaste.

TOTAL Crypto Market CapThe CRYPTOCAP:TOTAL Crypto Market Cap dipped below its 2021 highs once more.
Last week's candle held, but prices slid lower this week.
Watching the weekly close to sustain the high timeframe uptrend.

Crypto Total Market Capitalization💰
The chart reinforces a bullish outlook on the crypto market, showing a structure similar to CRYPTOCAP:BTC 📊.
🔹 Key Zone:
#TOTAL is retesting the Major Resistance Zone and so far, the retest looks positive ✅.
Support Confluence: EMA 50 + MA 50 + Supertrend—which previously marked market bottoms twice☝️.
🔹 Market Outlook:
If the bullish momentum continues, we might see some consolidation here before a strong rally📈.
🧐 Keep a close watch on this structure and Traditional Finance (TradFi) markets, as they could provide additional confirmation.

Total Market on the preATH supportThe TOTAL MARKET for crypto is on the previous ALL TIME HIGH , after broke above that in Oct-Nov 2024 now is back testing that, which is a very classic movement to continue to the upside in my opinion

Total crypto market capitalization is on the verge of total foul😱 The total capitalization of the crypto market is on the verge of a total foul...
From this blue trend line started both the growth of 2017 and the market rebounded in March 2020 after the covid panic.
In 2024 and 2025, this trend also served as the “last bastion” of defense
And now, Trump, with his manipulative and not very smart tweets and statements, has decided to “outplay everyone” here... everything is falling: the dollar index, the SP 500, the Dow Jones index, oil
Now the total capitalization of the crypto market is $2.7 trillion, and below $2.5 trillion 👉 2 👉 1.6
_____________________
Did you like our analysis? Leave a comment, like, and follow to get more

TOTAL CRYPTO MARKET CAP is back-testing the cup & handle patternIt's no mystery that the crypto market has been getting hit pretty hard since mid-December. However, the total market cap—which had previously broken out of a nice cup-and-handle pattern—is now backtesting the rim line and looks to be setting up for what could be an incredible move upward over the next 6 to 9 months, with the potential for a double within that timeframe.
Good luck, and always use a stop loss!

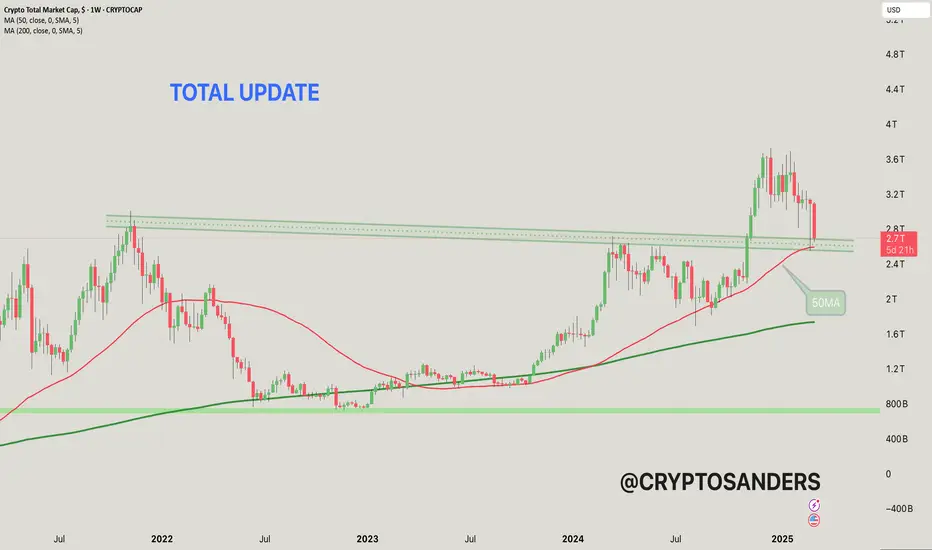
This chart shows the total cryptocurrency market capitalization,
The current value is around $2.271 trillion, which represents a significant drop of 12.51% from the recent peak.
50-MA (moving average): The red line represents the 50-week moving average, which is currently around $2.59 trillion. It acts as a short-term trend indicator and potential support level.
200-MA: The green line represents the 200-week moving average, which is around $1.73 trillion, which indicates a long-term trend and strong support level.
The horizontal green lines represent support levels around $2.4 trillion and $2.6 trillion. These levels are important for a potential bullish reversal if retested.
The dotted line above the price represents resistance levels near historical highs.
The recent decline suggests the market may be in a bearish trend after failing to break the resistance levels.
If the price is above the 50-MA, it could signal a reversal towards the resistance zones and a potential recovery. However, a break below the 50-MA could signal further decline. Keep an eye on the key levels around $2.4 trillion (support) and $2.6 trillion (resistance).
If you found this analysis helpful, hit the Like button and share your thoughts or questions in the comments below. Your feedback matters!
Thanks for your support!
DYOR. NFA
One more bullish wave after short retracementMarket is bullish in bigger trend but there will be a small retracement.
20 MA on the 4h chart will provide good support.

MARKETS week ahead: March 2 – 8Last week in the news
Markets continue to be in an uncertain mood, impacted by geopolitics, trade tariffs, inflation and interest rate levels. A major correction occurred during the previous week, where the majority of financial assets ended the week with a stronger weekly loss. The US equity markets finished the week in red, with S&P 500 losing 1,4% since the beginning of February, ending the month at the level of 5.954. Funds from equity markets fled toward the US Treasury bonds, where the 10Y US benchmark reached the 4,2% level. Although the US Dollar modestly gained in strength, still, the price of gold entered into a major short term correction, reaching the level of $2.856. As BTC is now part of the mainstream, a major break toward the downside occurred on the same grounds as with other financial assets. BTC shortly touched the $78K, but ended the week around the $85K resistance line.
The major macro data for the US released during the previous week was the PCE data for January, however, were left in a shadow of geopolitical developments. The Fed's favorite inflation gauge came with no significant surprises from market expectations. The PCE was increased by 0,3% in January, leading to yearly increase of 2,5%. The core PCE was also at the level of 0,3% for the month. The personal income was higher by 0,9% for the month and personal expenditures decreased by -0,2% in January, compared to the previous month. These figures were in line with market expectation, in which sense, there has not been much market movements on the release of data. However, the stronger impact came from geopolitics.
Recently the word “tariffs” became the spookiest word on financial markets. Although it is still unclear whether the US Administration will indeed introduce trade tariffs toward Canada, Mexico, China and Europe, markets are strongly reacting to any news related to this topic. During the previous week, Reuters published the news. Officials from Mexico proposed to introduce a 10% import tariffs on goods from China in order to match the US tariffs. At the same time, the US President noted that he might double current tariffs to China, which means a total of 20% tariffs on imported goods from China.
The Intel company was in the spotlight of the market during the previous year, when the company missed the opportunity to catch up with the increasing AI demand, causing its shares to suffer almost 60% loss in value. Since then the company is trying to correct the past mistake, with plans to open a chip manufacturing facility in Ohio. However, the latest news is showing a potential delay in construction, so that a $100 billion complex would most probably start operating in 2030.
Amid pre-election promises, the US President Donald Trump will host the first crypto roundtable at the White House on March 7th. As noted in the White House release, “attendees will include prominent founders, CEOs and investors from the crypto industry, as well as members of the President's Working Group on digital Assets”.
Crypto market cap
A major break toward the downside occurred during the previous week. Although, charts look painful with such a significant drop, still, for the crypto market historically it represents necessary consolidation for the future move toward the upside. These situations occur several times in the past, and will most certainly, occur also in the future period. The most important is that the crypto market managed to become part of mainstream markets, which was the historical win for the crypto market. However, it also means that the crypto market will react to any news which affects the traditional mainstream markets. This is exactly what happened during the previous week, where the total crypto market capitalization decreased by additional 12% on a weekly basis, erasing a total $370B from its market cap. Daily trading volumes also decreased to the level of $144B on a daily basis, from $239B traded a week before. Total crypto market increase from the beginning of this year, currently stands at -14%, with $450B outflow of funds.
During the previous week the majority of crypto coins lost in value, only a few managed to finish the week in green. BTCs value significantly dropped during the week, where the largest crypto coin lost over $216B in value, decreasing its market cap by 11,3%. For BTC, this represents a significant correction. ETH was also in the red group, with a loss of $ 68B or even 20,5% w/w, which is also a significant correction for this coin. Among market favourites, Solana dropped its market cap by almost $ 13B or 15,3%, BNB was down by $ 9B or 9,3%, DOGE lost more than $ 6B in value or 16,8% and XRP was down by 13% losing $19,7B in value of its market cap. At the same time, two coins which actually managed to post a significant increase in value were ZCash with an weekly increase in value of 10,6% and Maker who managed to add almost 8% to its value.
There has also been an increased development when coins in circulation are in question. In this sense, Solana had a weekly increase of 3,9% of new coins on the market. Filecoin continues to increase its circulating coins each week, adding this time 0,6% of new coins.
Crypto futures market
In line with the spot market developments, the crypto futures market also experienced some major correction during the previous week. Both BTC and ETH futures were traded significantly lower compared to the week before.
BTC futures ended the week above 11% lower for all maturities. There has also been some significant correction for longer term futures, which all dropped below the $100K target. In this sense, futures maturing in December this year closed the week at $90.650, and those maturing a year later were last traded at $98.695.
Similar situation was with ETH futures who ended the week by more than 15% lower, dropping below the $3K target for longer maturities. ETH futures maturing in December this year closed the week at $2.374, and those maturing in December 2026 were last traded at $2.540.

CRYPTO MARKET CAP UPDATEThe total market cap is testing key support at $2.75T at the trendline!
Hold = potential 169% rally to $6.95T
Breakdown = more downside risk
Will bulls step in?

The truth sometimes hurts.I was suprised, how perfectly CRYPTOCAP:TOTAL cap worked as indicator.
I commented good posts below with my POV. Please scroll to comments and find mine.
www.tradingview.com
www.tradingview.com
