Crypto Total Market Cap Consolidation: Imminent Breakout Ahead?Key Observations:
1. Symmetrical Triangle Pattern:
The price is consolidating inside a symmetrical triangle, with lower highs and higher lows.
A breakout in either direction is imminent.
2. Exponential Moving Average (EMA 200):
The 200-period EMA is at 3.26T, currently acting as resistance.
A breakout above this level could indicate a bullish trend continuation.
3. Relative Strength Index (RSI 14):
Current RSI: 49.34, slightly below the neutral 50 level.
This suggests neutral momentum, with no clear overbought/oversold signals.
A move above 55-60 could indicate increasing bullish momentum.
Potential Scenarios:
1. Bullish Breakout:
If TOTAL breaks above the triangle resistance and EMA 200, the next targets could be 3.3T - 3.5T.
Confirmation requires high volume and RSI above 55.
2. Bearish Breakdown:
A break below the triangle support could push TOTAL toward 3.0T or lower.
RSI dropping below 40 would confirm bearish momentum.
Conclusion:
The market is in a consolidation phase, awaiting a breakout. Watch for volume confirmation and EMA 200 reaction to determine the next move.
TOTAL trade ideas

MARKETS week ahead: February 17 – 23Last week in the news
Fed Chair Powell’s testimony in front of the US Congress, US inflation data in January and Retail Sales were the main topics which shaped the market sentiment during the previous week. The US Dollar lost some of its strength, but the price of Gold also eased by 1% at Friday's trading season, following the profit-taking. The positive sentiment on the US equity markets was back, where S&P 500 almost reached its all time highest level, ending the week at 6.114. The US Treasury yields reacted on January inflation data and significant drop in retail sales in January, bringing down the 10Y Treasury yields toward the 4,47%. Many concerns of investors put aside the crypto market, where since the beginning of February BTC continues to trade in a channel between the $ 98K and $95K.
At the beginning of the previous week markets were closely watching Fed Chair Powells testimony in front of the US congress. The key takeaways from a two days Congressional hearing include points that Fed is not in a hurry to cut interest rates and that the Fed's policy will not be impacted by the US Administration, alluding to a question regarding US President request for immediate cut of interest rates. Generally, there was no new significant information which was not previously communicated with the public. As for macro data during the previous week, the US January inflation data surprised markets with a 0,5% increase for the month, higher from forecasted 0,3%. The PPI also rose 0,4% in January, again higher from market estimate. Still, the retail sales of -0,9% improved market mood, with a figure much higher from market estimate of -0,1%. This was a signal that the current inflation level might not impact too much Fed's decisions over future course of interest rates.
During the previous week markets were talking about the final payout of the fallen crypto exchange FTX during the week ahead. This represents a part of FTX restructuring program, where first in line will be claims up to $50.000. Analysts are providing their assumption over its potential impact on crypto markets and specific tokens, however, there are also those who anticipate that this payout will not have a significant impact on the price of major crypto coins.
A lot of news covered the bid of Elon Musk for purchase of Open AI. He offered a figure of $97,4 billion for shares of Open AI in case that this company stays non-profitable. The latest news published by Reuters on Friday states that OpenAI rejected the bid from Elon Musk, noting that the company is not for sale and that any future bid will be also rejected.
Crypto market cap
After almost three consecutive weeks in red, the crypto market finally ended the week in green. However, it could be noted that the volatility with altcoins run at relatively higher levels during the past few weeks. At the same time, BTC remained volatile within the channel between levels of $ 98K and $95K from the beginning of February. Whether the final break is ahead is about to be seen, still, the total crypto market capitalization managed to recover a bit during the previous week, but it still holds in a -2% negative territory from the beginning of this year. During the previous week, total crypto market capitalization increased by 2% on a weekly basis, adding $ 70B to the total market cap. Daily trading volumes dropped a bit from the week earlier, to the level of $170B on a daily basis. Total crypto market increase from the beginning of this year, currently stands at -2%, with $50B outflow of funds.
It was a volatile week, but with a positive end. BTC gained $ 23B on a weekly basis increasing its cap by 1,2%. ETH also had a modest increase in capitalization of almost $ 8B or 2,5%. Altcoins were the ones which drove market capitalization to the higher grounds. DOGE was traded higher by 9%, adding more than $ 3B to its market cap, same as ADA, which increased its value by 12,7%. This week BNB managed to add almost $ 5B to its market cap, increasing it by 5,4%. Among higher gainers was for one more time XRP, with an astonishing increase in market cap of $ 20B or 14,5%. Litecoin should be mentioned as the coin had a very good week, where it added $ 2B to its market cap, which was an increase of 25,5%. The majority of other altcoins managed to add up to 10% to their market value.
When it comes to circulating coins, it was one of relatively calmer weeks. Tether added 0,2% of new coins to the market, increasing by this percentage its market capitalization. Polkadot decreased the number of coins on the market by 0,4%, while Filecoin had an increase of 0,6%. The majority of other coins had an increase of 0,1% or less of their coins on the market.
Crypto futures market
The crypto futures had finally one green trading week. BTC futures were higher by around 1,6% for all maturities. Futures maturing in December this year were last traded at the price of $105.185, while those maturing a year later closed the week at $114.370.
ETH futures had a higher rebound of approximately 5,4% for all maturities. In this sense, December 2025 was closed at the level of $2.914, and maturities in December 2026 were last traded at $3.131. It is positive that the ETH long term futures were back for one more time at levels above the $3K.

Beware of the 5th Wave DownCRYPTOCAP:TOTAL
Beware of the 5th wave down…
Back in August 2024 the final 5th wave down was a signal that the correction was over. We found support at the 0:1.618 reverse fib retracement.
TOTAL appears to be demonstrating the same cause building event for another 5th wave down since we topped at 3.73T in December.
If this is the case, we may be looking for support at the 0:1.618 reverse fib retracement plotted at the green rectangle.
Trade with caution and good luck!

TOTAL - Inverted Creek GW FailureThis current fractal appears to be a limp and distributive Inverted Creek (Wyckoff), with a whipsawing Golden Window failure (0.618-0.786).
The upper pivot printed in an area of higher liquidity within the retracement Golden Window and beyond the Supply Trendline.
So there is double the liquidity in that area ; lots of traders with their stop losses / liquidations.
This makes it an attractive point of reversal for market makers, and so there is higher probability that this area might capture a high time frame pivot.
The high volatility of the whipsaw is the price action that signals that a significant momentum shift may have passed.
The drawn projection is just an illustration, but it could go something like this.
In a nutshell; this is a bearish look.
TOTAL is the chart with dominant ratios and historically it bottoms in the retracement Golden Window following a selling climax.
So if that happens again, it will be the ideal dip buy territory.
Not advice.

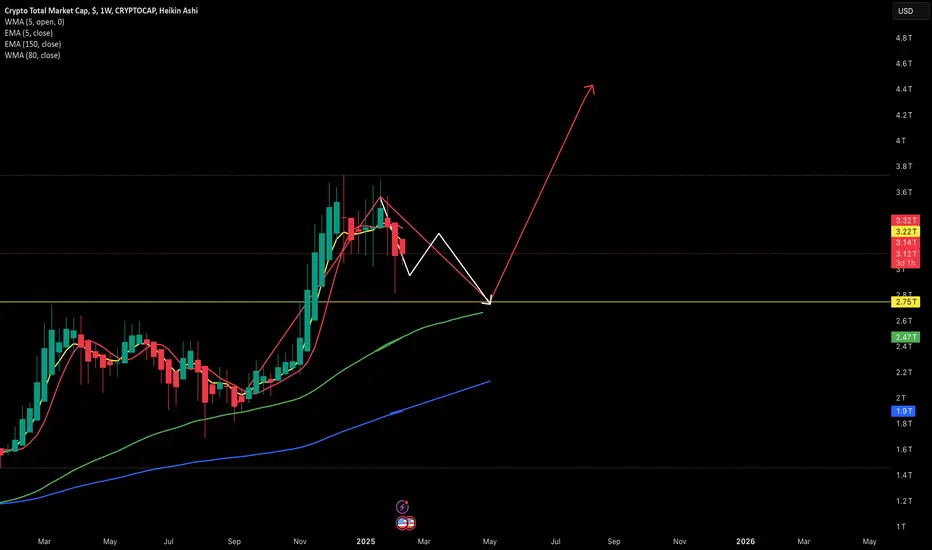
Crypto Total Market Cap (Mega Bullish)This chart is unbelievably, the most accurate chart, obviously because of bitcoin. I expect it to hold this level & move towards all time highs after that small line of resistance. Looks too good to be true, but this is the highest probability for now.

Bitcoin (BTC) Price Forecast Based on Market Cap and BTC DominanBitcoin (BTC) Price Forecast Based on Market Cap and BTC Dominance
If the total market capitalization decreases to $2.77 trillion and Bitcoin Dominance (BTC.D) drops to 58%, then the price of Bitcoin would be approximately $84,000. This aligns with previous analyses where I discussed the potential for BTC to adjust within the GETTEX:82K -$85k range.
To calculate the price of Bitcoin (BTC) when the total market capitalization decreases to $2.77 trillion and BTC Dominance (BTC.D) decreases to 58%, we use the following formulas:
BTC Price Formula:
BTC Price = (BTC Market Cap) / (Total BTC Supply)
Calculating BTC Market Cap:
BTC Market Cap = (Total Market Cap) × (BTC Dominance / 100)
Given the data provided:
Total Market Cap = $2.77 trillion
BTC Dominance = 58%
BTC Price Calculation:
To calculate the price of BTC, we need the current total supply of BTC, which is approximately 19 million BTC (you may confirm the exact figure at the time of calculation).
Steps:
Calculate BTC Market Cap:
BTC Market Cap = 2.77 trillion × 0.58 = $1.6086 trillion
Calculate BTC Price:
BTC Price = $1.6086 trillion / 19 million BTC ≈ $84,526.3
Thus, the price of BTC would be approximately $84,526 if the total market cap drops to $2.77 trillion and BTC Dominance reaches 58%, assuming a circulating supply of 19 million BTC.
This conclusion aligns with previous assessments, indicating that Bitcoin could be adjusting toward the GETTEX:82K -$85k range.
Total , about to explode Candles tapping ATH atm which is a sign of imminent rebound and fly , times running out and we have to lit the fire soon , anywhere between around 10 trillion to couple more would be a precious load off zone , tbh holding right above ATH with the nasty alts situation feels weird for me too but let’s hope mid range caps start getting back soon .

CRYPTO TOTAL MARKET CAP READY TO FIRE📊 Price Action & Trend Analysis
Analyzing market trends using price action, key support/resistance levels, and candlestick patterns to identify high-probability trade setups.
Always follow the trend and manage risk wisely!
Price Action Analysis Interprets Market Movements Using Patterns And Trends On Price Charts.
👉👉👉Follow us for Live Market Views/Trades/Analysis/News Updates.

TOTAL2: When I’ll Deploy My Stables Back Into the MarketTiming the market perfectly is impossible, but using TOTAL2 and RSI, we can identify high-probability opportunities. Here’s my approach for the coming years.
I bought during the last dip, but my exposure is still less than what I sold before the crash. Here’s why.
Key Signals for Tops & Bottoms
RSI Patterns:
- Market Tops: Weekly RSI above 85 signals overheated conditions but does not always lead to an immediate reversal.
- Market Bottoms: Weekly RSI near 30 has historically marked strong accumulation zones.
- In the last seven years, RSI hit 30 only twice—2018 and 2022. I expect this level again within the next 24 months.
My plan:
I will deploy capital heavily when RSI approaches 30 again, securing long-term positions.
TOTAL 2 Scenarios: What Comes Next?
Scenario 1: Price Discovery
- If TOTAL 2 flips 2021 highs, ETH and altcoins will likely reach new all-time highs.
- Weekly RSI could exceed 85, potentially reaching 95, indicating extreme overbought conditions.
- I will take profits aggressively at this stage while also using a DCA strategy, as precise timing is never certain.
Scenario 2: Lower Highs Persist
- If RSI fails to reach overbought levels, this cycle may be weaker than expected.
- The 50 RSI zone is critical—if it aligns with oversold conditions on daily or 3-day RSI, it may present a selective buying opportunity.
- I have already taken partial profits since November 2024 to manage risk in case of this scenario.
Scenario 3: RSI Drop to 30
- This scenario appears likely within the next 24 months and would mark a bear market low.
- If BTC, ETH, and TOTAL 2 all hit 30 RSI, I will fully deploy stables with high conviction, considering it a generational buying opportunity.
Final Thoughts
Summary: I will increase exposure once RSI confirms strong long-term buy zones, but I am managing risk in the meantime.
What’s your take? Do you expect RSI to revisit 30?


Big Dump on Crypto is true ?!Hello everyone
Trade with Mky one of the oldest Persian Channels in tradingView
I asume crypto could drop to some support zones that mentioned in chart
be Carefull ,
consider its my analysis from this chart and not financial advise
#TradeWithMky @TradeWithMku

$TOTAL Close Lackluster - What This MeansCrypto CRYPTOCAP:TOTAL Market Cap closes another day in its lower range $3.1T, failing to break the 9DEMA.
The TOTAL chart is not given enough credit because most do not understand it.
It’s best used to let us know how much money is sloshing around from narrative to narrative.
Once it definitively breaks that $3.7T range, then a rising tide raises all ships and it's ALTSEASON folks 🚀

$TOTAL potential bounce👀 It has been exactly one week since we witnessed the largest liquidation of traders in crypto history, while altcoins rapidly plunged to new lows. 📉
Looking at the Total Cryptocurrency Market Capitalization, last week was mostly a phase of accumulation/consolidation above the range low. 〰️
Overall, the current picture doesn’t look bad, and we have a good chance of seeing growth in the near future. 🧐

Total Crypto Market Capitalization prediction for 2025 v.2.0☀️ A ray of hope from us and what is drawn on the chart of total capitalization in the crypto market.
But first, re-read the post from 31/12/24 👇
Pay special attention to paragraph 5️⃣
📊 And now let's move on to the same chart - 1.5 months later, in a zoomed-in version.
The minimum was recorded at $2.81 trillion with an estimate/forecast of $2.85t
So, based on the fractal we proposed and built earlier, it turns out:
1️⃣ A “trial” wave of growth is coming soon
2️⃣ Then a short consolidation
3️⃣ In mid-March - the beginning of the alt-season. (Earlier we wrote that it would be a “miracle” if, despite the pessimistic forecasts that the Fed rate will not be reduced in the near future, it will be reduced on March 19)
P.S:
❓ so, do you believe in what the charts are showing?) Do you believe in growth?
⁉️ If so, which “cluster” of altos will set the growth trend, in your opinion?

MARKETS week ahead: February 10 – 16Last week in the news
The US jobs data posted on Friday increased investors' concerns over a potential increased inflation in the US in the coming period. The US equity markets reacted with a negative sentiment, pushing the S&P 500 0,95% to the lower grounds, where the index ended the week at the level of 6.025. The US Treasury yields also reacted to the potential increase in inflation by reaching for one more time levels of 4,5%. The price of gold continues its positive track for the six consecutive weeks, reaching a fresh new all time highest level at $2.860, still fearing trade tariffs imposed by the US Administration. The crypto market was quite volatile during the week, with BTC dropping down to the levels of $96K.
The main macro data released during the previous week were the ones related to the US jobs market. The non-farm payrolls reached 143K in January, which was lower from the market estimate of 170K. Still, the main concern related to inflation came from the unemployment rate of 4,0% in January, which was lower by 0,1 percentage point from December and from average hourly earnings which came at the level of 0,5% increase for the month, and higher from market estimate. Although all these figures are positive for the US economy, markets were not happy. Simply, by calculating that higher employment in combination with higher earnings will push the spending higher as well as inflation. In this scenario, the Fed will have no options to decrease interest rates, which will be held at current levels for a longer period of time. The S&P 500 ended Friday trading session by 0,95% lower, while US 10Y Treasury yields reached 4,5% on the data release.
The AI race continues among tech companies. As per published news, Meta, Amazon, Alphabet and Microsoft are planning to invest $320 billion into artificial intelligence only during this year. These funds will be used to build up large data centers and other AI related infrastructure, which will support further development of the AI segment in these companies. Not only big techs are in the race for AI. As per news, SoftBank will invest $ 40B, with $260B valuation, into Open AI. Part of these funds will be used to further support the Stargete, a partnership project with Oracle.
The new US Administration is evidently bringing back large companies back to the US. The latest one which announced its return of focus toward the US market is a beauty-company L`Oreal. The company was a bit disappointed with its sale on the China market, in which sense, defined the US “as the land of opportunity”, switching back their focus from China to the US market.
Crypto market cap
The start of the previous week was promising, however, the second part of the week was not so nice for the crypto market. The US jobs data was the one to heat inflation fears, in which sense, investors reacted in a negative manner. All crypto coins ended the week in red, with BTC leading the drop in the crypto market capitalization in nominal terms. This week, there was a huge drop in the value of the crypto market, where $260B or 8% of the market capitalization was erased. Daily trading volumes remained almost flat in relation to the week before, moving around $ 230B on a daily basis. Total crypto market cap increase from the end of the previous year entered into a negative territory, with an actual decrease of 4%, where $120 was withdrawn from this market.
There has been a significant drop in the value of the crypto market, where almost all coins lost in value. BTC, as the coin with the highest market cap, decreased its value by 4,6% on a weekly basis, decreasing its cap by $92B. ETH also suffered a loss during the week, with a drop in value of 16,5% or $63B. XRP recently reached an ATH, however, this week the coin dropped by 16,%%, decreasing its value by almost $28B. DOGE was one of the main coins which suffered a higher loss of 19% w/w or $8,8B. Cardano was also down by 22,6% w/w or $7,2B. Market-favorite Solana also suffered the loss of 8,9% or $9,3B. TRUMP coins continue to lose value, with an additional drop in price of 11,7%.
As per coins in circulation, there have been some interesting developments with Polygon. Namely, the number of Polygons coins on the market increased by an incredible 24% during the single week. There is still no information regarding the cause of such a high increase of circulating coins. As for other altcoins, there has been an increase of 0,5% of the number of circulating coins of IOTA, while Solana increased its coins by 0,2%. At the same time, Maker decreased the number of coins in circulation by 0,7% w/w.
Crypto futures market
The sentiment from the spot market was transferred to the futures market. As of the weekend the crypto futures market was traded significantly lower when compared to the week before. BTC futures were traded lower by some 6% for all maturities. The futures maturing in December this year closed the week at the level of $103.705, while those maturing a year later were last traded at $112.745. This was the highest correction of expectation for the two years since the beginning of this year.
ETH futures also experienced a significant drop on a weekly basis of more than 22% for all maturities. All futures prices dropped below $3K. In this sense, futures maturing in December this year dropped to the level of $2.764, and those maturing a year later were last traded at $2.970.

TOTAL might see good green candles next couple weeksthe total Market cab is broke the 3 trillion dollar level and retesting back to it and we might see good green candles next couple weeks

Bitcoin probably will peak at around $386,000 in Oct 2025This is the total market cap crypto chart since 2015. Notice there are two lines drawn; one is long term support and the other is long term resistance formed from the last two cycle peaks.
Focusing on the long term resistance line the following are the top cycle dates, Bitcoin market cap, Total Crypto market cap and % Bitcoin of the total market cap at the last two cycle peaks:
Date Bitcoin Mkt Cap Total Crypto Mkt Cap % Bitcoin of Total Cap
12/17/17 $320.6 B $761.74 B 42.0
11/10/21 $1.236 T $3.01 T 41.1
2/9/25 $1.908 T $3.15 T 60.5
10/21/25 $7.66 T $18.46 T 41.5
Notes:
1. Notice the last two cycle peaks Bitcoin peaked it was 41 to 42% of the total Crypto Market Cap.
2. Notice today Bitcoin is 60.5% of the total crypto market cap.
3. Since alt season really hasn't started but is expected to occur eventually before this bull market is over, Bitcoin to fall to 41-42% of total market cap will have to underperform the alt coin total market cap in the next 8.5 months.
4. I'm predicting Oct 2025 for a cycle top since the last two bull market cycles for Bitcoin lasted 35.1 months (1/14/15 to 12/17/17) and 34.8 months (12/15/18 to 11/10/21). 35 months from the start of this bull market (11/21/22) is 10/21/25.
5. Continuing the resistance line forward in time projects $18.46 T for total crypto market cap by 10/21/25. Assuming Bitcoin drops to 41.5% by dominance it will have a $7.66 T market cap by then. $7.66 T / $1.908 T (now) = 4.01 fold. 4.01 fold the current $96,280 Bitcoin price puts the Bitcoin price at about $386,000 by 10/21/25.

Future of CryptocurrencyHello evey one
#TradeWithMky @TradeWithMky is a channel for all crypto community
Iranian people shown they are activest people in this community
consider this is not finantial advise its my analysis based on this chart and Chart pattern
iF price passed range zone we can expect continue bullish movement to at least 4T market cap
but i guess its not end and market could eseasly go upper than 4.5 T soon to reach 5T

Super Bowl LIXSuper Bowl 59 will kick off at 6:30pm EST at the Caesars Superdome in New Orleans, the home of the New Orleans Saints. The Philadelphia Eagles and Kansas City Chiefs will face off at their second Super Bowl in three years on Sunday. There's a lot on the line: the Chiefs could become the first team to win three straight Super Bowls, while the Eagles hope to redeem themselves after a nail-biting loss in 2023. Even non-football fans will have plenty to look forward to, from star-studded commercials to a halftime show.
Long crypto trade idea:
1)
buy spot of 20 different cryptos basket
leg in each hour until bullish reversal is clear
then set stop loss 0%
set take profit +10%
2)
leg in to leveraged long
start at 5x leverage
dial up to 10x leverage
set stop loss at 0%
set take profit at +100%

Leave The World Behind - BIG CRASH IS NOWGet Out Before it's too late.
This can't continue.
I don't see any more pump. The Institutions are liquidating their wallets.
Retailers are greedy.
Global Open interest is heated like a virtual volcano.
I think it's time for a Hard RESET.
Enjoy.
Thank You Trading View for the world's best platform ever.
ALOHA

TOTAL MARKET CAPTOTAL MARKET CAP 👀⏳
Bitcoin Ethereum and Altcoins pause or run line!
Victory belongs to those who dare to take one last step.

Important time Interval - #BTCAnalyzing Total Market Cap - Key Level at $3T
As observed, the total market cap is currently interacting with significant support at the $3T, which aligns with key structural and Fibonacci levels. Staying above this resistance will continue the bullish momentum while breaking it might indicate further consolidation or a retest of lower supports.
Monitor 45-degree (up-yellow angle), volume, and RSI divergence for potential confirmation of the next move.
#TotalMarketCap #CryptoAnalysis #TechnicalAnalysis"

TOTAL update#TOTAL is the whole crypto market cap there is a possible pattern in this chart which is a rising wedge and this can help the market rise one more time then the waves will be completed and then the market can have some rest and unleash the taken liq !
