TOTAL ideaThese are the key area im looking at for TOTAL during this bullrun. If I change my mind I will update below this post.
TOTAL trade ideas

Total to do just 4.6T-5.6T in 2025?hey
it looks we are in some nice healty bull run going into 2025.
Tops could happen in early April or/and early May.
Healty retracement afterwards, and one more bull run towards early November.
Well that is what past shows us, and future will do?
what it wants :)
go go, lets do better then past.
de

Total Market CapTotal Market Cap started a parabolic run from the beginning of 2021 after the breakout and retest in December 2020, which was the 2017 ATH level ($761B).
The breakout at the 2021 ATH level ($3.01T) in December 2024 has been co!mpleted and is being retested!
I think the countdown to the parabolic run has begun for CRYPTOCAP:BTC CRYPTOCAP:ETH and #Altcoins

MARKETS week ahead: December 23 – 29Last week in the news
The Fed cut interest rates by another 25 bps, but Powell`s rhetoric in an after the meeting address to the public did not make markets happy. A correction was strong and immediate. The US equity markets were hit the most, followed by the crypto market. A market correction brought the S&P 500 down to the level of 5.930. BTC reached its lowest weekly level at $ 92K, however, recovered as of the weekend to the level of $97K. The price of gold followed US Dollar volatility, dropping down to the level of $2.622. In line with Feds expectations of a 50 bps cut in 2025, the 10Y US benchmark yields jumped to the levels above the 4,5%.
At a December FOMC meeting the Fed cut interest rates by another 25 bps, which was generally expected. However, markets were not at all happy to hear what followed. The FOMC projections for year 2025 showed inflation expectations to be higher from previously estimated. The PCE inflation indicator is expected to end 2025 at 2,5%, higher from previous estimation of 2,2%. The targeted 2% is expected to reach in 2027. At the same time the Fed expects the jobs market to be cooling, but the GDP forecast was not changed from the previous estimate. As the discounting rate changed, so the markets entered into correction, where US equity markets were hit the most.
On a positive side for US markets is that the Bank of Japan decided to hold interest rates at 0,25% for the third time this year. Considering significant carry trade in Yen, this is positive news that markets will not suffer another shock till the end of this year.
A hit for the European markets during the previous week was a slide of value of Novo Nordisk shares by 20%. This drop came after the Danish drug maker published results for a weight-loss drug that did not meet expectations in a trial. Although the drug was expected to help patients to lose 25% in weight, the trial showed efficiency of 22,7%. It seems a low difference in effect, but might make a huge difference with competition, hence, investors decided to reduce the value of Novo Nordisk.
China is continuing execution of its long term goals to be the leader in the field of electric vehicles in the future period. The news published by Reuters, points to a Chinese company Nio which has introduced its new EV car model, with the aim to compete with Mercedes SMART and BMW Mini electric vehicles. Nio`s EV will have the same price as German carmakers on China's market. Germany's auto industry is already facing difficulties with car sales, where China was one of the main markets, after Europe.
Crypto market cap
It was a hard week on the crypto market. Unfortunately, this was also the last actively trading week for this year, before the Holiday season in the Western markets. So, what actually happened? The Fed managed to spoil Holiday fun and decided to revise its economic projections for the next year. In a fear of inflation which is expected to be persistent, the Fed is expecting to cut interest rates probably two times, in total by 50 bps. This is exactly what markets did not want to hear, considering that now the discount factor is higher, bringing evaluations into a correction. Also, it should be considered that borrowed money will be more expensive, from previous projections, which again might imply less funds for the crypto market. Total crypto market capitalization decreased by 7% on a weekly basis, although the drop in one moment was more than 10%. Friday's market correction erased some of the weekly losses. Daily trading volumes were also higher, to the level of $397B on a daily basis, from $297B traded a week before. Total crypto market capitalization increase from the end of the previous year currently stands at $1.622B, which represents a 99% surge from the beginning of this year.
Bitcoin was the one to drive the market sentiment during the previous week. However, BTC lost “only” 3,5% in value compared to the price from the end of the week before. BTC also lost $71B in its market cap. Still, when it comes to drop in value in relative terms, altcoins were the ones that lost the most during the previous week. The range goes from 10% up to 30% with some specific coins. The majority of altcoin lost somewhere around 20% on average. It could be noted that major coins lost much less in value from other altcoins. In this sense, XRP was down by 6% on a weekly basis, BNB dropped by 6,5%. Surprisingly, or not, ETH dropped by 12,5%, earning $57B from its market cap.
Considering coins in circulation, the increased activity continues. Stablecoin Tether withdrew the number of coins by 0,2%. LINK had an increase in the number of coins on the market by 1,8%, while Filecoin increased its circulating coins by 0,4% this week. The majority of other altcoins had an increase by 0,1% during the week.
Crypto futures market
The spot market was not at all pretty during the previous week, hence, the crypto futures market could not look much better. Both BTC and ETH futures were traded lower for all maturities, in line with spot market sentiment. However, there are also some positive developments, not all looks so bad.
BTC futures fell by more than 5% for all maturities. Still, on a positive side is that futures maturing from April 2025 hold the levels above the $100K. Also, December 2025 ended the week at the level of $105.710, while March 2026 was last traded at $107.990. This is a positive sign that the market still perceives BTC strong in the long run.
ETH futures had a stronger drop on a weekly basis, of around 12,5% on average for all maturities. The prices of futures fell below the $ 4K levels. December 2025 was last traded at $3.721, while March 2026 closed the week at $3.790.

TOTAL is super bullish (1W)TOTAL also appears to have completed a large triangle and entered a bullish phase from the point where we placed the green arrow on the chart.
The structure of this bullish phase is not yet clear, but it is evident that only the first wave of the bullish phase has been completed.
Currently, the price is in the second corrective wave, which will likely conclude in the coming weeks. Afterward, TOTAL is expected to enter the third wave, which is a bullish wave.
We have identified the upcoming targets for TOTAL.
In this corrective wave we are currently in, the market will experience pumps and dumps aimed at liquidity hunting, so you should be cautious with your futures positions.
For risk management, please don't forget stop loss and capital management
Comment if you have any questions
Thank You

TOTAL CRYPTO BULLRUN END Q1 2025The total crypto market capitalization appears to be nearing its peak, as we are now in the final stages of the larger-degree Wave 5. Within this wave, we anticipate a corrective move in the smaller subwave 4 before the final push in subwave 5. This final leg of the larger Wave 5 is projected to drive the market cap to at least $4.5 trillion.

Total ChartAs predicted market gave us a correction and we got supported from our weekly zone. There is a chance it comes to the support once more and have a consolidation for a while and continue to push upwards.
If that happens we can have a discount on already discounted alt coins. So be brave and don't trade with emotions, but the dips and you'll thank me later.
DYOR
Goodluck

#Crpto #Total I am still holding onto my primary count. What I think is controversial is the wave that I encircled. Also I want to add that I remain bullish b/c of the nested 1,2 price action from (truq w4) lows. Therefore it should extend to 4.5-4.6 trillion market cap after this correction

Crypto Market likely to create new low around ChrismasCrypto Market likely to create new low around Chrismas.

Updated Total Market Technical ExpectationsLooking at the typical behaviour in previous Bull market cycles, this pathway looks to be the most likely scenario over the next few months.
Of course anything can happen, and with new price action, other options/alternatives will be in play.

$TOTAL Crypto Market Cap Signals End of CorrectionCALLING IT NOW 🚨
THAT WAS THE BOTTOM OF THE DIP 💯
✅ Bounced beautifully off the 50DMA
✅ RSI is fully reset to when the Trump Pump started
✅ Volume has turned bullish to signal trend reversal
✅ The Crypto CRYPTOCAP:TOTAL Market Cap needs to stay above 3.2 - 3.3T
Some clustered days around this region will signal even more strength.
🚀 3.6 - 3.7T reclaims bullish trend.
SANTA CLAUS IS COMING TO TOWN 🎅

TOTAL - Perfect RetestSo far, the total crypto marketcap has added over $200 billion since the low was put in hours ago!
These are early signs of the dip being over after such volume reentered very quickly to scoop up the low prices.
Also, the crypto total marketcap retest its previous 2021 ATH as new support. Macro old resistance being flipped into new support like that is a very very good sign. Shows strong demand in that new range.

Total going to 4.46T Total going to $4.46T 🚀
After a healthy correction, the Total Crypto Market Cap is poised for a strong rebound. Current support at $3.07T suggests a potential bullish move towards $4.46T. The target aligns with the continuation of the overall uptrend.
Let’s see how it plays out! 📈

TOTAL Cap | BTC UpdateTotal marketcap at minor support 3.25B.
if it holds we can see bitcoin going sideways for little while
and till then alts will have some relief rally.

$TOTAL Market Cap FUD Sell-Off 14% sell-off on Crypto CRYPTOCAP:TOTAL Market Cap in the past 24 hrs
If we don't reclaim support here, could have another ~8% down to go. If that happens, I expect it to happen swiftly with a V-shaped recovery
Get your bids in!
NO NEED TO PANIC
Santa Rally still on the table 🎅

How to confirm that Alt Season is Staring?Just check this chart for following up.
Compare it to previous seasons
we Already started the season, but every trend line we will face a resistance you have to freeze your coins, by converting them to USDT
bouncing up means buy again,
dropping down means sell your coins
keep an eye on this chart
good luck

Crypto Market Cap 300% PUMP 2025?!This chart highlights a recurring pattern in the Total Crypto Market Cap over several years, emphasizing the cyclical nature of the market.
Key Observations for 2025:
- The chart shows prior cycle tops aligning with similar patterns, where support and resistance levels played a critical role in market direction.
- We are now at a key resistance level (highlighted in green). If the market successfully breaks above this level, the next phase of upward momentum (Green Arrow) may lead to significant growth.
- However, failure to hold this breakout could result in another correction phase (Red Arrow).
This analysis showcases the importance of understanding market cycles to anticipate possible trends. While history doesn’t repeat perfectly, it often rhymes , making pattern recognition a valuable tool in strategic decision-making.
Could we see a 300% rally or more? Let your opinion be known in the comments.
INDEX:BTCUSD
CRYPTOCAP:TOTAL

MARKETS week ahead: December 16 – 22Last week in the news
The ECB cut euro reference rates by 25 basis points, which the market expects also for Fed at their FOMC meeting on December 18th. Markets were traded in a relatively mixed manner during the previous week, positioning as per expectations for the forthcoming rate cut. The S&P 500 tested for one more time the recent ATH, however, ended the week a bit lower, at the level of 6.051. The price of Gold reverted a bit during the week, on US Dollar strengthening, closing the week at the level of $2.647. The US Treasuries were reacting on inflation data, in expectation of the forthcoming rate cut, where the 10Y benchmark yields returned shortly back toward the 4,4% level. The crypto market had a relatively mixed week, with BTC shortly tested the $95K support line, but ended the week above the $100K level.
The European Central Bank cut interest rates for another 25 basis points, as expected. The ECB is for some time struggling to achieve the inflation within the targeted level of 2%, and to sustain the Euro Zone economy which was hit by the environment of high interest rates. The ECB President Lagarde tried to stay optimistic, and pointed to the better-than-expected growth in Q3 and that “the economy should strengthen over time”. The latest ECB economic projections were also optimistic. It projects a growth of 1,1% in 2025, while inflation should move around targeted 2%. Still, it should be mentioned that these projections do not include effects of potential moves from the US newly elected President.
The company Broadcom was highly discussed in the news during the previous week. It was in the market stoplight due to the company's surge in the price of shares by 24% for the week, after the company published that its revenue generated through AI products soared by an incredible 220% for the quarter. At the same time, the company reached a $1 trillion club. At the moment analyst opinions are divided regarding the future prospects for this company. On one side, there are those who strongly support the opinion that the company's value will only grow amid increasing demand for AI chips, while on the other side are those who noting that it is a heavy field for one company to stay competitive to NVDA.
The US Nasdaq index, which follows the 100 largest US companies, announced that it is planning to include MicroStrategy in its latest yearly rebalancing of the index. Analysts are noting that this move will be positive for Michael Saylor`s company, as it will increase the demand for shares originating from exchange traded funds.
News is reporting that one of largest banks in France, Societe Generale has successfully conducted the first Repo transaction with the National Bank of France. Bonds were deposited on Ethereum blockchain, in exchange for the central bank digital currency.
Crypto market cap
During the previous week the crypto market was traded in a mixed manner. One of the supporting notes for BTC came from CEO of the BlackRock investment fund, Larry Fink, who noted his opinion that a diversified portfolio should contain up to 10% exposure in BTC. A strong demand for BTC still holds on the market, which helped this coin to return toward levels above the $100K, after modestly reverted to $95K. Still, total crypto market capitalization decreased by modest 2% during the end of the week, losing some $80B in value. Daily trading volumes also eased, reaching $279B on a daily basis, which is a drop from $405B traded a week before. Total crypto market capitalization increase from the end of the previous year currently stands at $1.862B, which represents a 114% surge from the beginning of this year.
Most of the crypto coins were traded with a negative sentiment during the previous week. Still, the market was driven by BTC, in which sense, total weekly loss eased due to inflow in BTC of $ 26B, increasing its value by 1,3% on a weekly level. On the opposite side was ETH, with a weekly loss in the market cap of $19B or 3,95%. DOGE was also on a losing side, with a drop in value of $9,5B or more than 14%. ADA dropped by 12,2%, decreasing cap by $ 5B, while BNB ended the week down by 5,8%, losing $$6,2B. Among the highest losers in relative terms were coins like Bitcoin Gold, which dropped by 41% w/w, DASH, EOS, IOTA, DOT lost more than 20% in value, while the majority of other coins lost somewhere between 6% and 20%. Tether was one of rare coins which increased its market cap by 1,65%, increasing by this percentage the number of its coins on the market.
Increased activity within the field of circulating coins continues. The highest weekly increase came from SOL, which increased the number of circulating coins by 0,6%, and was followed by IOTA, with a surge of 0,5%. Thai week Filecoin increased the number of coins by 0,4%, while the majority of other coins had an increase of 0,1%.
Crypto futures market
The crypto futures market reflected the sentiment from the spot market as of the end of the previous week. BTC short term futures were holding relatively flat compared to the previous week, while the longer term ones just modestly dropped by around 0,5%. However, futures maturing in December 2025 were traded almost flat to the week before, with closing price of $111.685, and $114.090 for maturity in March 2026.
ETH futures which are maturing as of the end of the year had a significant drop of 18% on a weekly level. The longer maturities had a lower weekly drop of around 3,5%. Futures maturing in December 2025 closed the week at the level of $4.242, while those maturing in March 2026 were last traded at $4.320.

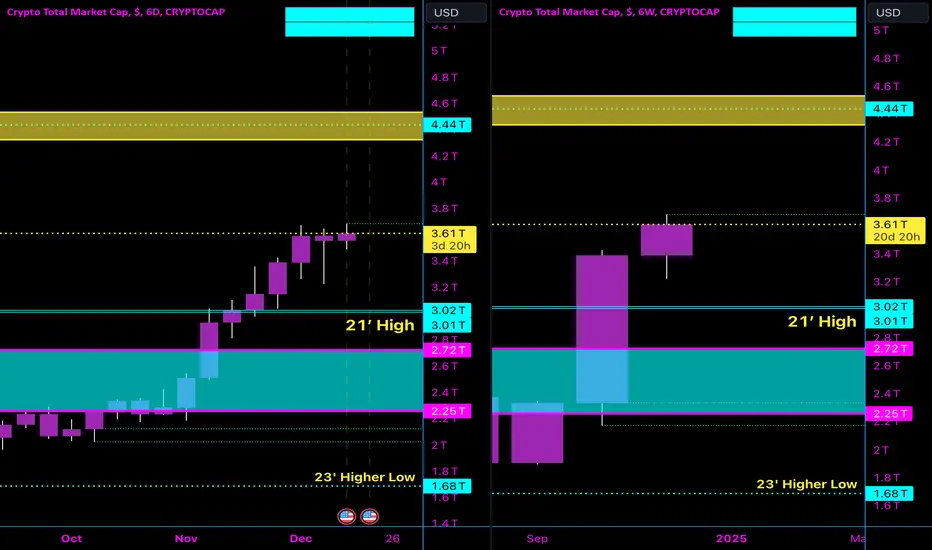
Crypto Bullish Momentum is coming and brewing Price has successfully broken above key resistance levels on both the 6-Day and 6-Week timeframes, signaling continued bullish momentum.
Here’s the detailed observation:
1. 6-Day Chart:
• Price has cleared previous resistance and is holding above key levels.
• A clear cup formation (highlighted) is visible, typically indicating a bullish continuation pattern.
• Consolidation at this point shows strength, as it allows price to build momentum for the next push upwards.
2. 6-Week Chart:
• The bullish candle structure looks strong and clean.
• Price remains above the 21’ High, which acts as a significant support level.
• Volume and structure indicate a healthy trend, with no signs of reversal at this point.
• This timeframe aligns with the bullish sentiment, further confirming the upward trajectory.
Summary:
The bullish momentum remains intact across multiple timeframes. The break above resistance combined with consolidation is a strong indicator that price is preparing for the next leg up. Monitoring the 6-Day and 6-Week charts closely will help confirm continued strength as the market progresses.
Urgent! Crypto Flirting with Critical Support ZoneThe Crypto market cap is testing a critical support level of 3.49T . A drop under this liquidity zone could trigger a cascade of sell-offs, potentially leading to heightened volatility across the market. If the support fails to hold, it may signal a bearish trend reversal, prompting further downside pressure as traders and institutions seek to minimize risk. Conversely, a strong bounce from this level could reinforce bullish sentiment and set the stage for a recovery rally. The next key levels to watch would be the 3.3T range for support and 3.6T for resistance.

TOTAL 15M: Hidden Bullish Divergence on Fake-OutThe Total Crypto Market Cap is displaying a significant technical setup on the 15-minute timeframe. We've observed a hidden bullish divergence forming in conjunction with a false breakout pattern, suggesting strong continuation potential. The market has maintained its structural integrity despite the fake-out attempt, indicating robust underlying strength.
The primary trend direction remains bullish, evidenced by the series of higher lows forming on the 15-minute chart. A notable hidden bullish divergence has emerged between price action and the RSI indicator, where price made higher lows while the RSI showed lower lows - a classic continuation signal in an uptrend. The market's reaction to the false breakout demonstrates strong buying pressure, as prices quickly recovered and resumed the upward trajectory.
Price Targets
Based on the technical structure and the measured move from the pattern:
Initial Target: $3.85T (near-term resistance level)
Secondary Target: $4.0T (psychological round number)
Extended Target: $4.2T (based on previous move projection)
Entry Conditions
Primary entry at current market price ($3.51T) following confirmation of hidden divergence
Secondary entry on any pullback to $3.45T support level
Initial Stop Loss: $3.42T (below the recent swing low to protect against further fake-outs)
Take Profit Levels:
TP1: $3.85T (25% position size)
TP2: $4.0T (50% position size)
TP3: $4.2T (remaining position)
Stop Loss Placement: Below the recent swing low to accommodate market volatility
Position Scaling: Consider scaling into the position with 50% at entry, 50% on pullback
Market Conditions to Watch: Bitcoin's price action, as it often leads market direction
Additional Considerations
The presence of a false breakout followed by quick recovery suggests strong underlying buying pressure. The hidden bullish divergence adds significant weight to the continuation thesis, particularly given the overall market strength.
Bullish Case: Maintained as long as price holds above $3.42T with RSI showing positive momentum
Invalidation: A clear break and close below $3.42T would negate the setup
The broader crypto market is showing strength, with major cryptocurrencies maintaining their upward momentum. This macro context supports the bullish continuation scenario for total market capitalization.

KEEP IT SIMAPLE Im bearish on btc
100k is wayyyy to high without any correction
its not healthy at all for the chart !
what goes up fast goes down even faster

The next few weeks i think will be interestingI was hoping the rally will be going up and up through the holidays but it looks like it needs a breather DURING the holidays.
bullish
