Total - Preparing for Next Leg? This is an update to our last post:
We did see the total crypto marketcap make a short term top and fall about 10% or $200 billion. Now we must reexamine the market structure to determine if money is about to flow into this market or continue to flow out.
Right now, based on current market structure it seems more likely for money to flow in and us have another leg to the upside. This is because strength is gaining on the 6H timeframe. We can see this because previously every time we visited the key $3T level (yellow line) the total marketcap continued to close candles below that level showing outflows at 3T. Now we have just seen 2 6 hour candles close above that level and the marketcap is currently respecting that as a new buying liquidity level. We still need more time for this to confirm, but the early signs look promising.
Now let's examine if the marketcap breaks back below $3T and cannot reclaim that level. If that is the case we could see a massive liquidity event that could lead the total market cap as low as $2.5T! Then after retesting that macro resistance level as a new level of support we should have the momentum to break $3T.
TOTAL trade ideas

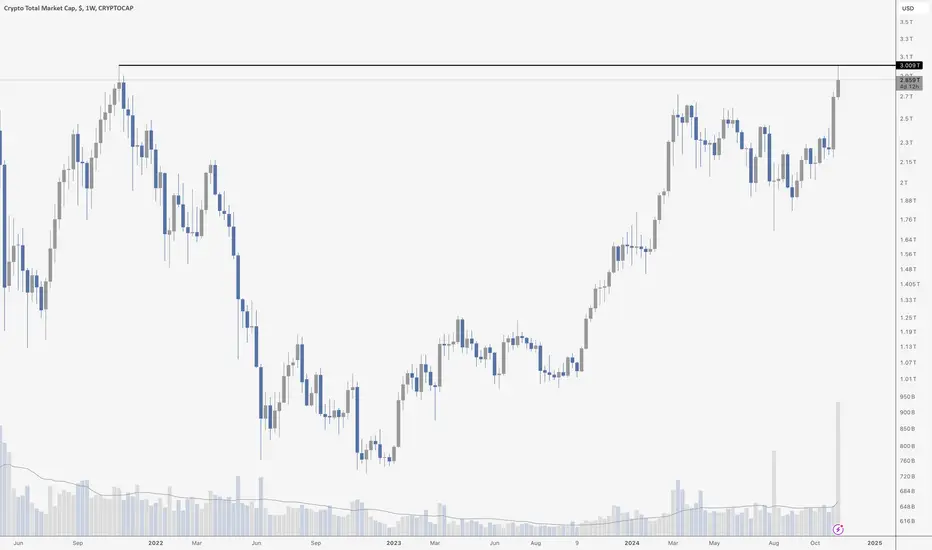
Point of maximum financial opportunity is here and now- total just confirmed new weekly ATHs on a closing basis
- it is likely we are about to repeat Dec 2020 (blue circle): as soon as total made a new weekly ATH the market kept surging for several weeks before finding an interim top
- target of the bull flag that has been forming for over a year now is just shy of 4T

Total Crypto Cup and HandleTotal has form a big cup and handle something like what Gold had before it breakout. Once we see a confirm breakout i have measure the target for the breakout at around 4.85T.

Total Crypto Cap: "A Rising Tide Lifts All Boats"Beautiful Cup & Handle pattern (yellow) has been built on the chart.
Price broke above the Handle this month confirming the bullish stance
Total Crypto Capitalization ( CRYPTOCAP:TOTAL ) could reach $4.53 Trillion.

MARKETS week ahead: November 18 - 24Last week in the news
The Fed “is not in a hurry” was the sentence which marked the previous week on financial markets and impacted its sentiment. The US Dollar continued to gain for the second month in a row, pushing the price of gold to the lower grounds. Gold ended its worst week within the last three years at the level of $2,56K. The US equity markets dropped during the week, both on news that the Fed might postpone interest rate cuts and on the nomination of a new administration in the US. The S&P 500 dropped to the level of 5.870. The US Treasury yields continue to eye higher grounds, ending the week at 4,44%. The only market which continues to perform with strong surplus is the crypto market. BTC reached another ATH, during the week, marking the $92K.
The Fed Chair Powell's speech at Dallas during the previous week was the most important for financial markets during the previous week, as the Chair noted strong US economic growth, based on which, the Fed is not “in a hurry to lower interest rates”. Market reacted to this statement, by bringing equities lower and Treasury yields to the higher grounds. As for US macro data posted during the previous week, the Inflation figures for October showed core inflation at 3,3% y/y and inflation rate at 2,6% y/y, which was in line with market expectations. The Retail Sales further surged in October by 0,4%, while the Industrial Production dipped by -0,3%y/y in October.
Palantir, a company developing software for military use, spotted the most market attention during the previous week. The stock is currently trading some 45% higher from the moment the company posted much better than expected quarterly results. On the other hand, the company officially published that it will change its listings to Nasdaq, on November 26th. Analysts are estimating that a switch to Nasdaq would increase stocks availability to retail investors.
The news that hit the aluminium market during the previous week came from China. Namely, China officials announced that the Government will cut its export tax rebate policy on aluminium, starting from December 1st. The purpose of these tax rebates was to make China's products more competitive on the global market, making China's products more cheaper. China is by far the largest producer of aluminium, with an yearly output of 40 million tonnes.
There is no need to specifically mention that the BTC price surged to the levels above the $90K in a post-election, however, the surge in XRP price deserves special attention. Namely, during the previous week a news came that the State Attorneys and the DeFi Education Fund made charges against the SEC for unconstitutional overreach in terms that the SEC overstepped its boundaries when it comes to its actions against digital asset exchangers. Although the lawsuit is not directly connected to Ripple, still, a positive outcome will have implications on SEC`s pending appeal against Ripple, which is a company standing behind the XRP token.
Crypto market cap
A crypto-friendly new US administration pushed further the value of the crypto market during the previous week. Total crypto market capitalization is nearing $3 trillion, ending the week at the level of $2.995. This represents an 11% increase just for this week, with a total cash increase of $304B on a weekly basis. Daily trading volumes also increased to the level of $351B on a daily basis, which is a surge from $278B traded a week before. Total crypto market capitalization increase from the end of the previous year currently stands at $1.357B, which represents a 83% surge from the beginning of this year.
BTC was the coin that was driving the market, however, this week XRP deserves special attention. During the week, XRP gained an incredible 100% increase in value, which could be treated as sort of never-seen result within the one week on the crypto market. What happened? As per news reports, US State Attorneys and the DeFi Education Fund sued SEC for overstepping its legal boundaries with actions against digital asset exchangers. Although this lawsuit does not relate directly to XRP, still, a positive outcome will have positive consequences for this coin and its founder, a Ripple company. Market reaction was immediate, bringing XRP 100% higher, adding $ 33B to its market capitalization. Aside from this event, BTC was generally the coin which gained the most in nominal terms during the week. Total BTC market capitalization was increased by $202B or 12.7% on a weekly basis. On the other side ETH remained relatively flat during the week, with a modest loss of $2.2B of its market cap. A Elon Musk related coin - DOGE, continued with strong gains second week in a row, adding a new $13.6B to its market cap, increasing it by an additional 33.6%. This week Cardano was also among significant gainers, with an market cap increase of $6.2B or 30.4%. Solana was also on the list of gainers, however, its weekly gain was relatively modest compared to other coins, with a surge of $2.1B in the market cap, or 2.1%. Stablecoin Tether also had a good week, as it increased the number of coins on the market by 3.36% w/w, adding $4.14B to its total market cap.
Polygon was one of rare coins which actually lost in value during the previous week. The coin dropped by 4.23%, but at the same time decreased the number of circulating coins by 9.3% w/w. Maker and Stellar increased its number of coins on the market by 0.3%, while Filecoin and Polkadot added 0.2% new coins, each.
Crypto futures market
During the last two weeks the crypto market spotted the most attention from investors, while the crypto futures market followed, with some quite interesting developments during the previous week. In line with the spot market, both BTC and ETH futures gained during the week for all maturities. BTC futures were traded higher by some 19% on average, where December 2024 ended the week at price $93.130. Still, the major development was with BTC futures maturing in December 2025 which finished the week at the level of $101.175. This is the first time in the history of the crypto futures market that BTC passed the level of $100K. Certainly, investors are more than convinced that BTC has a bright future.
ETH futures were traded some 4.5% higher on average for all maturities. December 2024 ended the week at the level of $3.129, while futures maturing in December 2025 closed the week at $3.367. These developments are also marking some positive sentiment among investors, considering that ETH futures finally managed to pass the level of $3K for one more time.

Why the capitalization will be 7 Billion? We have 1 yearWhy will the RWA sector continue to grow?
In the chart, I have shown that each cycle is dominated by different narratives that do not repeat themselves.
2016-2017: Ethereum, Altcoins and ICOs
2020-2021: Alt-L1s, DeFi, GameFi, NFTs
2024-2025: Memes, AI, RWA If we break down any cycle, we can see pre-pump, pump, and mega-pump. Example of a popular project in 2016-2017 XEM (NEM)
Pre-pump
Pump
Mega Pump
Of course, you can say it's 2015-2018, and there is no such thing on the market, but you are wrong.
2020 -2021 KLAY
Pre-pump
Pump
Mega-pump
What we see now in RWA is the most promising sector in the cryptocurrency market - at the intersection of two industries, blockchain and the financial market. Example of several top RWA projects
POLYX
LTO
GFI
RIO
CFG
TOKEN
DUSK
ONDO
OM
MPL
PRCL
More RWA projects will be released in the coming months.
Now RWA's capitalization is 7 BLN USD in memes 46 BLN USD. Most on-chain analysts are now looking at meme tokens that have already made considerable gains in the previous bull run, but RWA is done to track on-chain tokenized stocks. The crowd can't win in this market. It's mathematically impossible. The crowd must talk about technology - L2 solutions and so on. It's the crowd's responsibility to crowd-source this stuff into people's minds - You can't be the crowd or be like everyone else. That's why I'm looking towards RWA; that's where the big money is, and it reminds me of cryptocurrencies in 2015.
If you want more posts, like it!
Best regards EXCAVO

Crypto Market Cap Potential 4 Trillion soonThe cryptocurrency market has experienced significant highs and lows over time. The total market capitalization reached an all-time high of $3.2 trillion on November 14, 2024, with Bitcoin peaking at $93,480 and Ethereum previously hitting its record of $4,891.70 in November 2021. However, the market has seen downturns, with the market cap falling below $1 trillion in early 2023. Bitcoin dropped to $15,600 in November 2022, and Ethereum hit a low of around $1,000 in June 2022. Prior to the latest peaks, the market cap reached $3 trillion in November 2021, with Bitcoin at $68,000 and Ethereum at $4,300. These trends emphasize the market’s volatility and rapid shifts in valuation over short periods.

Road to 100k BTCResistance at 3T is broken and retest during business hours will push to the higher side and with few good news we can see 100k expecting this coming week.

Golden Cross having immediate bullish impact in parabolic cycle The next couple charts I post will simply be to lllustrate how the golden cross (orange line crossing above the blue line) immediately resulted in a very pivotal bullish pump that coincided with a major fulcrum point on the chart recently on multiple different charts. More times than not in the other market cycles, when a golden cross occurs it usually takes a few weeks afterwards to know whether that cross will have its desired outcome or instead end up being a fakeout but lately I’ve noticed multiple charts have seen an instantaneous pump on the exact day of the golden cross, which is making me think that once we enter the 2nd parabolic phase of a bull market that that is when you can anticipate a golden cross to have its immediate intended effect its suppose to have with much much higher probability than all the other market phases including even the 1st half of the bull market. Anyways I wanted to illustrate that hypothesis here with the Total chart as you can clearly see it’s a text book example, and I will try to also include another example where this occurred either in a follow up chart post or below if I can figure out how to get tradingview to let me post images of other charts below without making an entire new post for it. One major reason I want to illustrate this is because within the next 1-2 daily candle closes the Total2 (aka altcoin market) chart is going to have its golden cross and it is currently trying to confirm the breakout upward from a cp and handle pattern which is a huge fulcrum point for it. SO should the trend of instantaneous golden cross pump effects occurring the same daily candle as the cross itself, this could clue us into exactly when the real full on alt season will be about to kick off (which if correct, wll ignited by a BG pump within the next 1-3 daily candles). I will link the impending total2 golden cross chart below for you to reference and keep a eye on. *not financial advice*

Crypto Bull Run: Are We Poised for a Q4 Surge?The crypto market has been on a roller coaster ride throughout 2024. While there have been significant ups and downs, there's a growing sentiment that we might be on the cusp of a major bull run.
Optimism for New Highs
Many analysts and investors are increasingly optimistic about the potential for new all-time highs in the crypto market this year. Factors such as growing institutional adoption, increasing regulatory clarity, and technological advancements are contributing to this bullish outlook.
Accumulating Alts: A Strategic Move
To capitalize on a potential bull run, consider focusing on accumulating promising altcoins. While Bitcoin and Ethereum often lead the market, altcoins can offer significant growth opportunities. Research and due diligence are crucial to identify altcoins with strong fundamentals and potential for substantial returns.
Holding for Long-Term Gains
The key to maximizing profits in the crypto market is often holding your investments for the long term. Short-term volatility can be challenging, but staying patient and focused on the long-term potential can yield substantial rewards.
Are you ready to ride the wave of a potential crypto bull run? Start accumulating promising altcoins and hold them for the long term. With the right strategy, you could be positioned for significant gains.

Price action on the TOTAL chart now comfortably above the c&h Price action is now knocking on the door of 3 trillion for the total crypto market cap. We can see also that now that price action is reasonably above the rimline of this massive cup and handle pattern, and has also closed a weekly candle above it now as well, that we are likely to soon validate the breakout of this pattern and star climbing towards its breakout target of 4.6 trillion. I think Brad Garlinghouse was anticipating the total market cap nearing 5 trillion by end of 2024 and that target is not that far off. I will link some previous total market cap charts below so you can see other macro patterns we are also heading towards with an even higher target than this cup and handle. *Not financial advice*

Happy Rabbit New Year!- Welcome back to 1T Crypto Market Cap.
- Happy Lunar New Year of the Rabbit to everyone !
Happy Tr4Ding !

Fasten your seatbelt to 10T$- Everything is in Graphic and simple ( bubbles and fibo ).
- Upper trendline from 2018.
- This double TOP in 2021 irritates abit but it won't change the future.
- how we go and when we go... i don't know.
- Cryptos are volatile and super fast.
- Where we go... i know.
- Around 10T$ MC.
- if u want to know why CRYPTOS are super fast, i have an easy answer :
- The new generation prefers watch a 30 seconds TikTok Video rather than Youtube 30 Minuts video ! ( think about it and compare to finance ).
- What i bet for the TOP of next bull run ?
- BTC around 4.5T$ MC. (45%MC)
- Altcoins around 5.5T$ MC. (55%MC)
Hodl!
Happy Tr4Ding !

Reasonable Market Cycle PeakFeeling rather Bullish with current Price Action.
So long as we can spend a reasonable amount of time above the mid-line of the upward momentum channel, we should be good for another extended mark up phase/cycle.

Total Massive Pump or Massive Dump ? 🤔Hello Guys ❤️
Hope all of you are good.
As u see on my chart , Total is inside this stubborn channel for a long time , failed to break it out about 4 times in the last year.
Also we informed a pattern called Double top till now.
***Breaking out of this channel will be good for the market and we won't stop before achieving the target 1.60T but first we need to break the upper nick line at 1.26T
****if the double top pattern was correct and worked this will be very bad for BTC & the whole market and it will down at least to the lower nick line at 974B (The middle of the channel also) and if we broke it down will down to 690B or anywhere in the bottom of the channel.
Only take care and watch out this chart to know what will happen.
Next days will be very interesting to the market.
I hope for all of you big profits and happy life.
I am just sharing my thoughts with u.
It is not a financial idea and plz DYOR.

Crypto Total Market Cap targetsTotal I track since 2023. By my idea top of the market was in 2021 spring
I use my fib and mark green block zone for accumulation CRYPTOCAP:TOTAL
Now all money almost in BTC and we swept ath total.
Now is time to send it to two next levels, it's hard to say about timing but most likely top for btc and alt season will be spring - autumn 2025.
Around 5 Trillion conservative targets for capitalisation
Based on Trade on indicator you can track how it goes on W timeframe!
I use my custom indicator set for more factors in my analysis. April correction playing out good, same like summer 2022 bottom.
July and August we saw the buy back signals!
Hope you enjoyed the content I created, You can support with your likes and comments this idea so more people can watch!
✅Disclaimer: Please be aware of the risks involved in trading. This idea was made for educational purposes only not for financial Investment Purposes.
---
• Look at my ideas about interesting altcoins in the related section down below ↓
• For more ideas please hit "Like" and "Follow"!

TOTAL CRYPTO MARKET CAP BULLISHYup Its bullish as tattas. going to be watcching the show press play in 6 months from now and see what we see.

Why we are not going to 100k in BTC?It is because we are at 3T resistance once clear we can see 100k and we need some more good news to move forward. For now we just need to hold this important level.
ALT season will start when BTC dominance will drop to 50%.

Total market warningHello guys. Chart shown for you. As you see index touched ATH then rejected so far
I think market needs a break and correction.
Support Levels shown for you for better trading
Always DYOR

TOTAL crypto market cap VS Bitcoin dominanceIf history repeats itself, bitcoin dominance should decrease in the coming days and altcoins will outperform the king CRYPTOCAP:BTC
What do you think?

TOTAL - Short Term Top?The FOMO in the market is real, but looking at the charts this seems to be a place to see some "take profit" occurring. Total crypto marketcap is fighting the $3T level. If we can break above we can flip that into a new support level, but for now do not be surprised if we see a pullback from here.

TOTAL to 7 to 10TWith BINANCE:BTCUSDT at a new ATH of 90k it brings up the rest of the market and raises all boats.
We are still in November of 2024 right after the election. Lots of people remained sidelined and lots of capital is sidelined. Come next year all the investments that are up on the year that have been invested in equities and any other assets will get their appreciation reinvested at an alarming rate due to it being the beginning of the year.
I say that to say this: things could get very silly in crypto and a 7 to 10 trillion TOTAL crypto marketcap is a very real possibility in the next 1-2 years.
It is not a guarantee but the time to position into risk assets is now quite frankly. It was a better time to position in back during the summer but now we have a clearer vision we are headed down with the election behind us.
I wish anyone investing and trading a great end of the year and an even better next year.
Never get liquidated. Keep clicking.

TOTAL CRYPTO MARKETCAP HITS ATHThis is not an altcoin chart, per se, but it is very telling. This is the Total Marketcap of Crypto, including both Bitcoin and Ethereum. As you can see, this reached the all time high from the previous bull market, which was hit in November of 2021 - right around $3T.
We have not even STARTED this cycle yet (assuming we get one), and the entire market size is already equivalent to that peak. Imagine what happens when this breaks out…
Be patient, it is coming.