CRYPTO TOTAL MARKET CAP | Weekly Chart Analysis | Breakout in PrCRYPTO TOTAL MARKET CAP | Weekly Chart Analysis | Breakout in Progress
🔍 Let’s break down the crypto total market cap and highlight why the next move could be explosive.
⏳ Weekly Overview
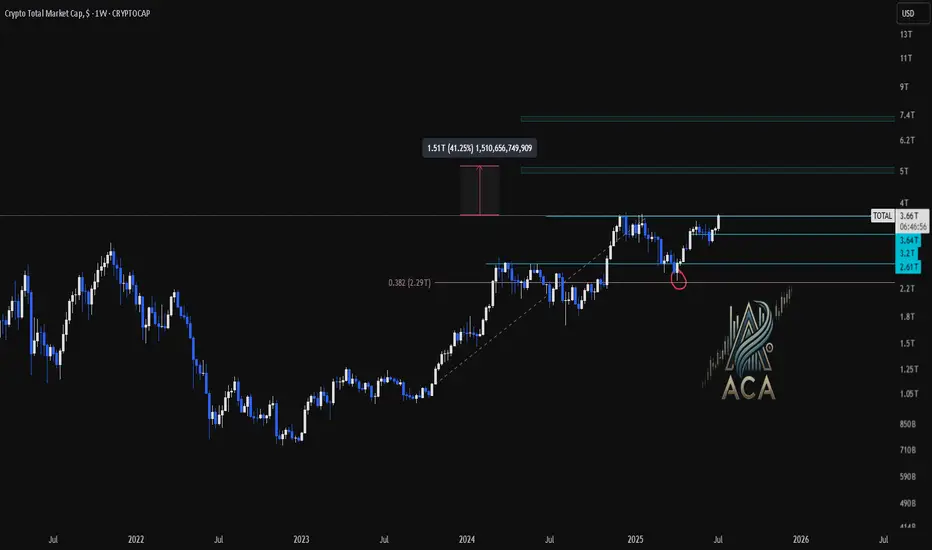
The weekly chart shows a strong breakout above the consolidation box, following a classic fakeout to the downside. The 0.382 Fibonacci retracement level at $2.29T provided solid support, confirming the bullish structure and setting the stage for this move.
🔺 Bullish Scenario:
- The market faked out below the box, trapping bears, and is now breaking out above resistance.
- The breakout targets align with the Fibonacci extension, projecting a move toward the $5T region.
- This $5T target is not only a psychological level but also matches the next major Fibonacci confluence, adding further conviction to the bullish outlook.
📊 Key Highlights:
- 0.382 Fibonacci retracement ($2.29T) held as support during the fakeout.
- Breakout above the box signals renewed momentum and a shift in market sentiment.
- Upside target around $5T is supported by both the measured move and Fibonacci extensions.
- Previous resistance levels at $3.27T and $3.54T now act as support zones.
🚨 Conclusion:
Crypto is breaking out after a textbook fakeout and reclaim of the range. With confluence from Fibonacci targets and strong momentum, the $5T region is now firmly in play as the next major target. Watch for sustained closes above $3.54T to confirm the move and open the door for further upside
TOTAL trade ideas
totalTrading volume must be high to break through the historical ceiling. There is currently a divergence in volume and oscillator. If the resistance breaks, it will grow well, but for now, the probability of a fall is higher.
TOTAL Consolidation in TriangleIt looks geometrically sound.
Price goes down. Stops at support. Consolidates for 2 months, then breaks out up (hopefully).
Let's see.

[CRYPTO] - Last Pump of the BULL CYCLE is ComingWe can see a highly organised bull cycle , with each multi-month consolidation wedge followed by a major leg upward, ending in breakout and continuation.
At the moment the CRYPTOCAP:TOTAL is breaking through the descending resistance again and ready to break thorough the 0.786 Fibo level as well - clear sign of the new up-rally beginning. Prior patterns (Q3 2023 and Q2 2024) led to vertical rallies , and the current structure suggests another leg may target the $6T+ zone in coming quarters.
What makes this different from past cycles is the underlying strength in Ethereum and other Altcoins. CRYPTOCAP:BTC.D has started to roll off highs, while projects like CRYPTOCAP:SOL , CRYPTOCAP:SUI and AI-related chains ( NYSE:FET , GETTEX:TAO , EURONEXT:RNDR ) are gaining TVL and developer traction. This is not just retail speculation—institutional capital is increasingly driving flows.
Moreover , Bitcoin ETF keeps getting huge daily inflows, the narrative of Coinbase including in S&P500 and Stablecoins velocity rising helps in spreading the crypto narrative between insituational & retail investors.
You can read more about why I expect a ton of money to inflow crypto in the next 6 - 12 months in one of the previous ideas: Again/
Overall , the chart structure, macro catalysts, and expanding adoption point toward a potential parabolic leg into late 2025 or early 2026. As long as the market holds above $3.3T, the breakout is valid and bulls are in control. The target is $5.5T —and possibly higher.

Total Market Cap Weekly Chart: Ready to Explode?Hey traders! Let’s dive into this weekly TOTAL Crypto Market Cap chart. The headline says it all— Total Market Cap Is About to Explode , and we’re here to break it down!
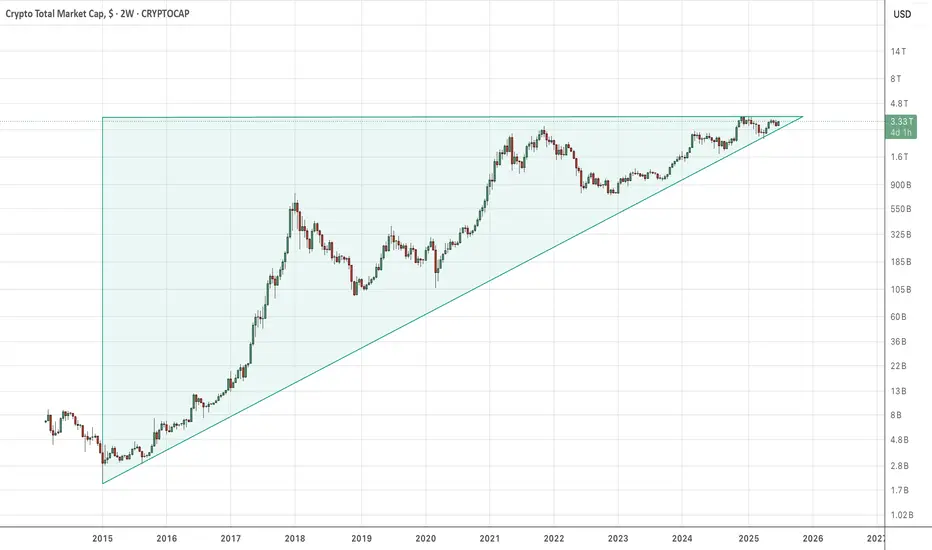
We’re seeing a massive expanding triangle formation, with the market cap currently at 3.21T , right at retest of triangle resistance. Historically, these patterns have led to parabolic moves — check out the 2019 - 2020 breakout! If history repeats, a breakout could send the market cap soaring toward 8.0T or even higher!
However, if the breakout fails, we might see a pullback to the previous level of support around 2T .
Key Levels to Watch:
Resistance: 3.66T (ATH)
Support: 2T
Breakout Target: 8.1T+
Breakdown Risk: 1.20T (latest strong resistance below 2.6T)
Is the market cap about to go parabolic, or are we in for a fakeout? Let’s hear your thoughts below!

TOTAL Q3 As Q2 closes, Q3 begins...
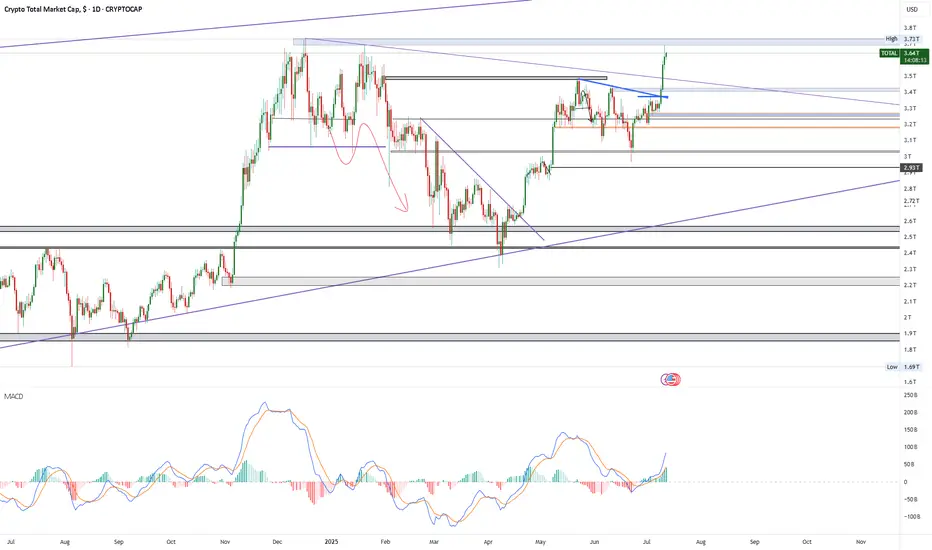
The 2nd quarter of 2025 made up for a lot of the losses of Q1 peaking at $3.5T in the middle of the quarter. Since the peak a steady downtrend channel has formed and continues to be the case going into Q3.
What can we expect to see in the next 3 months in the crypto market? For me there are two different scenarios that are bullish, and one that is bearish IMO:
Bullish scenario 1 - The most likely scenario I think is a breakout above the downtrend channel and a move towards the range top. My reasoning for this comes from what we know about the driving forces in the market. Just last week BTC ETFs had a $2.2B net inflow, MSTR bought another 4,980BTC for $531.9m, various ETFs on the way for other majors such as SOL. Crucially the M2 money supply is at a record ATH. What that means is huge demand and the means to purchase with a what feels like a deadline closing in.
Bullish scenario 2 - We see a trend continuation until the range midpoint which has provided support before. It would coincide with the bottom of the trend channel and therefor I believe would provide a good launchpad for long positions.
Bearish scenario - For me this is the least likely situation but one that must be prepared for, a loss of the range midpoint would be a major setback, one that would mean a potential revisit of the range low in a symmetrical move down mirroring Q2s move up. The reason I believe this is the least likely is there is just too much in favor of risk on assets like crypto currently, I've mentioned the fuel that is the M2 money supply piling up to be deployed. A US interest rate cut all but confirmed for September and the institutional race for acquiring these assets before it is too late.
In conclusion just keeping it simple on the chart, a breakout above the trend channel is a great long opportunity to target the highs.
If BTC continues the grind down a great place for it to turn bullish is the range midpoint as has happened previously.
In the event BTC loses the midpoint a retest of the weekly low would make sense to me.

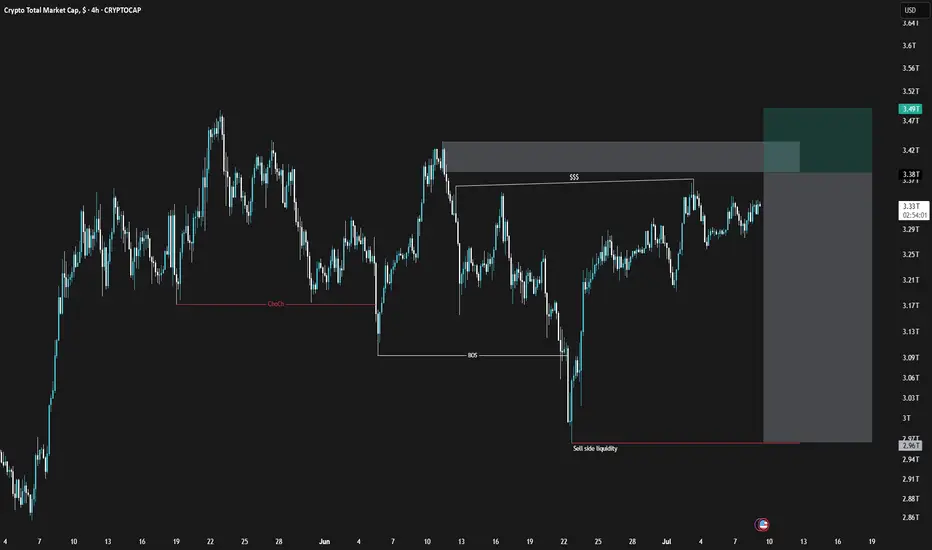
TOTAL SELL SIGNAL 25/Jul/9The TOTAL chart has shown a structural change in the 4-hour timeframe, indicating weakness in the bullish trend. Don't rush into buying and avoid falling into FOMO.
⚠️ This Analysis will be updated ...
👤 Sadegh Ahmadi: GPTradersHub
📅 2025.Jul.9
⚠️(DYOR)
❤️ If you apperciate my work , Please like and comment , It Keeps me motivated to do better
MARKETS week ahead: July 6 – 12Last week in the news
The US jobs data posted during the previous week shaped investors sentiment. The jobs market seems resilient, making market participants diminish any expectations that the Fed might cut interest rates at July's FOMC meeting. In this sense, the 10Y Treasury yields adjusted from level of 4,2% to close the week at 4,33%. On the opposite side, strong jobs figures pushed the S&P 500 to reach all time highest levels for the last five days, closing the week at the level of 6.279. Weakening of the US Dollar supported the price of gold to end the week higher, at the level of $3.333. The crypto market had a volatile week, with BTC reaching the level of $110K, still, ending it at levels above the $108K.
This week was marked with US jobs data, exposing its further resilience. The JOLTs job openings ended May at 7.769M, which was higher from market anticipation of 7,3M. The posted unemployment rate for June was standing at 4,1%, slightly lower from 4,2% posted for the previous month. The data which mostly impacted market sentiment were related to the Non-farm Payrolls for June, with 147K new jobs. It was higher from the market estimate of 110K for the same period. A strong jobs market made an impact on investors to rethink the potential Fed's rate cut at July's FOMC meeting. Current expectations for September's rate cut were increased.
Trump's “big, beautiful bill”, proposing significant tax cuts, passed the U.S. Senate during the previous week, and is now back in the House for final approval. Analysts are still concerned regarding its effects on the US level of debt in the next 10 years period, currently estimating further broadening of the US debt by $3,7 trillion.
Although the last two weeks passed with increased optimism on US equity markets, still both analysts and investors are closely watching developments with trade tariffs deals by the US Administration. Last week, the US made a deal with Vietnam of 20% tariffs for imports from Vietnam, while the US goods will be tariff-free. However, the next week will be important from the perspective of the end of a 90-days delayed tariffs period, which the US Administration left for the majority of countries around the world, leaving them the space for negotiations. Talks with major US trade partners are still ongoing, including China, European Union, Japan and India.
News is reporting that the ECB will most likely wait for the September meeting to further cut interest rates on Euro. The reason for such expectations are mentioned uncertainties regarding the trade agreement with the US Administration. Economists are also noting this year`s surge of Euro against US Dollar of 14%, which might add an additional burden on the EU economy in addition to trade tariffs.
CRYPTO MARKET
Another volatile week on the crypto market passed. The positive market sentiment was under influence of better than expected US jobs data posted for June. The BTC reached the level of $110K on Wednesday, but still, ending the week lower. Majority of other cons peaked during the week, but are still ending the week lower. On a weekly basis, there has been almost an equal number of gainers and losers among crypto coins. Total market capitalization gained 1% for the week, adding $24B to its total cap. Daily trading volumes remained relatively flat during the week, moving around $153B on a daily basis. Total crypto market capitalization from the beginning of this year currently stands at 2%, with a total funds inflow of $50B.
The largest coin was moving the market during the previous week. BTC closed the week by 0,7% higher on a weekly basis, adding $15B to its total cap. This week ETH also managed to close it 2,7% higher, increasing its market cap by $7,9B. Market favourite Solana had a significant surge during the week, till the level of $159, however, it is ending the week above the $146, marking the weekly loss of 2,9%, or $2,3B outflow of funds. DOGE had a similar movement, but ending the week with a modest loss of 0,5%. ADA managed to sustain its weekly gains, ending it at 1,8% higher. Uniswap had a drop in value of 2,7% while Maker lost almost 5% in value.
Although market prices of crypto coins had a relatively volatile week, still when it comes to circulating coins, the situation was much calmer. Stellar had the highest weekly decrease of the number of coins on the market , of 1%. Such withdrawals are not frequent with this coin. Filecoin traditionally is increasing the number of coins on the market, with this week's increase of 0,3%.
Crypto futures market
Crypto futures also reacted to a positive investor sentiment, where both BTC and ETH futures ended the week higher. BTC short term futures had a modest increase of some 0,7%, while the longer term ones closed the week higher by 2,6%. Futures maturing in December this year ended the week at the level of $113.750, and those maturing a year later were last traded at $120.395.
Similar development was also with ETH futures, where short term ones closed the week by 2,9% higher, and longer term ones surged by more than 7% on a weekly basis. ETH futures maturing in December 2025 were last traded at $2.689. Futures maturing in December 2026 closed the week at $2.894.

TOTAL - Dominant Trend In QuestionThis days candle has 8 hours until close...
But notice that the long lower wicked candle has instantly been met with an upper wicked candle.
Prior to the current candle there was;
- A long 3 wave correction (May - June) with a very long lower wicked candle at the bottom (orange arrow)
then
- Another lower wicked candle as the first pull back of an uptrend (green arrow)...
In any other market, this is a very bullish look and you might expect simple bullish candles without whipsaw to follow and print a nice clean uptrend.
But the Crypto bots are much more elastic and so we see yet another bearish whipsaw (yellow arrow).
This doesn't mean that crypto can't recover to move on up.
But, I would suggest that it does bring into question where is the dominant trend direction....
Because if this candle closes like this or lower, then it is an invalidation of the short term uptrend at the retracement Golden Window.
With that in mind, its not at all impossible that this whole uptrend (orange arrow) is/was a Dead Cat Bounce (lower high leading to lower low).
The week candle close will also be significant.
In my own trading I have taken profit in my lower time frame altcoin portfolio and I am now in stablecoin.
In high time frame portfolio I own a select few of the coins I think have strongest charts on the basis that - even if there is a market slump, I think they will be in profit down the road.
And for shorts, I am only short COIN currently but I may add more and perhaps also short another Bitcoin treasury - MSTR / MARA 👍.
This analysis is shared for educational purposes only and does not constitute financial advice. Please conduct your own research before making any trading decisions.

crypto total capknowing the total cap gives you a signal of direction of liquid and bitcoin is a major diver in the market cap.

BEARISH DOM + BULLISH CAP = ALT SEASONsimple TA analysis with simple arithmetic operation :
decline of bitcoin Dominance with the rise of market capitale = the season of altcoins and price explosions.
the year 2025 will be profitable, enjoy the summer
CRYPTOCAP:BTC.D CRYPTOCAP:TOTAL BINANCE:BTCUSDT INDEX:BTCUSD BITFINEX:BTCUSD COINBASE:BTCUSD

Crypto Tide Rising: Will TOTAL Market Cap surf past $5T?In November 2024 the crypto ocean was calm, hovering near $2.25T . Then, in a short time, fresh capital poured in, daily volume spiked, and the tide lifted us to $3.65T by mid-December .
Two bullish buoys popped up:
▶️ The daily down-trend snapped on Nov 4th, triggering a 51 % climb;
▶️ The 50-day MA (orange) crossed above the 200-day MA (white) on Nov 7th, after a 64 % rally.
Fast-forward to June 4th 2025 . Another Golden Cross has just flashed, and price is again nudging that descending trend-line. If History rhymes: the line breaks and momentum matches 2024’s move, the TOTAL MC could vault toward $5T .
Keeping today’s dominance ratios, that target implies roughly $162 k BTC and $3.8 k ETH . Add rising Global M2 and stablecoin liquidity, a supportive macro backdrop, and we may be staring at the next great crypto swell.
Will the market catch this wave or will macro headwinds keep the tide in check?
Not financial advice. DYOR, Arrr!

Crypto Market Completes A Correction Within Bullish TrendGood morning Crypto traders! We got a nice bounce and recovery in the Crypto market along with stock market rally after US President Donald Trump announced that Iran and Israel had agreed to a ceasefire, calling the conflict “The 12-Day War.”. Crypto TOTAL market cap chart now shows that correction is completed, support is in place and bulls back, so more upside can be seen in upcoming days/weeks, just be aware of short-term intraday pullbacks.

Total Crypto MarketcapHi ladies.
Is it "diminishing log returns" or ascending triangle? We're going to find out soon. I think there are too many data pieces coming in that point to BTC $1M.
Miners like RIOT and MARA are touting reaching their "BTC Reserve" targets. What it means is Bitcoin is no longer for sale. The only theoretical limit to BTC price is amount of fiat in the system, because it's designed to absorb it all. But keep talking about diminishing log returns, because you sound foo-lish.
5 trillion market cap soon ALL trading ideas have entry point + stop loss + take profit + Risk level.
hello Traders, here is the full analysis for this pair, let me know in the comment section below if you have any questions, the entry will be taken only if all rules of the strategies will be satisfied. I suggest you keep this pair on your watchlist and see if the rules of your strategy are satisfied. Please also refer to the Important Risk Notice linked below.
Disclaimer

MARKETS week ahead: June 30 – July 7 Last week in the news
The news regarding a deal settlement on trade tariffs between the U.S. and China, brought some relief on financial markets during the previous week. The most significant weekly gainer was the US equity market, where the S&P 500 reached a fresh, new all time highest level at 6.185. On the same grounds, the price of gold turned into a correction, with a weekly drop of 2%, reaching the level of $3.273. A further easing of inflation in the U.S. impacted 10Y Treasury yields to ease down to the level of 4,27%. The crypto market managed to sustain upper grounds during the week, with BTC holding above the $107K.
The information which occupied the market's attention during the previous week, was that the US Administration and China managed to settle a trade tariffs deal. Although the details of a deal have not been publicly disclosed, still, the market reacted in a positive manner, bringing the US equity market to higher grounds. The posted macro data showed further ease in the US inflation. Fed's favourite inflation gauge, the PCE index reached 0,1% in May, bringing it to the level of 2,3% on a yearly basis. The core PCE remains elevated, with 0,2% in May and 2,7% for the year. Still, all figures were in the line with market expectations, increasing odds that the Fed might cut interest rates in September.
Weekly tariffs news include the discontinuation of trade negotiations with Canada. As the U.S. President posted on social media, the termination of negotiation is immediate, and the US will decide on the level of tariffs within the next five days. Such a decision came after Canada decided to impose a digital services tax on US tech companies.
CNBC is reporting that Coinbase is the best performing stock in June, with a surge of 43% only during this month. As the reason for such a strong price movement analysts are noting several combined reasons, like its inclusion into S&P 500 index, the GENIUS Act which was passed in the Senate and a strong performance of Circle.
Fed Chair Powell was for one more time a topic of the US President answering the journalists questions. The US President commented that he will put as the head of the Fed anyone who will support the rate cuts. He also noted that there are several candidates for this place, not explicitly mentioning names.
There has been a discussion among analysts whether stablecoins represent a threat to payment card business, concretely to Visa and Mastercard. The one alternative for these companies to sustain the market game is to issue their own stable coins which could function on a prepaid basis. However, a few services which are currently not provided by stablecoins, like buy now - pay later are still advantageous to card issuers.
CRYPTO MARKET
It was a week of ups and downs on the crypto market, however, the week ended in a positive territory. The US-China deal on trade tariffs brought some relaxation among investors, which was also reflected in a crypto market. Total crypto market capitalization gained 4% during the week, where major crypto coins are participating with 70% in total funds inflow of $130B. Daily trading volumes were slightly decreased to the level of $146B on a daily basis from $187B traded a week before. Total crypto market capitalization from the beginning of this year currently stands at 1%, with a total funds inflow of $26B.
The major coins on the market were the ones which mostly supported an increase in a weekly capitalization of the crypto market. BTC managed to add $87B to its market cap, increasing it by more than 4% on a weekly basis. Second place took Solana this week, with an inflow of $7,2B, where its market cap surged by almost 10%. XRP had a strong funds inflow of $5,8B, or 4,7%, while ETH collected $5B which was an increase of 1,8% for this coin. BNB was moving within a modest territory, with a weekly surge of 2% adding almost $2B to its market cap.
It was an active week also when it comes to coins in circulation. This week both Solana and Polkadot had an increase of the number of coins on the market of 0,6%. At the same time IOTA increased its number of coins by 0,8%. Although it is a stablecoin, it is worth mentioning that Tether is continuously increasing the number of its coins, which surged by 1% last week. This could be treated as an indicator of increasing popularity of stablecoins during the recent period.
Crypto futures market
The crypto futures market ended the week in alignment with the spot market developments. BTC futures were closed above 3% higher from the end of the previous week. Futures maturing in December this year were closed at $110.680, and those maturing a year later were last traded at $117.270. On a positive side is that the long term futures are slowly nearing the historically highest level of $124K reached in January this year.
ETH futures were traded relatively flat compared to the week before. Futures maturing in December 2025 closed the week at $2.514, and those maturing in December 2026 achieved the last price at $2.703.

Inverse head and shoulders pattern Total Chart I have no idea why my whole chart isn't showing! Lol. I'm trying to publish this using the app. I'll try again.

Inverse head and shoulders pattern forming on the Total Chart!This is the full chart from my previous published idea. Lol

Inverse head and shoulders pattern forming on the Total Chart.There's either an inverse head and shoulders pattern forming on the Total chart or it's a cup & handle pattern. Either way they are both extremely bullish and roughly have the same price target!
What are your thoughts? Please tell me in the comments and thank you for looking at my chart! 😊

One Last Push Before It’s Over?Total Market Cap CRYPTOCAP:TOTAL CRYPTOCAP:TOTALES
From a price action perspective, the structure looks very constructive:
• In May 2021, a swing high was formed, which later became a key resistance level.
• In November 2021, we saw a fakeout, confirming the significance of the level.
• Between March and June 2024, there was a clear rejection from this resistance.
• Eventually, price broke through the level and completed a clean retest from above — textbook move.
The bullish structure remains intact and has been reaffirmed once again. With that in mind, a new ATH on Total Market Cap feels like just a matter of time. The 3.73T+ level is likely to be taken out soon.
From a volume distribution perspective, the market is currently trading near the upper VWAP band — between +1σ and +2σ, yet shows no signs of overheating. Historically, the extreme zone is marked by +3σ, which currently sits around $4.6 trillion.
Wave Structure
The impulsive wave that began in 2022 appears to be nearing its completion. Given the price action and internal structure, it is highly likely that the final fifth wave is forming as an ending diagonal.
The $4.6–5 trillion zone stands out as a potential market top.
Volume behavior is key here:
We’re seeing notable vertical volume spikes in the current phase.
Horizontal volume (volume profile) reveals a strong cluster and point of control (POC) — a clear sign of distribution.
This pattern often signals the final stage of a bull cycle and precedes a reversal. The question is when, not if.
That said, the trend remains bullish for now. Notably, we don't yet observe strong RSI divergences on major timeframes, which supports the case for a continued push higher in the short term.

Really quick TOTALS charts - possible WARNINGS
It is Very clear when you look at these 4 charts
TOTAL - TOTAL2
TOTAL 3 _ OTHERS
The Top Left chart is the TOTAL chart and is the only one that includes BITCOIN and it is the ONLY one that is above all of its MA's
All of the other charts are heading into resistance on one or more MA's
ALT coins are sailing in to headwinds.
THIS DOES NOT MEAN THEY WILL GET REJECTEWD BUT IT OOES MEAN YOU SHOULD BE CAUTIOUS
Simple as that

Total marketcapTesting/tracking elliotwave. Not financial advice.
If my prediction is right, we are skipping the 2 year bull/2 year bear cycle this time around.
Wave 3 is the longest wave of the Elliot wave cycle. And I believe we are in that wave 3 cycle now. It would align with us skipping the bear cycle to create this longest wave cycle. We will continue to go up until the next halving. People are going to front run the halving. I expect us to peak 1-2 months before the actual halving date.
We will then enter the bear market. Expect this phase to last 1-2 years. CRYPTOCAP:TOTAL COINBASE:BTCUSD

Total3 and Total Bearish momentumWhile stocks are pumping it could goes like this- But with the potential stock pressure if stocks will crash, we could go much lower
Honestly- I Can't be really bullish
Even Total market cap is showing also Bearish momentum so ...
Follow me for more our community ideas and trades.
