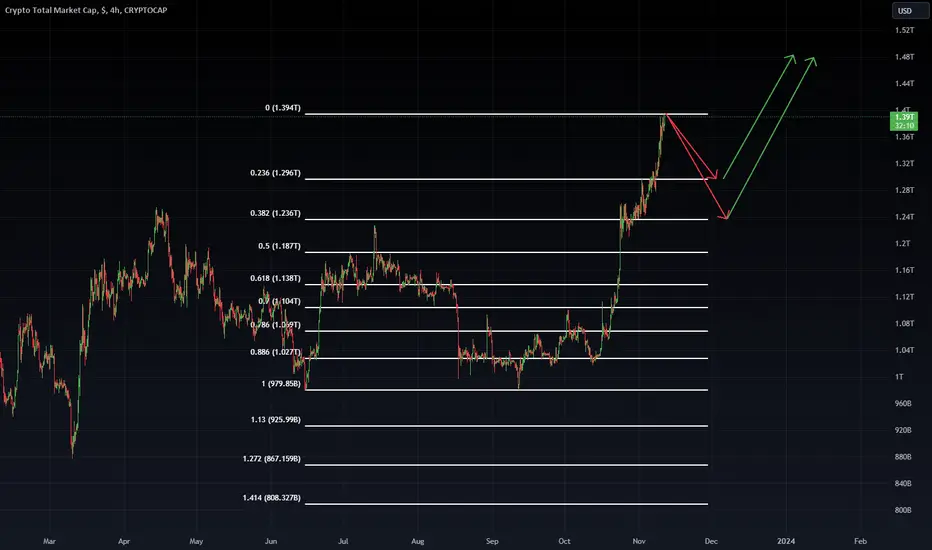
TOTAL 1 Will Crypto Christmas come early?I was thinking to wait till tomorrow till I post this analysis so more people could see it but oh well, let us do it today cause you never know what happens.
I think this is one of the most important charts when following crypto markets. (cause it shows crypto markets money inflows and outflows).
Bitcoin has broken out already from this years highs week ago (I'll add picture down), BUT Total 1 marketcap hasn't made higher highs yet.
If and when this breaks I believe we will see surge on BTC and possibly on alts that will wake up the bull narrative again. (News etc)
Target is 1.49 Trillion so that would be 250 Billion inflows to crypto markets, that's 20% rise!
Better to be prepared than get caught with pants down
Two active trades going on DYDX and GOLD
-PalenTrade
TOTAL trade ideas

MARKETS week ahead: December 11 – 17Last week in the news
The strong resilience of the US economy continues to support market optimism, after the latest posted US jobs data for November. The USD gained during the week as well as both US and EU equities. While Gold is trying to get back into correlation with USD, US Treasury yields continued with a decline. The crypto market continues to be supported by both the resilience of the US economy and the BTC ETF frenzy, with Bitcoin reaching new highs for this year, below $45K.
The US non-farm payrolls rose by 199K in November, modestly better from market forecast. At the same time, the unemployment rate fell down to 3.7%, from 3.9% posted for October. The job market continues to be resilient to macroeconomic developments. November figures came as a surprise to analysts, but eventually some of them call it a “relief” as it shows that despite strong rate increases during the past year, the US economy managed to sustain jobs and businesses.
The European Union is aiming to regulate AI technology and products like ChatGPT. There has been a lot of discussion during the previous months, related to data privacy on platforms like ChatGPT or biometric models. At the same time, Italy, France and Germany are opposing tight regulating rules, especially for foundation models, stressing the concern that it might impact their competitiveness with the Chinese and the US tech industry.
The Binance exchanger has withdrawn their license for the investment license in Abu Dhabi. The company has noted that such a move is not related to recent legal settlements with US regulators, but they find it “unnecessary for the company’s global needs”.
A global regulator of the financial industry, the Basel Committee, is looking at risks that stablecoins pose for financial security, aiming to bring up regulations which will decrease identified risks. This regulation should address bank`s exposures to the crypto industry and mitigate potential risks of defaults like recently Silvergate Bank and Silicon Valley Bank.
El Salvador, the first state that made Bitcoin a legal tender, is going further with its state experiment with crypto currencies. The recently started project called “Freedom VISA” aims to attract 1.000 people on a yearly basis, which will gain El Salvador long-term residency permit, based on a minimum $1 million investment worth of bitcoin or USDT stablecoin. The country is estimated to receive at least $1 billion of cash inflow every year through this program.
Crypto market cap
The positive mood on financial markets continued through December, promising a very happy forthcoming New Year holidays. The latest published jobs figures for November this year supported further market optimism over the resilience of the US economy. Both EU and US stock markets reacted in a positive manner, boosting also further the crypto market, which is in addition, still moving within a sentiment over its further adoption by the mainstream. Analysts and investors are currently moving away from the US Fed rhetoric and pricing their view on the course of the economy in the future period. Total crypto market capitalization was increased by significant $179B, with an increase of 12.6% on a weekly basis. Daily trading volumes have also significantly increased to the level of $121B on a daily basis, which is a further boost from $ 67B traded the week before. Total crypto market capitalization increase since the beginning of this year currently stands at 112%, where it has added a total $840B to the market cap.
Total crypto market significantly gained during the previous week, with the majority of coins finishing the week in green. In nominal terms, Bitcoin was once again star of the week, adding 13.8% to its market cap, or almost $105B. The second place belongs to Ether, with a surge in value of 12.6%, adding $ 32B to its market cap on a weekly basis. As a significant gainer should be mentioned Cardano (ADA) with a surge in value of $8.2B or 60.2%. This was a reflection of Cardano`s Robinhood listing in the EU. Solana was also in the spotlight of the market with a gain of $6.3B in market cap or more than 24%, which was supported by the successful network upgrade. DOGE gained $2.5B, increasing its cap by 21%, BNB also gained $ 2B which surged its value by 6%. Polkadot was also a $ 2B gainer of the week, adding more than 24% to its value. Majority of other altcoins gained significantly during the week, where especially should be mentioned Algorand, with an incredible surge in cap by 52.5%. There is still no official news what exactly was standing behind such a move.
Activity in circulating coins remains relatively high during the last couple of weeks. The highest changes during the week were with Tether, which added 0.9% of new tokens, Stellar increased the number of circulating coins by 0.4%, while Filecoin traditionally continued with a surge in coins on the market, adding 0.6% during the previous week. The only negative change was with Polkadot, which decreased its coins by 3.7% on a weekly basis.
Crypto futures market
In line with the spot market, the crypto futures market made its significant move during the previous week. This market is also providing some important inputs over the sentiment of investors on the crypto market.
BTC both short and long term futures were higher by more than 14% on a weekly basis. Futures maturing in December this year reached the last price of $45.030. At the same time those maturing in December 2024 reached the price of $49.040, which is the first time within the last year that those futures finished the week around the level close to $50K resistance. Still, it should be noted that prices of futures maturing in March 2025 reached $47.760, which is a bit lower from December 2024.
Similar situation was with ETH futures. Short term ones were traded higher by around 11% on average. December 2023 ended the week at a price of $2.397, while December 2024 was last traded at $2.490. It should be also noted that March 2025 ended the week at $2.525 indicating current investors positive sentiment regarding future ETH price.

Bearish divergence This is likely to break down around the 17 December a historical break day when everyone goes on Christmas holidays an takes profit to buy presents very likely the overheated crypto space will correct before the halving at some piont between now an the halving around April not a problem for long term investors but for the short term there is potential profit taking likely to line up with btc hitting 48k ,as someone who is bullish I cant see 50k in my minds eye this year

Total MCap- BULLISHWe are still looking looking bullish on the TMCap.
The ecosystem has been warmed up for the upcoming season.
Alts are waking up
Btc need some cooling ..

Crypto Total Market Capafter many weeks of up move crypto need a pull back there is a lot of untested LVL first major one comes around 1.154 this analysis gets invalid if total pushes above 1.33.

TOTAL MACRO ANALYSISTOTAL CRYPTO MARKET CAP;
-Has exploded since it entered into Ichimoku Cloud.
-Typically, we see prices reach the opposite side of the cloud.
-That area also lines up with the yellow neckline as resistance.
-I think we pump the remainder of the year for the most part.
-Could see a sell-off after the end of the year.
-I would think dips on the new year are for buying before the BTC halving
Please follow me here for more crypto analysis and a safer way to read charts to minimize risk.
**This idea is not financial advice, its just my 2 cents.
Thanks for your time!
~Cosmicbag

I'm still a bear!I noticed that we have reached the resistance of the upper boundary of the downtrend. I expect that from the current high we will begin our journey to new lows.
Regards,
Eugene

35 percent more market push bitcoin going to hit 57000 minimum35 percent more market push bitcoin going to hit 57000 minimum


total 1 target my target for total , is 1.8-2.2 , i have confidence that 2022 yearly open will be achieved at 2.2T . anytime between dec and feb2024 this target will be achieved imo .
this is not a financial advice
please follow me : www.tradingview.com
i am sharing my ideas there
thank you


🚨 Bye Bye Crypto! .... AGAIN 🚨Here is a list of all the ridiculous nonsense narrative that the the "pros" and media pump:
First they say: “Nobody knows what will happen”
Followed by the clown talk:
"Buy the dip" 🤡 🤡 🤡
"LFG"
"Santa rally" 🤡 🤡 🤡
"The tortoise and the hare"
"V-bottom recovery"
"Focus on the long term"
"It’s priced in" 🤡 🤡 🤡
"Stay invested" 🤡 🤡 🤡
"Transitory inflation" 🤡 🤡 🤡
"Tesla is the future" 🤡 🤡
"Bitcoin is the future " 🤡 🤡 🤡
"Elon is a genius" 🤡 🤡 🤡
"The ruble is strong" 🤡 🤡 🤡
"China opening back up"
"AI"
"GameStop" 🤡 🤡 🤡
"A little macro / a little micro"
"Smart money buys bonds"
"Tom Brady"
"Matt Damon"
"A little earnings play"
"This is why it’s important to watch earnings" - TV verbatim.

are we in a retracement rally?my current thesis is that its a retracement rally... once we hit my target ill be a bear... if it smashes through to the upside all my thoughts are invalid and back to the drawing board...

Crypto Marketcap Ascending Triangle -MicroStrategy huge purchaseFacts:
In last 30 mays, 26 875 BTC was mined.
In same period, MicroStrategy has purchased 16 130 BTC.
Purchased amount equates to 60.0% of total Bitcoins mined in given time period.
Price action:
On above chart we can see that supply is drying up, hence higher lows.
Also, while expecting higher prices, nobody is willing to buy higher, resulting in same highs.
This combinations forms an ascending triangle, which is usually a bullish pattern.
Conclusion:
While smart money is buying big, dumb money is waiting for the dip to outsmart the smart money. Everyone wants the price to go higher without buying higher.
Eventually, when supply is exhausted, shorts will be liquidated, and dumb money will end up buying higher.
Trend is your friend, until the end. Only then he is your enemy.

Market volume analysis
The market volume is also in the Ardar Block area
If it can reject the resistance I have already drawn and there are ahead of the analysis
Can act exactly like 2019 and 2020
Note that the market has increased by 718 percent over the years and has reached $ 3 trillion.
If you say it can also be a volume this time, I can estimate the market volume in 2024 - 2025 - 2026 years between $ 8 and $ 10 trillion.
You may be surprised now, but those who are more than 5 years old in the market are not surprised and can also get a volume

Crypto Total Marketcap, where is the local top?Crypto Total Marketcap pumped up to 1.55 Trillion, up about 50% since October.
Mentioned 1.6 trillion as first major resistance where i think CRYPTOCAP:BTC could stall and give some room for alts or just plunge down and drag them along.


Crypto TOTAL Market Cap is about to DUMPThis chart represents the total market cap of Cryptocurrencies. Bullish momentum in this chart means money is coming in cryptocurrencies and vice versa.
Currently, TOTAL is at Weekly Supply Zone and Forming Rising Wedge which is a Bearish Traditional Chart Pattern.
RSI is showing Bearish Divergence on H4 and Daily.
If it breaks the trendline support of Rising Wedge, I will be looking to Short on BTC and other alts with the mentioned targets.
Hit the boost button if you like my idea.

Crypto Total CapI think we're at the end of the road for a little while. We could see a swing from here to around 0.283. I will not look for Short, but I will keep my risk low when taking Long trades.
Market Cap SurgesThe Total Market Cap has successfully broken through a key resistance level that it had struggled with multiple times, signaling a positive upward momentum.
The market is currently on a strong upward trend.
After surpassing this resistance zone, it is expected to continue rising until it reaches the next significant supply area, around the 1.530 trillion dollar mark. At this point, we might see the market take a breather, potentially leading to a slight pullback in prices as part of a natural market correction.
This analysis is for informational purposes only and should not be considered as financial advice.


BULLS TIME IS SWEET BUT...The Total Crypto market cap hit 1.5T
The signs has always been there.
But i want to share this tips.
You are going to enjoy bulls but you will pay more to transact and this is why i am looking forward to all the L2/ZK/Op protocol hype and see how all of that benefits Defi/cross-chain transactions.
Will be on the look out for the best L2 solutions during this period!
2 things:-
* speed
* cost

MARKETS week ahead: December 4 – 10Last week in the news
December started in a positive tone on financial markets. Gold hit new yearly highs above $2K, in expectation of Fed's rate cut during the course of 2024, while US equities reached this year`s highs for one more time, on the same assumption. The crypto market is still under expectations of the approval of the first spot BTC ETF, where the price of BTC surged to the levels above the $38K.
Previous week started with sad news that one of the greatest investors and vice chairman of Berkshire Hathaway, Charlie Munger died just one month after his 100th birthday. His investment philosophy along with his partner, Warren Buffet, left the mark on generations of new investors on financial markets. During his long career, both Charlie and Warren managed to build the Berkshire empire, today worth $800 billion.
Released second estimate for the US GDP annualized growth rate of 5.2% for the third quarter of this year was a huge surprise for financial markets. This is perceived as the fastest growth of the US GDP since the year 2021. This has additionally heated investors’ confidence that the Fed might sooner than expected cut interest rates. On the other hand, Fed Chair Jerome Powell held a speech at Spelman College in Atlanta on Friday, where he for one more time noted that talks about rate cuts are premature and that the Fed is currently ready to tighten the policy further in case that it is necessary in order to return the inflation rate down to targeted 2%. For one more time within the latest cycle, the markets and the Fed are on the opposite side when it comes to expected monetary moves.
Expectations and preparations for the approval of the first spot BTC ETF are still in the spotlight of the crypto industry. Coindesk is reporting that a crypto asset manager Grayscale just hired John Hoffman, who formerly held a position as a Head of Americas investment department in Invesco company. His new role at Grayscale will include a leading position in the distribution and partnership team, in expectation that Grayscale`s filing for its spot BTC ETF will be approved by the SEC. The asset manager Invesco is one of the biggest issuers of ETFs in the US.
ARK Invest, an asset manager led by Cathie Wood continues to offload shares of Coinbase (COIN). As per reports, ARK Invest just made its third sale of COIN shares, with market value of around $4.7 million. Previously, ARK Invest sold another $15 million worth of shares during November this year. At the same time, COIN shares are currently traded at the highest level since April last year.
Crypto market cap
December started in a positive mood on the crypto market, but only at first sight. Namely, the frenzy over the potential first spot BTC ETF is still strong on the market, pushing this week BTC`s price to the levels above the $38K resistance line. Still when it comes to developments with other altcoins and especially futures market, some modest market exhaustion could be spotted. Market expectations on potential Fed's rate cut in May next year, is an additional aspect that should be taken into account. Namely, the market is currently pricing a potential cut, pushing the value of the US equities to the highest level for this year. On the other hand, Fed Chair Powell stressed for one more time that Fed is not thinking about rate cuts and that potential further increase is still on the table for FOMC members. Considering that markets pushed the prices of equities higher and dropped Treasury yields lower after his statements, shows that the market and the Fed are once again on a different side when the state of the economy and further moves in the monetary segment are in question. Who is right, the time will show. Total crypto market capitalization was increased by additional $23B or 1.6% during the previous week. The highest funds inflow into this market is coming from Bitcoin. Daily trading volumes decreased during the week, moving around $ 67B on a daily basis, from $ 81B traded a week before. This is the first sign of market exhaustion. Total crypto market capitalization increase since the beginning of this year currently stands at 89%, where it has added a total $670B to the market cap.
For one more week, Bitcoin was in the spotlight of the market, considering the on-going frenzy about the first BTC ETF. BTC gained $ 20B in market value which is an increase of 2.7% within one week. ETH gained modest $2.4B or less than 1% on a weekly basis. Other coins were traded in a mixed mode. One of the significant gainers on a weekly level was Solana, with an increase in the market cap of $1.44B or 5.8%. Miota should also be mentioned in relative terms, considering that this coin increased its market value by an incredible 77% within one week. This was a market reaction to IOTA`s $100 million Ecosystem DLT foundation in Abu Dhabi. Several other coins with solid weekly performance were LINK with an increase in market cap of 6.45% w/w, while DOGE added 7.2% to its cap. Majority of other coins had an increase between 2% up to 5%. There were almost equal numbers of coins which finished the week in red, like Filecoin, which decreased its market cap by 2.25%, Tron was down by more than 3%, BNB decreased its value by additional 2.7%.
There has been increased activity when it comes to circulating coins, where the highest drop on a weekly basis had Maker, with a drop of 6.1% of coins in circulation. Tron and Polkadot decreased their available coins by 0.1% both. On the other side were Miota, with an increase of 0.6% of coins, Solana had an increase of 0.2%, while Filecoin increased the number of coins on the market by 0.5%. There should be mentioned Tether, which added 0.9% coins during the previous week.
Crypto futures market
During the previous week the optimism from the spot market was not clearly reflected in the crypto derivatives market. This refers to ETH futures, which actually finished the week lower from the end of the previous week, although ETH gained almost 1% on the spot market for the week. Short term futures were traded 0.42% lower from the week before, where December this year finished the week at a price of $2.119. Longer term futures were down by 1.6% on average, where futures maturing in December 2024 ended the week at price $2.178 and March 2025 at $2.208. It represents a sort of exhaustion of investors for ETH at current levels, which are still not quite sure about the ETH`s potential for the future period.
At the same time, market exhaustion was reflected in the long term BTC futures. Namely, although the short term ones were traded higher by more than 2%, with December this year ending the week at price of $39.290, longer term futures were traded almost flat compared to the week before. Futures maturing in December 2024 are still holding modestly above $ 41K level.
