Something Like ThisI believe the charts are pointing towards the market gearing up for a play somewhat like this.
The timing may well be off, but the levels and sequence seem broadly predictable.
TOTAL trade ideas

Total Crypto MarketcapTotal looks like it's bouncing on $3T and the moving averages. What looks like a massive inverse head and shoulder in Bitcoin (off the top of the all-time, linear Fibonacci channel) - in Total it just looks like a retrace 3T. What Bitcoin does is having a greater weighting in the total as BTC.D reaches for a 95% "gap-close". Soon, only BTC will matter as shitcoins go through the woodchipper. BTC is always the only blockchain that mattered. The rest is fluff. Without the protocol, there is no crypto.
Current banks are pulling laughable tactics on the people. They do bail-ins. It may not have happened to you in your country, but they do it. Also, the printer go burr, and that's as sure as death and taxes.
The Stock-to-Flow model predicts a 10X in Bitcoin this year, in order to revert back to mean (the mean stock to flow curve), at the same time that BTC.D reacheth for 95%. These two events are not separately occurring. They occur together. Bitcoin Dominance rises as Bitcoin reaches for $1M, and the satoshi price rise is a self-fulfilling prophesy, as OTHERS.D crashes. OTHERS.D and BTC.D are just looking at two sides of the same coin, but it was telling for shitcoins when OTHERS.D lissed it's upside target by a mile. That was the beginning of the end for shitcoins, and they have only gone down in dominance since then, while the "total shitcoin marketcap" remained relatively flat. Now, we'll see shitcoins realy start to bleed off as BTC.D skyrockets to 95% and $1M.
Good luck out there

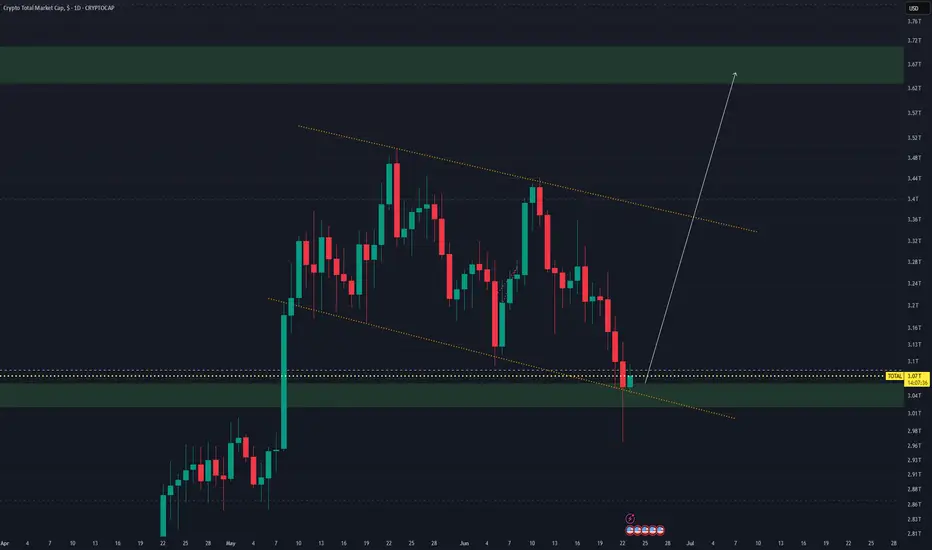
TOTAL : Bullish Breakout from Falling Channel at Key Demand ZoneThe current chart of TOTAL (total cryptocurrency market capitalization) presents a compelling bullish setup. Price action has formed a falling channel pattern, which is often a bullish continuation/reversal indicator when observed after a prior uptrend — as seen in the earlier impulsive rally.
At present, the market cap has reached a significant demand zone around $3.04T–$3.07T, aligning with both:
- A key horizontal support level (highlighted by the white dashed line), and
- The lower boundary of the descending channel (marked with orange trendlines).
Notably, there was a strong wick rejection to the downside, indicating buyer interest and defense of this support zone. The chart suggests that this area has acted as a springboard for accumulation, and may catalyze a reversal breakout.
The projected move is a rally toward the upper green resistance zone, which lies between $3.62T to $3.70T — a previously established supply zone. The clean and aggressive white arrow illustrates a bullish trajectory that could reflect the next major leg up, should this bounce materialize into a breakout above the channel.
This scenario is further supported by:
- Strong confluence of support levels.
- A complete and respected descending channel structure.
- Positive market sentiment re-entering at macro-cap levels.
Key Levels:
- Support Zone: $3.04T – $3.07T
- Resistance Zone (Target): $3.62T – $3.70T
- Pattern: Descending Channel (Bullish Reversal Potential)
- Risk: Breakdown below $3.00T would invalidate the setup.
If momentum continues as anticipated, this could mark the beginning of a new bullish expansion phase across the crypto market.
MARKETS week ahead: June 23 – 29Last week in the news
Geopolitical tensions, the FOMC meeting and inflation fears could be the summary of topics for the previous week. Markets are currently in a sort of limbo phase, not sure what direction to trade, considering high uncertainties which are surrounding financial markets. The S&P 500 tried to be positive at the beginning of the week, but ended it lower, at the level of 5.967. The US Dollar was traded in a mixed manner, but the price of gold took a bit of a relaxing trend, closing the week at the level of $3.371. The 10Y yields reacted to the Fed's narrative around interest rates and closed the week lower, at the level of 4,37%. The crypto market was also traded in a mixed manner, but more toward the downside, where BTC closed the week lower, at the level modestly above the $103K.
The main event of the previous week was the FOMC meeting. The Fed kept interest rates unchanged, as widely expected. The Fed stays on the course of two rate cuts during the course of this year. Once again it has been noted that “uncertainty about the economic outlook has diminished but remains elevated”. The uncertainty mostly relates to the effects of the implemented trade tariffs on the U.S. economy in the future period. Possibility of higher inflation is also noted. With that respect, the Fed will stay data-dependent when deciding over the future course of interest rates.
Based on official comments, it seems that the FOMC members are not united when it comes to the final decision regarding the cut of interest rates. During the previous week, Fed Governor Waller noted in an interview that the Fed might make the first rate cut in July, considering the current inflation level and jobs market. On the opposite side was San Francisco President Mary Daly, who stated that some more confidence is needed that the trade tariffs would not make a significant impact on inflation, before the next rate cut.
As news is reporting, Tesla has signed an agreement with China to build a grid-scale battery power plant in China. As noted, it is going to be the largest project in China that Tesla is going to conduct, with an estimated worth of $556M.
Coinbase announced that the company had secured a Markets in Crypto Assets or MiCA license from Luxembourg authorities, based on which it will be able to offer crypto services to clients in the EU. With this license, the company also noted that their central hub in the European Union will be in Luxembourg, instead of Ireland, as previously planned.
The Swiss National Bank cut rates by 25 bps to 0% during the previous week. The decision was made after the country was struggling to sustain the inflation growth, entering into deflation in May. The inflation in Switzerland peaked at 3,5% in August 2022, and since then is on a deflationary road.
CRYPTO MARKET
There have been a lot of topics for investors during the previous week, including geopolitics and macroeconomics, which left the crypto market a bit behind the traditional markets. Although during the first half of the week, crypto coins were traded in a mixed manner, still, the weekend brought some major pulls toward the weekly negative zone. Total crypto market capitalization dropped by 3% on a weekly level, dragging down $84B in the value of the market. At the same time, daily trading volumes remained relatively flat on a weekly basis, moving around $187B. Total crypto market capitalization currently stands at the negative territory of -3%, compared to the end of the previous year, with a total outflow of $104B.
For one more time BTC was pushing the total market cap to the downside, with an outflow of $38B, decreasing its value by 1,8% for the week. ETH was also traded in a negative territory, down by 4,8% on a weekly basis, with an outflow of $14,6B. The majority of other coins traded in red for the week, where DOGE was down by 10,1%, Cardano dropped by 9,1%, ZCash lost 9,8% in value. Market favorite coins had a relatively modest weekly drop as BNB ended the week by 1,3% lower and Solana was down by 3,2%. Only a few altcoins ended the week in shiny green, like Tron, which was higher my modest 1% or EOS with a plus of 1,7% for the week.
This week Solana managed to add new coins on the market, increasing its total number by 0,7%. Such a strong increase is not very frequent with Solana. On the other hand, a total surprise came from LINK, who added 3,2% of new coins to the market. Filecoin traditionally increases its circulating coins on a weekly basis, adding 0,2% new coins for this week.
Crypto futures market
The crypto futures market reflected developments from the spot market. Both BTC and ETH futures ended the week lower from the week before. BTC futures ended the week by 1,8% lower, while ETH futures were last traded around 4,5%.
BTC futures maturing in December this year reached the last price at $107.345, and those maturing a year later at $113.520. The good news is that BTC long term futures are still holding above the $100K level, exposing the investors anticipation regarding future potential of BTC.
ETH futures maturing in December this year closed the week at $2.525, and those maturing in December 2026 at $2.710.

Crypto $TOTAL Market Cap Hopeful Weekly CloseWhat a wild close to the Week for the Crypto CRYPTOCAP:TOTAL Market Cap
Closed just above the 50% Gann level within the POI, but failed to close above the EMA9.
Strong bounce off the SMA20 still shows bull have some gas left in the tank, but I suspect we go lower with such a massive bearish candle on the week.
SMA50 is ~2.8T

TOTAL - Marked the Top, Price Obeyedhere is the forecast
Please support this idea with a LIKE👍 if you find it useful🥳
Happy Trading💰🥳🤗

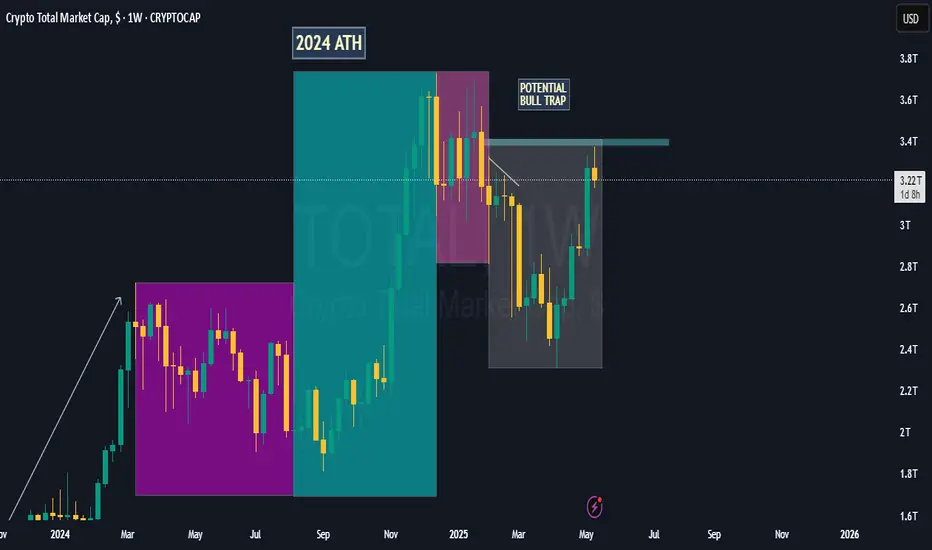
$TOTAL – Is This Another Bull Trap in the Making?The total crypto market cap ( CRYPTOCAP:TOTAL ) has surged from $2.32T and is currently trading around $3.25T, continuing its upward trajectory. On the surface, things look bullish—but is there more to the story?
Looking at the chart, the current market structure bears a striking resemblance to previous cycles:
• 2021: Massive bull run
• 2022: Painful bull trap
• 2024: Another explosive rally
• 2025: …potential bull trap?
If history is any guide, we could be nearing a critical turning point. The pattern suggests caution—could this rally be setting up for another steep correction?
My Take: Momentum is strong, but the similarities to past cycles are too close to ignore. If the market stalls at current levels, the risk of a bull trap becomes very real.
What do you think—repeat of history or a new chapter for crypto?
Please support this idea with a LIKE👍 if you find it useful🥳
Happy Trading💰🥳🤗

TOTAL - CLEARLY A BULL TRAPCalled this earlier but didn't get a single like
Follow for real-time analysis as this plays out

Bull Trap or Bear Bait? The Real Agenda Behind the Crypto PumpThe market just printed a powerful pump—and traders are standing at the edge of uncertainty.
What if the bears are right? What if this sudden surge was nothing more than a carefully staged bull trap, luring buyers into FOMO entries, only to dump hard and leave them holding the bag?
Or maybe…
What if this was a setup for the bears? A calculated move to bait sellers into opening shorts, before a single violent candle wipes them out, triggering mass liquidations on the way up.
It’s a psychological battleground—buyers and sellers clashing at a critical zone.
So, what’s really going on? Is this a trap to crush longs, or a setup to punish the shorts?
Let’s break it down.
What do you think? Vote below: Bull Trap / Bear Bait?
Follow for real-time analysis as this plays out
TOTAL: Do or Die 18/06/25Trade Direction:
Total Market Cap
Additional Notes:
- Currently on key support. IMO kind of all rides on this now. Losing this range would spell large term bearish direction across the board.

TOTALCAP — The Next Trillion Crypto Move: Are You Ready?When people analyse the crypto market, they often default to Bitcoin and for good reason. It’s the one and only, the king. But sometimes, to see the forest instead of just the tree, you need to zoom out and study the broader picture.
That’s where the Crypto Total Market Cap (TOTALCAP) chart comes in. It’s essentially the mirror of Bitcoin, but it offers powerful macro insight — not just price, but scale. Looking at trillions instead of dollars changes how you frame support, resistance, and overall sentiment. Let’s dive in.
🧠 Why TOTALCAP Matters
TOTALCAP aggregates the value of every coin and token — the complete valuation of the entire crypto industry.
And while it often moves in sync with Bitcoin, it carries a different weight.
Shows the “big picture” of institutional and retail money flow
Offers clearly defined round-number zones (Trillions) as psychological S/R
Removes coin-specific anomalies and focuses on collective momentum
In bull and bear markets, these trillion-dollar thresholds act like major checkpoints. Watching how TOTALCAP interacts with these levels can give early signals that BTC or alts alone can’t.
Historical Key Levels & Structure
Let’s break it down by macro phases:
✅ November 2021 — Peak of Last Bull Market:
TOTALCAP peaked exactly at $3 Trillion.
This level acted as a ceiling — once hit, the market reversed sharply.
This marked the top of the 5-wave impulsive move (Elliott Wave theory).
📉 November 2022 — Bear Market Bottom:
TOTALCAP dropped below $1 Trillion, bottoming at $727 Billion.
This was almost a 0.786 fib retracement from peak — similar to BTC’s historical retracements.
The $1T mark was retested as resistance before being reclaimed as support.
📈 2023–2025 — The Bull Awakens:
$1 Trillion flipped into solid support throughout 2023.
A clear sign the macro market structure had shifted bullish.
Once $2T was breached, things moved fast.
🚀 Current State:
The market surged above the previous $3T ceiling.
TOTALCAP has hit a new ATH: $3.73 Trillion
Now, the question is: Is this the start of a new leg higher, or a bull trap before a correction?
🔍 Fibonacci Confluences — Why $3.7T Was Key
The sharp rejection at $3.7T wasn’t random. It aligns with:
1.0 Trend-Based Fib Extension: From 91.24B → 3T high → 727B low = 1.0 = 3.65T ✅ precise hit
1.272 Fib Extension of the macro move
Upper Pitchfork Resistance
Channel Top Rejection
→ All signals converged to mark that level as major resistance
🌀 Elliott Wave Macro Count
Looking at the weekly timeframe, we can see a clear impulsive 5-wave movement from the 2022 lows:
Wave 1: $727B → $1.26T
Wave 2: Correction to $975B ($1T) (support confirmed)
Wave 3: Massive rally toward $2.72T
Wave 4: Pullback toward $1.69T (VWAP retest)
Wave 5: $3.73T ATH
What does this imply?
According to classical Elliott Wave theory, after a full 5-wave move, the market tends to enter an corrective phase.
🔍 Some key levels to watch:
$3T: Historical S/R (was the 2021 top, now acting as a key level)
$2.31T: Recent swing low
$2T: Psychological and structural support
📌 Zone of Interest for Longs: $2.31T–$2T
This zone holds:
Previous consolidation zone from mid-2024
Fib retracement confluence
Likely forming Wave C bottom if this is a full ABC
🎯 Upside Targets — What If We Continue Higher?
Looking ahead:
🔸 1.618–1.666 Fib Extension = $4.42T–$4.53T
🔸 1.618 TBFE from previous cycle = ~$5.45T
📌 Rounded Targets: $4.5T, $5T and $5.5T
These are the next likely macro cycle targets — but only after a healthy correction and consolidation.
☀️ Macro Context & Summer Seasonality
Historically, summer tends to be a weaker period:
Lower volume
Institutional rebalancing
Geopolitical and macroeconomic uncertainty
📚 Educational Insight: TOTALCAP as a Tool
Treat TOTALCAP like the S&P500 of crypto.
Use round trillions as psychological levels: 1T, 2T, 3T, etc.
Always check if BTC’s price is aligned with where TOTALCAP is on the macro structure
Helps judge market strength even when BTC dominance is shifting
It’s especially useful when altcoins pump or dump out of sync with BTC — you can use TOTALCAP to track the real flow of money.
💡 Final Thoughts
We are likely in a corrective phase after a complete 5-wave cycle.
The area between $2.31T and $2T offers high-probability long entries
Watching how TOTALCAP reacts to these levels will help us anticipate the broader market’s next move
Summer slowdown could mean chop — but this also creates opportunities
💬 Let me know your thoughts: Are we entering a deeper correction? Or will TOTALCAP surprise us with a new leg higher?
Don’t forget to zoom out. The charts always tell the story.
_________________________________
💬 If you found this helpful, drop a like and comment!
Want breakdowns of other charts? Leave your requests below.

TOTAL: Bias Map 17/06/25Total Market Cap Bias Map
- Ranging environment.
- Structure-wise on H4, Lower Highs are forming
- Unless the market puts in a higher low soon, the bias has to lean towards shorts.
- Loss of 106,500 support also aligns with this.
- Shorts would hedge my existing BNB long effectively.
Discipline means knowing when not to trade with FOMC tomorrow and volatile conditions with middle east news dictating market direction today and tomorrow might be no trade days for me.

Bitcoin Pushed Crypto Market Into A Higher Degree CorrectionGood morning Crypto traders! Cryptos are coming lower and we can now see a five-wave drop on Bitcoin, which indicates for a deeper, higher degree correction, so Crypto TOTAL market cap chart may stay in consolidation within an ABC correction, which can retest 3.0T – 2.8T support zone before bulls return.
Bitcoin has impulsive characteristics on 4h time frame, and we can clearly see five waves up that can send the price even higher after a pullback. Now that it’s back to all-time highs, we can see it making a higher degree ABC correction, which can take some time, and it can retrace the price back to 97k-93k support zone before a bullish continuation.
However, we may now see a temporary corrective recovery in wave B, where some ALTcoins could still be doing well, if we consider that ALTcoin dominance may start kicking in. Yesterday we shared a chart of the ratio of TOTAL3(ALTcoins) market cap against Bitcoin with ticker TOTAL3ESBTC, which shows that ALTcoins may start outperforming BTC soon. It can be finishing final subwave C of (Y) of a correction in blue wave B which may cause a new strong rally into wave C that can bring the ALTseason similar as in the beginning of 2021.

Is the breakout near?Today’s chart compares Total Crypto Market Cap 🆚 USDT Dominance - two metrics with a clear inverse correlation.🪞
🧠 Simple logic: when USDT.D drops, people are buying crypto and moving out of stablecoins. When it rises — capital seeks safety.
Since breaking its downtrend in early April, TOTAL shot up and is now consolidating in a bullish pennant — a classic continuation pattern. 📈
Meanwhile, USDT.D is forming a bearish pennant, signaling potential further downside. 📉
Most are still not ready for what’s coming... 🚀

MARKETS week ahead: June 15 – 21Last week in the news
Newly emerged tensions in the Middle East impact market sentiment as of the end of the previous week. The US equity markets reacted in a negative manner, bringing the S&P 500 down by more than 1%. The US Treasury yields started their relaxation during the week, however, reversed on Friday back to the level of 4,4%. The US Dollar lost in value, however, the demand for safe-haven assets pushed the price of gold more than 1,4% higher, ending the week at the level of $3.443. The BTC had a rollercoaster week, with highs at $110K, but is ending the week above the $104K level.
The previous week started in a promising sentiment. The US May inflation data was posted, indicating a clear down trend. The inflation in May reached the level of 0,1%, bringing it to the level of 2,3% compared to the previous year. Core inflation was also standing at 0,1%, while both figures were slightly better from market estimates. The week-end brought the University of Michigan Consumer Sentiment preliminary for June, where inflation expectations were also decreased. Yearly inflation expectations significantly dropped to the level of 5,1% from 6,6% posted for the end of May. The five year inflation expectations were also decreased from 4,2% to 4,1%.
The inflation data supported market expectations that the Fed will hold interest rates unchanged at their meeting in June, but increased odds for the next cut in September. The FOMC meeting is scheduled for June 18th, together with macro projections. Analysts are pointing that the macro projections will be in the spotlight of investors, as they are still trying to wage the total impact of the imposed trade tariffs. At their May meeting, it has been shortly noted by Fed Chair Powell that the risks of both higher inflation and unemployment had risen. As data are showing that the inflation is slowing down, the increasing unemployment might impact the Fed to cut interest rates in order to fulfil their dual mandate.
The new unrest in the Middle East is another topic that puts concerns among investors. Seeking safe-haven assets, the price of gold gained 1,4%, only on Friday trading. The investors are also concerned that the surging prices of oil, due to the crisis, might spillover to the US inflation figures in the coming period. Although the US at present moment, is not highly exposed to the volatility of oil prices on world markets, still, analysts are pointing to the effect which might come from increased commodity prices, as a consequence of surged oil prices. This will be another topic closely watched at the FOMC press conference on Wednesday.
Interesting news came from Sweden. As Reuters was reporting, the Swedish pension fund AP7 blacklisted shares of Tesla and sold the whole stake. As announced by the fund “ AP7 has decided to blacklist Tesla due to verified violations of labor rights in the United States”. Nevertheless, shares of TSLA gained 1,94% in Friday's trading session.
CRYPTO MARKET
The rollercoaster on the crypto market was evident during the previous week. The newly emerged Mid-East crisis left its market also on a crypto market. The coins were traded in a mixed manner, but ended the week in a negative territory. On the other side were a few coins which managed to end the week in green. Total crypto market capitalization decreased by 1% on a weekly basis, losing around $22B from the market cap. Daily trading volumes were relatively flat compared to the week before, moving around the $185B on a daily basis. Total crypto market capitalization once again entered into the negative territory from the beginning of this year, currently standing at minus 1%, with a total outflow of $20B.
BTC ended the week flat from the end of the previous week, although the price of coin at one moment reached the level of $110K at the beginning of the week. ETH managed to gain 1% in value, adding $3B to its total capitalisation. Other gainers among altcoins were Uniswap with a surge in value of 17,3% and Maker, with an increase in value of 23% on a weekly basis. The major coins on the market were traded with a negative sentiment. Market favorite Solana ended the week by 4,7% lower from the week before, losing $3,75B in its cap. BNB was modestly down by 1%, while DOGE decreased its value by 4%.
Although Solana was traded with a negative sentiment, still, the coin managed to increase its total coins in circulation by 0,5%. This week IOTA had a stronger increase of total number of coins on the market by 0,8%. The majority of other altcoins had an increase of coins in circulation by 0,1% w/w.
Crypto futures market
The latest drop in the value of BTC and ETH was not reflected in the prices of crypto futures as of the end of the week. BTC futures ended the week higher by around 0,6% for all maturities, while ETH futures had an increase of around 1,5% on a weekly basis.
BTC futures maturing in December this year closed the week at $109.390 and those maturing a year later were last traded at $115.590. At the same time ETH futures with maturity in December this year closed the week at $2.637, and those maturing in December 2026 were last traded at $2.838.

Crypto Total Market Cap (TOTAL) – Retest or Reversal?I’ve been watching TOTAL closely, and we’re currently sitting right inside a pullback zone between $2.9T and $3.12T — a critical psychological area to monitor.
✅ On the 2-month chart, structure still holds strong. Price action remains bullish overall, with higher lows continuing to form. This zone looks like a healthy pullback rather than a breakdown.
⚠️ However, when we scale up to the 12-month chart, momentum appears to be slowing down. This doesn’t mean we’re bearish just yet, but it does mean we need to be cautious and patient. With 6 months left before the yearly candle closes, that close will be crucial in determining if TOTAL is ready to break new highs above $3.73T (previous high) or consolidate further.
📌 Key Levels to Watch:
Support zone: $2.90T to $3.12T
Resistance/Retest target: $3.73T
Psychological floor: $2.65T
Until we close above that previous high, we remain in a waiting zone. If this structure holds, the next leg could be explosive — but patience and precision are key. 🧠📈

The 23 Years Long Cryptocurrency Bull Market CycleWe are looking at Crypto Total Market Cap. Index (TOTAL).
The weekly session trades at the highest level based on candle body since January 2025. The recovery has been swift. It started in April and after three green weeks there was a red week. Then three more green weeks followed by two red weeks. And now we are green again.
If the same pattern repeats, we get three green weeks or more followed by another retrace small in size. The main target for this already big bullish wave stands at 4.61T. This is a very strong bullish period already as it started in early April, it has been going for more than two months.
The market tends to grow and become more and more bullish, that is, bullish momentum starts to grow. When the action is really heating up doubt starts to creep in. Will it really continue higher? Is there a crash just around the corner? The crash happened last week.
If you notice last week's candle, it has a long lower shadow and a very small real body. It is a classic reversal signal. This week being full green confirms this reversal but the week is early.
TOTAL is the entire Cryptocurrency market, then we have individual charts. When we look at some altcoins in isolation, we know the top is far from being in, we know this only too well. Let's look at some examples. Ethereum, far from the top. Litecoin, very far. Dogecoin, Cardano, XRP, etc, etc, etc.
Bitcoin is now a completely different domain and is basically trading at a new all-time high. If this was the case while all the altcoins are also at new ath this would be worrisome, but the truth is that Bitcoin now has institutional demand and that's why it is so strong. There is no point in selling because whales are buying and will continue to buy, money is endless of course and money is becoming cheaper and cheaper all around the world. It is also coming to country near you but it is already happening. Remember, the cycle goes up and then down when it comes to interest rates. It already hit the top, peaked and now it is going the other way. This to say that there is room for so much growth.
Things tend to repeat, cycles tend to repeat until they don't. Literally, you can have a pattern where you do the same daily, weekly, monthly, for years until some time when you stop, it works like this with Crypto and other areas of the world. Bitcoin can produce a certain cycle and a certain pattern for 15 years straight, and then, all of a sudden things change. Not out of nowhere of course, we are seeing the world changing right in front of our eyes. Technology?
Where was the world 80 years ago?
How much change we saw between 1980 and 2010?
How about 2021 and the pandemic? You see, it continues to change.
Now it is money. You can have centuries of the same financial system, the same monopoly, all the same. Then you have credit cards and virtual bank accounts and now it is code, Crypto; nothing new, it is the same old, the only thing permanent is change and the world continues to change.
So Bitcoin can have big drawdowns just a few years ago, and in the present, these become smaller and smaller, the same happened with the stock market and the biggest stocks. It keeps on changing.
It goes from highly volatile, unpredictable and unstable to stability and growth long-term. Humanity is on a rising trend and this will always be reflected across all areas of life, finance, health, education, freedom, prosperity, liberty and the rest.
We are going up. Forever and then some more.
It is great to be alive in this world.
Namaste.

$TOTAL Crypto Market Cap Relief Rally Could be MassiveHUGE relief rally today for Crypto CRYPTOCAP:TOTAL Market Cap 🚨
Need to reclaim local high at $3.5T to confirm this reversal.
If so, we could push to reclaim this cycle's high ~$3.75T
Nonetheless, glad I got some bids filled on this recent correction 😎
I still have some set in case we go lower tho.

my interpretation of TOTAL cryptoTOTAL has been moving inside a short term channel for quite a while now there could be another rise in crypto market accordingly.

ALTCOINS made a 1D Golden Cross. First since U.S. elections.Crypto Total Market Cap just formed the first 1D Golden Cross ince November 6th 2024, which was right after the U.S. elections. The rally that followed made new highs. Since the Bear Cycle bottom, that is the 4th 1D Golden Cross and the minimum the market surged around such formation was +73.10%. This means that we can expected a 4.03T market cap at least.
## If you like our free content follow our profile to get more daily ideas. ##
## Comments and likes are greatly appreciated. ##

CRYPTO market recovery?The crypto market finding support at $2.76T is a strong bullish signal, suggesting that buyers are stepping in to defend this level. If this support holds, we could see renewed momentum, potentially leading to a 7% increase and more, bringing the total market cap toward $3.01T. A break above TRENDLINE at $3.03T will take market further +20% up to $3.6T
Key factors to watch:
Volume confirmation: Strong buying volume at $2.76T reinforces support.
Macroeconomic conditions: Favorable market sentiment and institutional inflows could drive growth.
Bitcoin’s role: BTC’s movement around key resistance levels will influence broader market sentiment.
If support breaks, expect a potential retest of lower levels before any recovery.

Crypto Total Market Cap – Bulls vs. Walls
🧪 1. 🐸 Miracle’s Take – The Meme Prophet Speaks!
“Wassup degenz! It’s ya boi Miracle again – and this chart’s juicier than a frog smoothie!”
Market just kissed the MA50 like it’s a long-lost love 💋… and BOOM — bounced back hard!
We’re climbing outta the bear channel like a true meme-warrior escaping rug hell 🧱
BUT... the resistance zone ahead (3.27T–3.32T) is like a fat whale sitting on top of the market 💀
A breakout above that and we go party at 3.48T, where the liquidity gods live 🎯
If we get slapped down though… Miracle sees a revisit to 3.2T support, where apes gather before launch 🦍
🔋 Momentum is here, but no confirmed breakout YET!
📢 Miracle’s Warning: “A trendline breakout without meme energy is just hopium with candles!”
💡 Miracle Watchlist:
✅ Break + Retest of resistance zone = GO LONG
❌ Rejection = scalp short back to MA
🔍 2. Unknown Analyst View – Clean & Technical
MA50 acted as a dynamic support and initiated a bounce.
Price is trying to break out of a descending channel, which has acted as a structure since late May.
Immediate resistance lies in the 3.27T–3.32T zone, which previously caused multiple rejections.
A confirmed breakout with volume and a successful retest of the resistance zone or MA50 could push us toward:
🎯 Target 1: 3.35T
🎯 Target 2: 3.48T (horizontal key resistance)
If rejected, we could slide back to the 3.20T support (yellow line) or even back into the bearish channel.
The market’s response to this zone will define the short-term trend.
"Observe the structure. Let price prove direction."
🎭 Two Faces. One Chart.
Who do YOU trust more today?
The meme-warrior 🐸 or the mystery tactician 🧠?
💬 Tell us in comments: #TeamMiracle or #TeamUnknown?
🎬 TradeWithMky – where altcoins speak louder than Bitcoin!
#CryptoCap #TotalMarketCap #AltseasonComing #TradeWithMky #CryptoAnalysis

The global top for CRYPTO will be in October 2025 at 4.2T marketThe global top for CRYPTO will be in October 2025 at 4.2T market capitalization
Mark my words.
