Chaos to Clarity: Mastering the Discipline Mindset5min read
Looking back on my journey as an investor, I can see how much my mindset shaped my path. When I first started, I was a mess—chasing every hot tip, jumping into trades without a plan, and letting my emotions call the shots. I’d feel a surge of excitement when price spiked, but the moment it dipped, I’d panic and sell, locking in losses. It was a chaotic rollercoaster, and I was losing more than I was gaining. I knew something had to change, but I wasn’t sure where to begin.
One day, I took a step back and really looked at myself. I realized the market wasn’t my biggest problem—I was. I was reacting to every little fluctuation, letting fear and greed drive my decisions. I started paying close attention to how I felt when I made trades. Was I anxious? Overconfident? I began noticing patterns. When I was stressed, I’d make impulsive moves that almost never worked out. But when I was calm and focused, my choices were better, and I’d often come out ahead. That was my first big revelation: my state of mind was the key to everything.
I decided to get serious about controlling my emotions. I started small, setting strict rules for myself. I’d only trade when I was in a good headspace—calm, clear, and ready to stick to my plan. If I felt off, I’d step away from the screen, no exceptions. It was tough at first. I’d catch myself itching to jump into a trade just because everyone else was talking about it. But I learned to pause, take a deep breath, and check in with myself. Over time, I got better at staying steady, even when the market was a whirlwind.
I also realized how much my beliefs were holding me back. I used to think I had to be in the market constantly to make money. If I wasn’t trading, I felt like I was missing out. But that mindset just led to burnout and bad calls. I started to change my thinking—I told myself it was okay to sit on the sidelines if the conditions weren’t right. I began to see that success wasn’t about being the busiest; it was about being the smartest. I focused on quality over quantity, and that shift made a huge difference. My wins started to outnumber my losses, and I felt more in control than I ever had.
One of the toughest lessons came when I stopped blaming external factors for my failures. If a trade went south, I’d point the finger at the market, the news, or even the system I was using. But deep down, I knew that wasn’t the whole truth. I had to take responsibility for my own actions. I started treating every loss as a chance to learn. What was I feeling when I made that trade? Was I following my rules, or did I let my emotions take over? By owning my mistakes, I began to grow. I became more disciplined, more aware of my own patterns, and better at sticking to what worked.
I’m not going to pretend I’m perfect now—I still make mistakes, plenty of them. At the beginning of this week, I came into trading loaded with personal problems from real life. I didn’t even pause to clear my head; I just dove straight into the charts and started opening long positions without much thought. By Friday, I realized what I’d done—I’d let my distracted, emotional state drive my decisions. So, I closed all my positions except one, cutting my losses quickly and stepping back to reassess. That’s what’s changed: I recognize those mistakes almost immediately now. I don’t hang on to them or let them spiral. I catch myself, fix the problem fast, and move on without beating myself up. That ability to pivot quickly has been a game-changer. I’m not stuck in the past anymore—I’m focused on getting better with every step.
Over time, I learned to tune out the noise and focus on what I could control. I stopped worrying about what other people were doing and started trusting my own process. I’d remind myself that investing isn’t just about the numbers—it’s about the person behind the trades. The more I worked on my mindset, the more consistent my results became. I learned to stay present, keep my emotions in check, and approach every decision with a clear head. That’s what turned me into the investor I am today—someone who’s not just chasing profits, but building a sustainable, successful approach to the markets, mistakes and all.
TOTAL trade ideas

$TOTAL Crypto Market Cap: Testing a Key Resistance LevelThe CRYPTOCAP:TOTAL crypto market cap has just hit the upper edge of a descending channel, currently sitting at $2.84T. Here’s why this moment is worth watching closely:
🔹 Mixed Signals Across Timeframes
On the 12H and daily charts, there’s still room for more upside, which is pretty exciting for bulls! But on the 4H chart, we’re already looking quite overbought, so we might be at a turning point.
🔹 Breakout Potential
If we can break through this channel resistance—and I’m talking about a strong move with solid volume behind it—we could see some serious momentum. I’m targeting $3.1-3.25T as the next major zone, a key liquidity area and Point of Control (POC) where we might see a lot of action. If the breakout holds, that move could happen faster than you think!
🔹 What If We Don’t Break Out?
If the breakout fails, I’d expect the price to consolidate near this upper channel line for a bit, which would be a healthier setup for the next leg up. As part of this consolidation, we might see a dip to grab liquidity at the previous low around $2.7T before climbing higher. That pullback could actually set us up for a more sustainable rally later on.

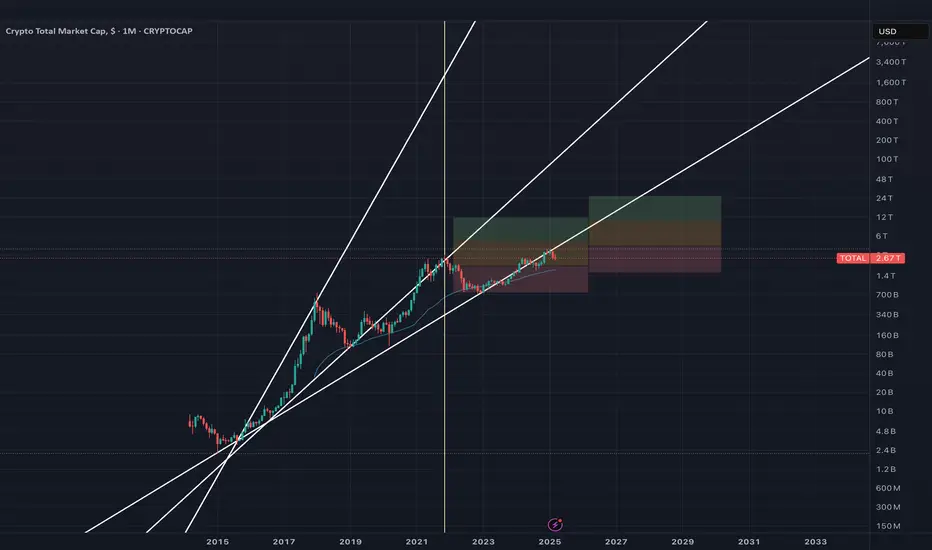
The "Good" Crypto Narrative Is OverIt's been a while since I've done a bit of a deep-dive on this market and why I don't believe it'll sustain a significantly higher value in the future. I no longer have the stamina to write a long-winded post. It's exhausting at this point, and I don't need to reiterate it. Instead, I'll summarize recent developments and their impact on the crypto narrative.
1) The TOTAL crypto market cap currently rests below the all-time high from 2021. This is even including stablecoins. There is $144B worth of USDT currently in circulation. In 2021, that number was $80B. Meanwhile, stock indexes and several individual stocks are significantly up from their last peaks. From a "store of value" standpoint, this doesn't look great, particularly factoring in inflation. Adjusted for inflation, Bitcoin itself is sitting below its inflation-adjusted 2021 all-time high, which is around $84K.
2) Bitcoin active addresses are back to 2017 levels and BELOW the levels from even the previous bear market! This implies that "authentic" adoption has stagnated and begun a decline. studio.glassnode.com
3) In the eyes of a growing number of investors, Trump and Elon's crypto push has only solidified the crypto market as a joke and as a global symbol of greed and corruption.
4) Gold has far outpaced Bitcoin as a store of value during this recent period of turbulence, disproving Bitcoin as a possible safe haven. Here is the Bitcoin/Gold chart for reference:
5) Still, if cryptocurrencies completely ceased to exist, there would be no net-negative effect on the world. In fact, it may be a net-positive. Unless this suddenly changes, crypto does not have any real world value. You cannot say this about most MIL:1T + markets: If most major companies and resources ceased to exist, we'd see a very significant (mostly negative) impact on our daily lives, almost immediately.
In summary, I don't think people will be coming in droves to invest in this market. I think that ship has sailed. The opportunity for it to prove itself has waned, and it has been overtaken by largely bad actors. If anything, I think people are more likely to be forced to buy it than enter the market willingly.
From a technical standpoint, a breakdown from the big uptrend channel in the chart above would likely confirm that the top is in.
---------------------------------------------
Beware, a crypto narrative still exists, but it's only the one fed to us by those in power. It will be important not to fall for it. I worry that people will be forced to own cryptocurrencies, at the expense of their freedom. And even in a situation where crypto prices continue to increase, it is unlikely to be seen positively.
Once we graduate from these strange and confusing times, rife with dissociation, monopolies, grift, and power consolidation, it seems more likely that humanity will look at crypto as part of an uncomfortable past. If we never move on to more optimistic times, and things continue to become more dystopian, well, then that would be a time where crypto adopters can say, "hey, we were right!" But...at what cost?
Regardless, it will always be possible to profit from the volatility, hence my attempts at trading a little recently, with a focus on Litecoin. So, trading opportunities will present themselves, which will keep at least some people interested in this market. I think it is unlikely to be enough liquidity to sustain significant new all-time highs.
Here is my last big post, where I detailed more reasoning - this was prior to the Bitcoin ETF's:
And here is a recent post, where I describe how my own thoughts about the market evolved, from when I first entered in 2017 to the present:
As always, this represents only my opinion, and is meant for speculation and entertainment only, not as financial advice. There are many other opinions out there. It is your responsibility to develop critical thinking.
Thanks for reading as always!
-Victor Cobra

Crypto Total CorrectionThe total chart has given the channel target, but when we look at the chart on the right, we can see that the market is in a downward trend in the 4-hour period and a correction may occur from here to 2.7T levels.

Crypto Total Market capApprox 8.7 Trillion based on expanding megaphone with flagpole target
Interested to see if this plays out. Linear showcasing how log targets can happen.
Not financial advice

The Global Crypto Market CapLooks like the global crypto market cap has found its local bottom.
Exciting days might be just around the corner - can you feel the momentum building?

TOTAL pumps by another $100B or maxes out at $200B, it’ll drop bIf TOTAL pumps by another $100B or maxes out at $200B, it’ll drop back to $2,400B.
Not long ago, I shared a post predicting that when TOTAL hits $2,900B, BTC would face another pullback. We’re now inching close to that $2,900B mark, and the ceiling at $3,070B is where the market will see a hefty cash-out—a massive $$$ withdrawal.
$2,900B - $3,070B: The high adjustment zone for a downturn.
$2,400B: The level we’ll watch in the upcoming dip.
Good luck out there!

The Power of Commitment in Trading Psychology: A Key to Success
The Power of Commitment in Trading Psychology: A Key to Success 📈💡
Hey TradingView community! I’ve been diving into some trading books lately, and one chapter really hit home: it’s all about commitment. Turns out, it’s the key to making it as a trader—especially in the crypto space where volatility can test your emotions. Here’s what I learned and how I’m applying it to my trading mindset.
Commitment isn’t just about showing up—it’s about promising yourself to be the best trader you can be. I read about a guy who made a ton of money but lost it all because he wasn’t fully in. It made me realize: you can’t just dabble in this game. You gotta go all in. For me, this means sticking to my trading plan, even when the market (or my emotions) tempts me to stray. In crypto, where prices can swing wildly, this is crucial.
One big thing that messes with commitment is the battle between wanting quick wins and sticking to a plan. I’ve caught myself following random advice without thinking—anyone else been there? It’s a trap. Commitment means getting your mind, emotions, and actions on the same page. I’m working on staying disciplined by focusing on my system, even during losing streaks. For example, I use stop-losses and take-profits to keep my emotions in check when trading BTC or ETH.
Here’s a 3-step process I picked up to build commitment:
1️⃣ Figure out what you really want from trading (e.g., steady growth, not just mooning coins).
2️⃣ Spot what’s getting in your way (like fear of losses or FOMO).
3️⃣ Make a plan to push through—like setting clear risk management rules.
For me, this has been a game-changer in staying consistent, especially in volatile markets like crypto.
Psychology matters so much! A lot of traders fail not because their system sucks, but because they can’t stick with it. I’m starting to see how knowing myself better helps me stay committed. Some practical stuff I’m trying: starting small to build confidence, sticking to my system no matter what, learning from experienced traders, and not letting fear of losses throw me off. My current focus is on keeping my position sizes small (1-2% risk per trade) and reviewing my equity curve weekly to ensure I’m on track.
Biggest takeaway: commitment is what makes or breaks you as a trader. It’s about knowing yourself, staying disciplined, and pushing through the tough times. I’m ready to step up—how about you?
What’s your biggest challenge with staying committed in trading?
Let’s discuss in the comments! 👇


MARKETS week ahead: March 24 – 30Last week in the news
The Fed held interest rates unchanged during their FOMC meeting held the previous week, and stuck to its previous plan of two rate cuts during the course of this year. Still, uncertainties regarding moves from the US Administration are strongly interfering investors decisions, in which sense, markets are still in a wait-and-see mood. The S&P 500 modestly gained during the week, ending it at the level of 5.667. The US Treasury yields remained relatively quiet, finishing the week at 4,25%. The price of gold reached a fresh, new all time highest level at $3.050. The crypto market was also traded in a mixed mood, with BTC ending the week above the $84K.
The most important event during the previous week was the FOMC meeting. Fed officials decided to leave interest rates unchanged, as was highly expected by market participants. Current economic sentiment, under the influence of trade tariffs are perceived as “uncertainty around the economic outlook has increased” so the risks have aroused around both sides of Fed's dual mandate. The GDP projection for this year was corrected by 0,4% to the level of 1,7%. Despite uncertainties, the Fed is still on the track of a 0,5 percentage point decrease in interest rates during this year, which would account for two rate cuts.
The Fed noted in its policy statement rising uncertainties around economic outlook caused by radical decisions of the new US Administration, while companies are starting to project their corrected earnings and growth for the future period. In this sense a company Nike noted expectations on decreased earnings originating from drop in sales due to trade tariffs. Shares of a consulting firm Accenture dropped by 7,3%, affected by the measures taken by the US DOGE amid cuts in spending.
Some good news for Ripple and its four years long battle with the SEC. As per news officially posted during the previous week, the SEC officially dropped the lawsuit against Ripple over its XRP token. As this was positive news, XRP coin jumped in value by 11%.
During the previous week Reuters published the news that the United Arab Emirates committed to the US Government to make $1,4 trillion investments into the US economy. The investments would be in the field of AI infrastructure, semiconductors industry, energy and local manufacturing. The investment is set for a period of next 10 years.
MicroStrategy finalized the sale of a series of preferred stocks, in total value of $711M. The fresh funds will be used for purchase of BTC, and is expected that the company will then hold a total 500.000 BTC tokens.
Crypto market cap
The uncertainty is currently the main word on financial markets, which influence the sentiment of investors. After turbulent last few weeks, the crypto market relatively calmed down. During the previous week, it was traded in a relatively shorter range, with almost equal number of altcoins with both positive and negative end of the week. Total crypto market capitalization remained flat during the previous week, with an modest outflow of $ 10B on a weekly basis. Daily trading volumes were further decreased to the level of around $92B on a daily basis, from $102B traded a week before. Total crypto market increase from the beginning of this year, currently stands at -16%, with $520B outflow of funds.
Regardless of short move toward the higher ground, BTC ended the week flat on a weekly basis, without a significant change in its market cap. On the opposite side was ETH, who managed to modestly increase its value by 2,3%, adding $5,5B to its capitalization. Other altcoins were traded in a mixed manner. On a positive territory was EOS, with a weekly gain of almost 9%, Tron was traded higher by 5,8% w/w and Maker was higher by 3% on a weekly basis. Uniswap gained the most with an increase of more than 12% in value. Market favorite Solana dropped in value by 4,3%, losing $ 3B in cap. ADA was down by 6%, erasing $1,6B in its value.
The highest weekly move in circulating coins had Uniswap, who not only increased its market cap by 12%, but also increased circulating coins by 4,6%. This was one of the largest increases of circulating coins for Uniswap in the recent period. IOTA also had an increase in coins on the market by 0,5% w/w, while Solana`s number of coins surged by 0,2%, same as Algorand and Filecoin.
Crypto futures market
The crypto futures market was aligned with the spot market during the previous week. BTC futures were traded lower by more than 1% on a weekly basis. BTC futures maturing in December this year ended the week at the level of $89.355, while December 2026 was last traded at $98.005.
ETH futures ended the week in a positive territory, around 2% higher from the end of the previous week. ETH futures maturing in December this year closed the week at $2.095, and those maturing a year later were last traded at $2.252.

Bullish ScenarioI'll just add on my analysis. The previous cycle had a Bullish Harmonic Cypher Pattern, labeled as green. I think in our current cycle, we need one more correction and I'm tracking a Bullish Harmonic Black Swan Pattern.. Always manage your risk guys :)

Bullish ScenarioFor the TOTAL Marketcap, I'm seeing a Bullish Harmonic Black Swan Pattern.. Further correction is needed in my opinion.. Manage your risks always :)

TOTAL LONG TERM ANALYSISIn my analysis, the FED’s interest rate decision and how liquidity will shape as a result will determine the future of the market. I believe the likelihood of a FED rate cut will increase in the next meeting. However, I expect a period of stability in the market before the meeting. In other words, I think this will lead the market into an accumulation phase within its zigzag structure, preparing for a breakout.
I expect that the FED rate cut expectations will strengthen by the time of the next meeting, and initially, the market will react with the "buy the rumor, sell the news" behavior. That is, such news is usually priced in first, followed by a sell-off. However, once the news is confirmed, the market will experience a short-term pullback. This could be the final "shakeout" phase.
When the market starts an upward rally, it will not want to carry the "small investors" and "some institutional players" on its back. In the market, leveraged positions will be liquidated, and then the rally will begin with real demand. Those who use high leverage should pay attention to what I am saying.
I cannot overlook the manipulation factor. In such phases, as liquidity increases, a manipulation period occurs. Afterward, weak investors are shaken out, and real buyers start to dominate the market.
Considering the price target in the chart (values between 2.17T and 3T), I expect a strong upward movement after manipulation. However, I believe investors should be cautious, taking volatility into account.

TOTAL 1WSome people are looking for an Alt Season considering that Dominance is below resistance, but that's how I see the market! What do you think?

What happens when TOTAL increases to $2.970T and go down 1.950T?BTC will fill your account with hope, turning it a green hue, reaching a peak of $2.970 trillion. It will linger there for a while, basking in the glory, only to be met with a dark twist as the market aligns with some negative news, followed by a surge of ultra-optimistic, hot news that keeps you on that high. Then, the market quietly pulls the capital back, returning to the $2 trillion mark.
What do you think of this scenario? How will you prepare for the upcoming phase?
With $2.75 billion increasing by $200 billion, BTC and Altcoins will take turns flourishing in an eerie dance of highs and lows.
Good luck... but beware!

TOTAL Cap | BTC | ETH | LTC | XRP | SOL | DOGE | USDTTOTAL Marketcap is trending strong and trading above last ATH
it is to be noted though that in next 6 months it can retrace back in below 3T
it may or may not be fast.
its a precaution
First support is given.

TOTAL Cap at Major Support | BTC | ETH | TRUMP | LTC | XRPTotal Marketcap is at support around 2.60 which is at 50MA Weekly+ Last Higher High
Right now scenario is HOLDING.
which can see relief on coins across the board
Buy those coins which are at major support

MARKETS week ahead: March 17 – 23Last week in the news
Tariffs-on, tariffs-off continues to shape market sentiment. The US equity markets tried to cover some weekly losses, where S&P 500 ended the week at the level of 5.638, after the index reached its lowest weekly level at 5.508. Considering uncertainty, the price of gold reached another all time highest level at $3K. The US Dollar continues to lose in strength, while US Treasuries are digesting latest inflation data and Michigan Consumer Sentiment with higher inflation expectations. The 10Y US benchmark is ending the week at the level 4,32% and is preparing for the forthcoming FOMC meeting on March 19th. The crypto market had a mixed week, with a lower start and an attempt to close the week higher. BTC passed the $80K resistance, ending the week above the $84K.
The US inflation data for February was in the spotlight of the market during the previous week. Inflation of 0,2% for the month was in line with market expectations, bringing the inflation to the level of 2,8% when compared to the previous year. On a positive side were also jobs figures, where a total of 7,74M new jobs were opened in February, above market expectations of 7,63M. However, surprising figures came from the University of Michigan Consumer Sentiment index, which was much lower from the market forecast. Preliminary figure for March was standing at 57,9, lower from estimated 64,7. At the same time, inflation expectations were increased to the level of 4,9%. The FOMC rate decision is scheduled for March 19th, when Fed officials will also discuss the current market conditions and forecasts.
The integration of the crypto market into the mainstream markets continues through new exchange traded funds, which large investment fund managers are currently filling for with the SEC. As per news published during the previous week, VanEck, a large US investment firm, has filed with SEC a launch of the exchange traded fund which will follow the Avalanche avax coin. Previously, Franklin Templeton, another investment firm, filed a launch of the ETF which will follow the price of XRP, while in February this year, the fund also filed a launch of an ETF following Solana`s spot price.
BTC related convertible bonds are now available to retail investors through the REX exchange traded fund. The convertible bonds of Michael Saylor’s MicroStrategy represent the majority of funds assets. Other holdings include convertible bonds from several crypto miners. The REX ETF was launched on NASDAQ (BMAX), with 0,85% expense ratio and total AUM of $25M.
Crypto market cap
Tariffs-on, tariffs-off were the major driver of the sentiment on financial markets during the previous period. The crypto market was also driven by the generally negative mood of investors which were trying to position for the uncertain future developments. The fear of potential negative effects of imposed tariffs is embedded into current positioning of investors. The crypto market continued with the downtrend during the start of the previous week, but then tried to recover as the week passed on. Total crypto market capitalization decreased by a modest 2% on a weekly basis, losing total $50B in value. Daily trading volumes were also modestly increased to the level of $129B on a daily basis, a shy increase from around $102B traded a week before. Total crypto market increase from the beginning of this year, currently stands at -16%, with $510B outflow of funds.
The crypto market was traded in a mixed manner during the previous week. Some altcoins managed to recover from losses incurred from the start of the week. In this sense, BTC managed to close the week in a red territory with a minor loss of around 1,5% on a weekly basis, where its total cap was decreased by $25B. ETH had a stronger weekly loss of more than 10%, where $ 26B was wiped out in its market value. Polygon and Uniswap were both down by around 10% in value during the week, while Algorand and Maker ended the week more than 8% lower. On the opposite trading side was XRP, who managed to add to its value 4% w/w, increasing its cap by $5,5B. BNB was also one of coins with a solid week, as it increased its market cap by 5,7% or $4,77B. OMG Network should be specially mentioned, as the coin increased its value by more than 13% during the week.
There has been a modest development with coins in circulation of certain altcoins. Tether had an increase of its value and also its circulating coins by 0,5% w/w. LINK made an increase of its coins on the market by 3%, while Solana, Algorand and Filecoin had an increase of 0,2%, each. On the opposite side was Maker, with a decrease of -0,5% of its total coins on the market.
Crypto futures market
Although Friday's trading session brought some positive sentiment to the crypto market, still, futures did not manage to catch up with a positive territory. Both BTC and ETH futures ended the week in red compared to the end of the previous week. BTC futures were traded lower by around 2,8% for all maturities. In this sense, December 2025 was closed at the price of $90.950, and December 2026 closed the week at $98.945.
ETH futures had a stronger drop in value compared to the previous week, between 10% and 11%. ETH futures maturing in December this year were last traded at $2.057, and those maturing a year later closed the week at $2.211.

Is the Total Crypto Marketcap gearing up for a major move?A few months ago, the total crypto market cap surged past its previous highs, reaching a new all-time high of $3.7 trillion.
The current pullback appears to be a bullish retest of the breakout level, potentially setting the stage for the next upward leg.

short opportunity total market cap cryptosee chart for specific trade setup annotated with play and rationale

Total Market Cap path to $6T this cycle An idea for CRYPTO TOTAL MC cycle top. While we are in a seemingly brutal correction I am zooming out and going back to previous cycle patterns. This cycle is taking longer than those that came before. This is neither good or bad, but rather is a signal that BTC is gaining adoption and converging with traditional markets imo. This will expand the horizon for crypto as a whole and add to its total market cap. As traders and HODL'rs we do not have control of the timeline, but we have control of when we hit the buy/sell button. So far this cycle we've seen ~20% gain from previous ATH. This is not why we are here. Godspeed

Crypto flat until the summer of 2025?TOTAL seems to be in a similar position as it was during previous corrective phase. I would not find it weird if we'd see a more sideways approach here for the months to come.

crypto total market cap with 4 year cycleFollowing the 4 year cycle with diminishing returns, it seems like we should buy in red, hold in yellow, sell in green. This takes emotion out of the investing experience.