TOTAL 2 # 002 ( GOOD for Altcoins )Hello dear traders .
Good days .
First of all thanks for your comment and support.
----------------------------------------------------------------------
Total 2 is growing in rising wedge .
With refer to the last Daily Bullish Gann Square ( Blue Square) and Bearish Gann Square and with consideri
Key data points
Previous close
—
Open
—
Day's range
—
About Crypto Total Market Cap Excluding BTC, $
Bitcoin is quite a heavy-weight fighter which makes it difficult at times to correctly define how the crypto market is doing — it just outshines other coins, and you can't see clearly. Since Bitcoin presents such a huge piece of the crypto pie, excluding it from counting sounds reasonable and lets you see a more clear picture of where the crypto market is moving at the moment. That is what you can see on the chart we've prepared — calculated by TradingView, it displays global crypto market cap without Bitcoin's share.

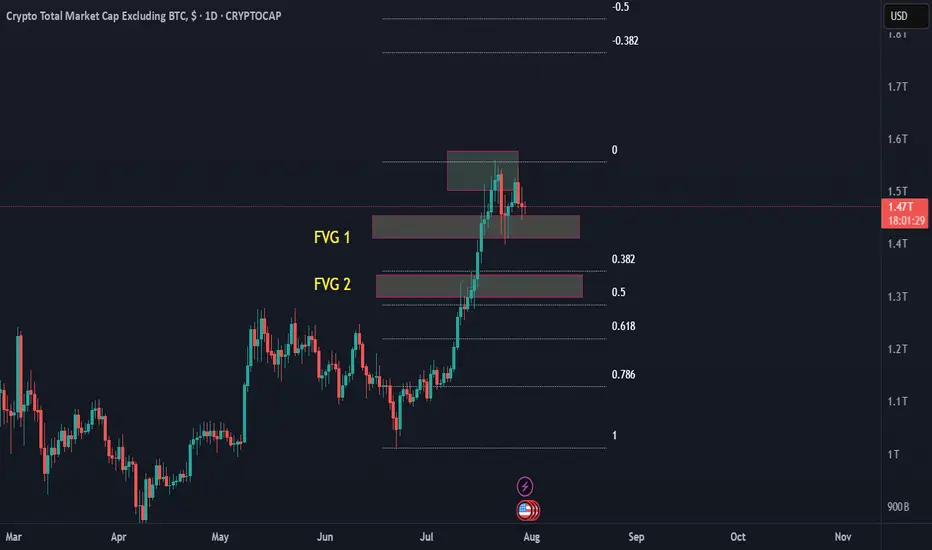
TOTAL 2 - Trend Analysis Updated Price Action Insights:
Price rejected cleanly from the upper FVG near 1.55T (still acting as dominant resistance).
Now consolidating / weakening under FVG 1, after briefly testing it.
Lower highs are forming, and price is struggling to reclaim key levels = signs of bearish structure develop
Total 2 --- Long For ALTshi
as i said in BTC.D and USDT.d analyse this charts has correction potential , if thats occure and market makers looks to ALTs . total 2 make a good high and show green ALTs market for some weeks.
it's my peronal idea for this chart , please do not make and inveting and trading on my analyse

TOTAL2 1D – Altcoin Market CapAltcoin market cap excluding BTC. Used to measure overall altcoin trend and volume strength.

When Altseason? Clues in other chart Ex) #1Hi guys.
So Its no secret bitcoin has been ripping.
We are at new all time highs, and in full on price discovery mode.
I recently posted an ongoing macro analysis on ADA (Cardano) supporting my theory that it is one of the better alts to be investing in for alt explosion.
I want to look elsewh
Total2 my notes for short termwaiting for a correction from 1,3T zone
not financial advices, my notes for myself
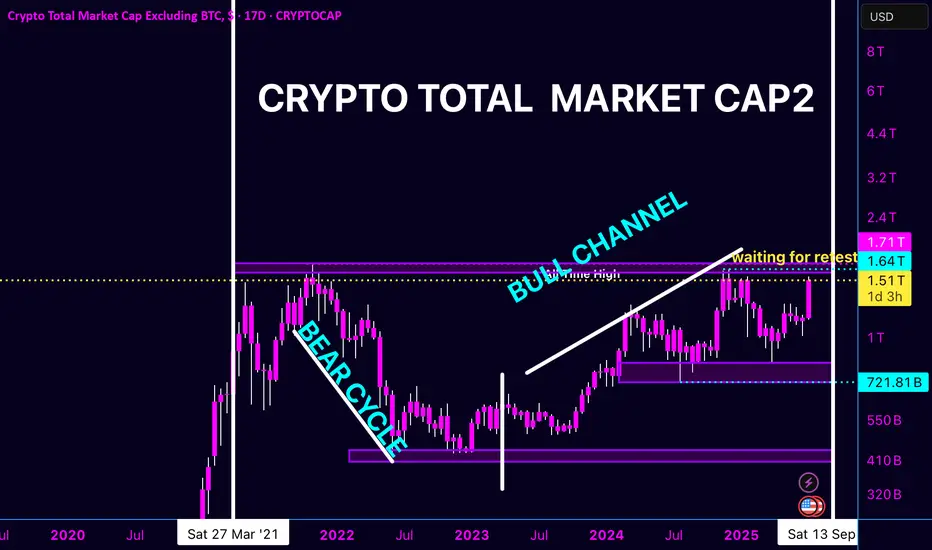
TOTAL 2 UPDATE – ALTCOIN MARKET CAP EXCLUDING BTC
We’ve officially climbed out of the bear cycle, and after months of chop and consolidation, we’re fully engaged in the bull channel. Just tagged 1.51T again with clear intent to break into new highs.
🔹 All-Time High Zone: 1.64T – 1.71T
🔹 Current Status: Waiting for retest after bullish breakout s
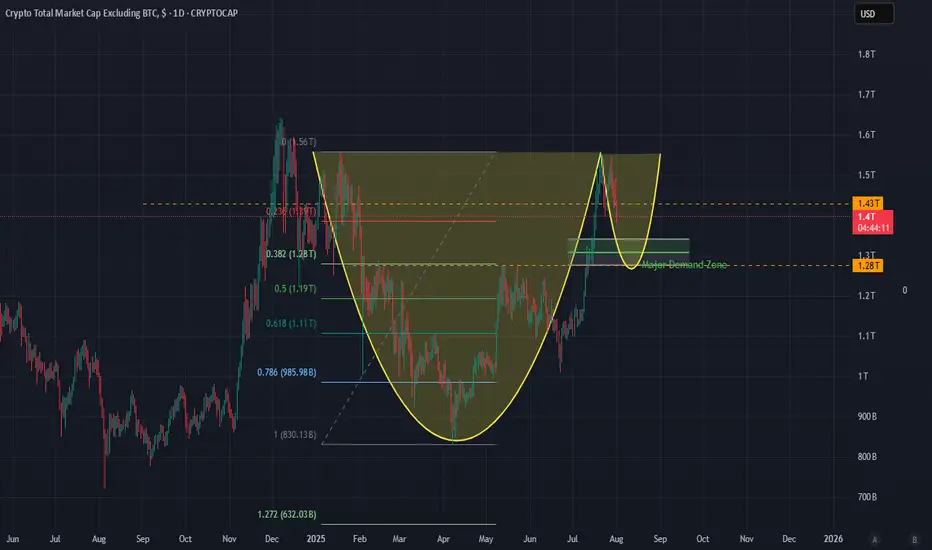
MARKET UPDATE— August 1st, 2025“Handle before lift-off? Or is the bull year cooling off?”
Let’s address the question everyone is silently asking:
Are we nearing the end of the bull year… or is this just the calm before the next storm?
1. Total Market Cap (ALTS): Cup & Handle in Motion
We’ve observed something beautiful fo
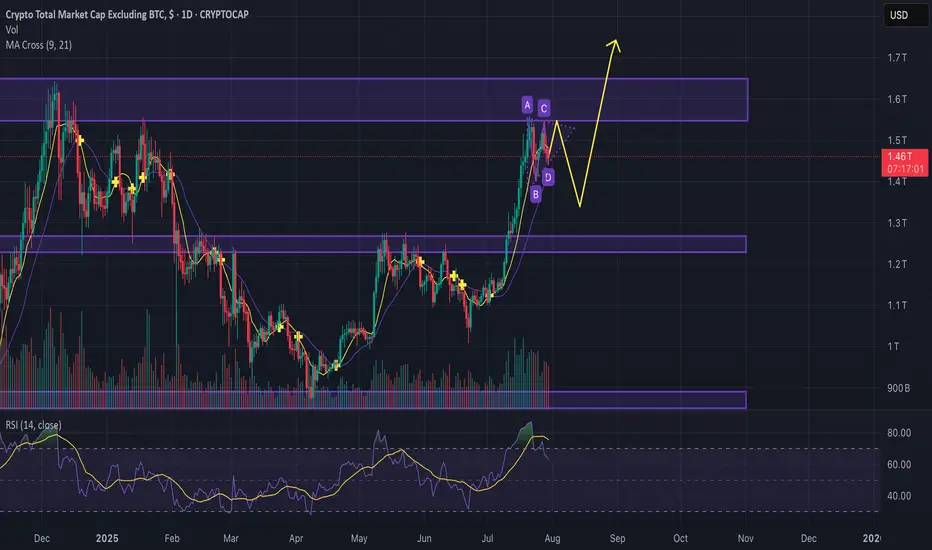
Is altcoin season over before it even started?Guys,
Gonna break down the situation on the chart to see where we can go next with the altcoins.
We see the key resistance levels and now we moving in kinda bullish pennant, but considering descending volumes we can easily test the support line and go back to the 1.25T. (maybe even lower)
After
Ethereum Staking Strain Exposed — Daxprime Weighs InIn July, the Ethereum ecosystem faced a new challenge: a sharp increase in the staking exit queue revealed structural weaknesses in the current liquid staking architecture. Within just a few days, more than 75,000 validators submitted requests to exit, causing temporary disruptions in certain deriva
See all ideas
Summarizing what the indicators are suggesting.
Oscillators
Neutral
SellBuy
Strong sellStrong buy
Strong sellSellNeutralBuyStrong buy
Oscillators
Neutral
SellBuy
Strong sellStrong buy
Strong sellSellNeutralBuyStrong buy
Summary
Neutral
SellBuy
Strong sellStrong buy
Strong sellSellNeutralBuyStrong buy
Summary
Neutral
SellBuy
Strong sellStrong buy
Strong sellSellNeutralBuyStrong buy
Summary
Neutral
SellBuy
Strong sellStrong buy
Strong sellSellNeutralBuyStrong buy
Moving Averages
Neutral
SellBuy
Strong sellStrong buy
Strong sellSellNeutralBuyStrong buy
Moving Averages
Neutral
SellBuy
Strong sellStrong buy
Strong sellSellNeutralBuyStrong buy
Displays a symbol's price movements over previous years to identify recurring trends.