TOTAL2 - Bullish Breakout, Alt Season Could Be Upon UsTotal Crypto Market Cap excluding Bitcoin. Alts may be ready to explode!
TOTAL2 trade ideas

Correction to the Alts on the horizon?Many thanks to @without_worries
Using the Pivots High Low Line by DiZer, one can see that the alt coin market cap is approaching a key resistance level. Also please observe the the MACD indicator which may have a bearish cross over soon and the RSI level which is near the overbought zone. A correction to the alt coins may be on the horizon. Please check out @without_worries for his excellent TA where he talks about life crosses and other fundamentals pertaining to this matter.

For the ones saying , alts are dead. remember this pattern?Cup and handle, send it. similar TA to my bitcoin analysis when everyone said at 90k it would 'die'

TOTAL2 - Still BullishI am still very bullish on alts, more than I am on BTCUSD.
A divergence is occurring where the RSI on this hourly timeframe is moving downward while price is trending upwards. This is a bull sign.
Alts pumping around the board.

ALT Season? Not Even CloseWhen we exclude Bitcoin from the total crypto market cap, it becomes clear that we’re far from the conditions needed for an ALT season. Here’s a breakdown:
First Resistance: $1.28T (Excluding BTC)
The last high was in March 2024, with the market cap reaching $1.28T.
At that time, BTC dominance was around 52%.
Second Resistance: $1.71T (Excluding BTC)
This was the peak during the ALT season in November 2021, with the market cap hitting $1.71T. Back then, BTC dominance had dropped to just 42%.
Current Situation
BTC dominance is now sitting at 60%, which is far too high for a typical ALT season to start.
Historically, ALT seasons tend to begin when BTC dominance falls below 50% or even lower.
Conclusion
The altcoin market has a long way to go before reaching the conditions for a true ALT season. We need BTC dominance to decline significantly and the altcoin market cap to break through key resistance levels at $1.28T and $1.71T.
What’s your outlook? Are altcoins still in Bitcoin’s shadow, or is a shift coming? Let’s discuss!

Tic... Tock... #Altcoins #Alts market cap #TOTAL2 -weekly falling trend breakout has been completed and will start the major uptrend wave after the retest.
We also witness a transition from the RE-ACCUMULATION phase of the wyckoff cycle to the MARK-UP phase.
#Altseason process will happen there sooner or later!

Total 2 at the verge of a break through We are looking a Total 2 , this breaking through means btc domiance dropping an altcoins have their way

A close up of the bullflag forming above c&h rimline on total2The red line is the rimline of the Total2 chart’s cup and handle pattern that I made a post about a few days ago and will link at the bottom of this post. I thought it would be a good idea to include a close up of this bull flag that is forming with that redline mostly serving as support here so it would be easier for people to see when the breakout from the cup and handle will be validated. Once we have solidified the red line as support long enough we will validate the breakout from the cup and handle. One thing that will greatly increase the probability that w will validate that breakout is by first valdating the breakout up from this smaller bullflag pattern that has been forming here, you’ll notice that we are also about to have a golden cross (when the orange line crosses above the blue line ). We are now just one to two days away max from that cross happening and I would not be surprised if the pump up from the bullflag that validates it’s breakout occurs the same day the golden cross occurs, as I have already seen that happen immediately on the golden cross in two other chart recently, and it usually tends to do so once we have entered the parabolic phase of the bull market. If we do we will simultaneously validated both the breakout from this bull flag and mostly likely validate the breakout from the more macro timeframe Cup and handle pattern as well. I will link the chart I posted a few days ago showing the full cup and handle pattern down below. We’ve already seen a slight bit of a precursor already in the market but once the cup and handle validates its breakout, it is officially alt season. *not financial advice*

Moving Average Positions (50,100,200)Normally when bear moves arise the 50 and 100 are above the 200 as there is more room for a downward move than an upward one.
Right now the 50 and 100 are BELOW the 200, which suggests that they have more room to move up ABOVE the 200MA in red, which would happen during a bull move.
Observation of the MA's
Comment if you think otherwise !
Daily timeframe

#Altcoins are preparing for a Parabolic run!#Alts will turn into #altseason after RE-ACCUMULATION stage according to Wyckoof cycle and will start epic rise!

Basic TA: From Bearish To Bullish (Downtrend Broken)The worst mistake that can be made after being bearish when a market is not rising, is to be bearish when the market is rising.
Look at this chart, this is TOTAL2. This week is young, just last week there was a bullish breakout above the black descending (downtrend) line. Last week the bearish bias/trend was broken and the market enters and uptrend.
A mistake can be made to be bearish when the market is going down, because it turned. But an even worse mistake is to stay bearish when the market is clearly breaking up.
The correction is over and the bearish bias is nullify by a high volume bullish breakout. The bullish breakout confirms the start of a new bullish trend. Not the end, the start. The start of the bullish trend can go for months or even years. The correction is not starting, it is now confirmed over. The confirmation comes from the action switching from lower highs to higher highs and higher lows.
We had lower highs from 11-March until 28-October. We now have a higher high and this is supported by high volume. In this case, based on technical analysis and price action, we switch our bias from bearish to bullish.
Thank you for reading.
Namaste.

ALTCOINS total2 update; zoomed in short term pivotALTCOINS total2 update; zoomed in short term pivot
Care with leverage here / stops
looks dubious.
cmon bulls show us your balls.

At the beginning of the #Altcoin bull run!The reaction rises that started with q4 2024 will turn into a parabolic wave with q1 2025 for #alts
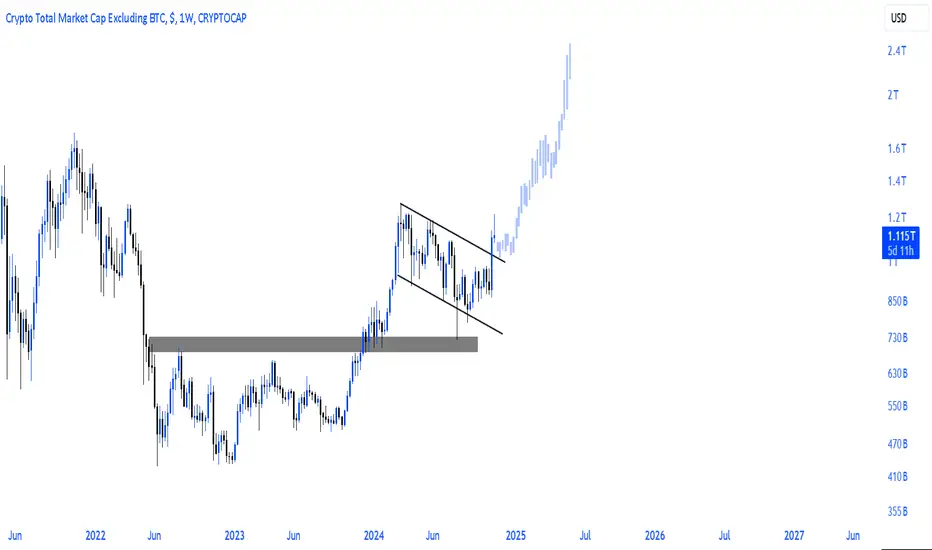
total market capIf we close a daily candle above $1.1 trillion, we can be confident that the altcoin season has officially begun CRYPTOCAP:TOTAL2

Altcoin Season! C&H pattern can take altcoins to 2 trillion!Price action has now finished the handle on the total2 charts cup and handle as well as closed a Daly candle above it. Now we need to close a weekly candle above it and make sure we’ve flipped the rimline to solidified support so we can trigger and validate the breakout. If so the measured move line takes price to a target of 1.99 trillion! The journey to that target would make for one unforgettably epic altcoin season no doubt. *not financial advice*

TOTAL2 - Way UpUsing bars pattern and a curved trendline to plot a way up towards the stars for the altcoin market after Bitcoin finishes its move and lets alts to clean this up.
Very bullish right now.
Daily chart

Alt coins alt seasonI was expecting. A small correction yesterday but after checking the monthly and weekly chart .seems to me alts can easily +50% from now . Historically when btc has a bull run when btc start to consolidate money will flow back to alts in hopes for much better profits . That’s how it works . Some alt coins are already an overbought like doge and sui and some meme coins . We should see money flow to low cap alts next I expect

Total 2 alt coins idea I think the market will consolidate for a couple days before moving higher . It is now touching the 1 week resistance . It would be nice to get a small pull back to buy more . I sold some of the positions here

ALTS ARE ABOUT TO MOONWeekly close is happening tonight and the RSI AND TSI are both making positive divergences. RSI is clear to soar as it s breaking out of the cup and handle pattern. TSI just created a cross that is very rare and has a high success rate. New all multi-week gains are around the corner.
NOT F.A.

#TOTAL2 Breaking out#TOTAL2 Breaking out.
Breakout of main trenline.
Breakout of MA
Breakout of high volume.
See you on the Moon 🌙

#Altseason loading step by step!Just like in the 2020-2021 period, I feel the #Altcoins run again in my bones in the 2024-2025 period.
#Alts run will melt all faces again and add new millionaires to the community of believers!

TOTAL2 alpha analysis and targetstotal2 alpha ,reched 1.27T , we shared 1.4T last year which is 10% higher only not bad . Clean structure here after retesting the accumulation range at 701B (yellow range ) , took off till 1.27T which is the top of 2022 first drop range(black range) and took the highs .
Corrected 43% from there and almost retouched the accumulation range .
Now , back into black range and cyan (cyan range is almost identical to black , however cyan is the latest range total 2 trading in for the last 250days ) . Now we are breaking the first grey box which showed resistance for the last 90day. Acceptance above it will lead the way to 1.5T then 1.27T (top of black and cyan range ) . After that 1.5T woule be in play .
2.5-2.7T is my finale target for this cycle imo .

TOTAL2 alpha analysis and targets total2 alpha ,reched 1.27T , we shared 1.4T last year which is 10% higher only not bad . Clean structure here after retesting the accumulation range at 701B (yellow range ) , took off till 1.27T which is the top of 2022 first drop range(black range) and took the highs .
Corrected 43% from there and almost retouched the accumulation range .
Now , back into black range and cyan (cyan range is almost identical to black , however cyan is the latest range total 2 trading in for the last 250days ) . Now we are breaking the first grey box which showed resistance for the last 90day. Acceptance above it will lead the way to 1.5T then 1.27T (top of black and cyan range ) . After that 1.5T woule be in play .
2.5-2.7T is my finale target for this cycle imo .
this is not a financial advice
thank you
