what is going on in crypto market?!hello guys!
today crypto market has gone down a lot!
let's look through the details:
Today's crypto market experienced a bearish trend, with Bitcoin (BTC) falling to $65,000 and Ethereum (ETH) declining to $3,428.45. Altcoins like Solana (SOL) and meme coins Dogecoin (DOGE) and Shiba Inu (SHIB) saw significant drops, while XRP defied the trend, rising slightly.
The global crypto market cap dropped 3.14% to $2.35 trillion, and market volume surged 104.01% to $94.07 billion, influenced by the U.S. Federal Reserve's hawkish stance.
Key Prices:
- Bitcoin (BTC): Down 1.39% to $65,374.98.
- Ethereum (ETH) : Down 4.39% to $3,428.45.
- Solana (SOL): Down 9.25% to $134.26.
- XRP: Up 0.33% to $0.4893.
Meme Coins:
- Dogecoin (DOGE): Down 9.74% to $0.122.
- Shiba Inu (SHIB) : Down 12.12% to $0.00001802.
Top Losers:
- zkSync (ZK): Down 30.23%.
- Fantom (FTM): Down 20.69%.
- Ethena (ENA): Down 18.89%.
- Starknet (STRK): Down 17.82%.
____________________________________
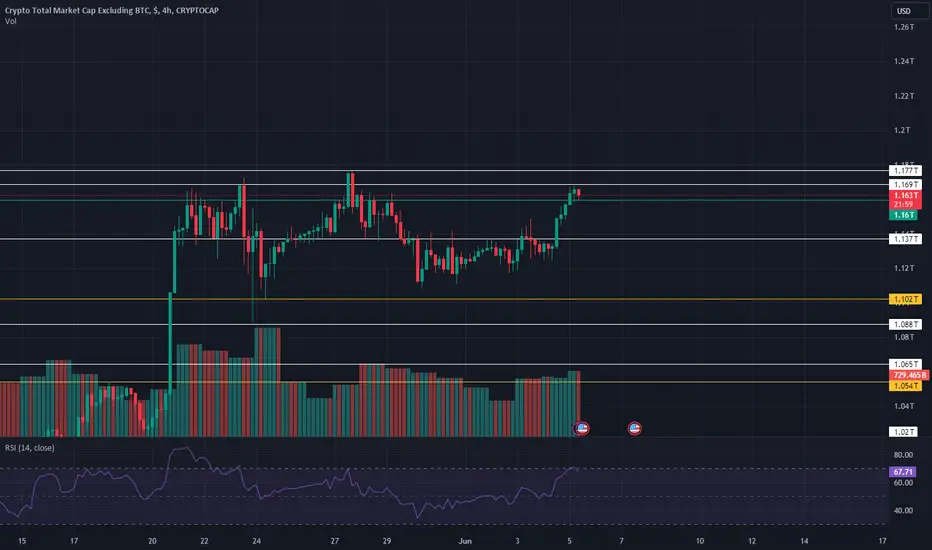
let's come back to Total2:
description:
The **Total2 Index** is a cryptocurrency market index that tracks the total market capitalization of all cryptocurrencies excluding Bitcoin. This index provides a way to measure the overall performance and trends of the altcoin market, without the influence of Bitcoin's market movements, which often dominate the crypto space.
By excluding Bitcoin, the Total2 Index gives a clearer picture of how the altcoin sector is performing, helping investors and analysts understand market dynamics and the relative performance of various other cryptocurrencies. This index can be particularly useful for those focused on altcoins or looking to diversify their portfolios beyond Bitcoin.
technical analysis:
the previous leg Was corrected until 33%, so it seems the next legs become more bullish, and this index will touch the $12.9T area as well, but it's fine if it becomes a little bit bearish until touches more than 480b area, we can consider on an upward movement!
___________________________
✓✓✓ Always do your research.
❒❒❒ If you have any questions, you can write them in the comments below, and I will answer them.
❤︎ ❤︎ ❤︎And please don't forget to support this idea with your likes and comment
TOTAL2 trade ideas

Bears Won't Win...After going over charts I think I'm seeing things clearly for what they are - Yes we can fall more in the short term but it's only another buying opportunity if it comes and just means the bull cycle will start from a lower base and last longer - I'm anticipating full on FOMO to come into these markets like we saw in 2017 gl.

Total2 Tested The Trendline....!The altcoin market cap (TOTAL2) tested the trendline support and bounced from there, as expected. We already suggested accumulating some altcoins during the dip. A bounce in altcoins may occur when BTC stabilizes.

Total 2 Not looking good!As you can see On Total 2 Chart, It broke down of the trend line and is currently retesting it…
I do expect the Total 2 to come down to depicted areas in near future.
Lets see how its gonna play out
Always a Student.

TOTAL2 - Great Monthly StatePrice has poised itself right above the Gaussian Channel on this Monthly timeframe and is looking to form a bullflag just above it.
This will allow for a massive bull run up to highs we have never seen before.
Very bullish observation

TOTAL2:Because Total 2 is also turning green, when it turns red, it means they are selling bitcoins, and when it turns green, it means they are emptying their hands, so they don't buy altcoins.

#TOTAL2 The total market capitalization of altcoins is approach#TOTAL2
The total market capitalization of altcoins is approaching a significant trendline👀
This indicating a bounce and an opportune moment to accumulate favored altcoins during the dip😉

Worried about holding Alts? Remember this chart!
The Alt market cap is currently showing strong support around the $1.112T mark. After a decisive breakout from the descending channel, we are now seeing a period of consolidation. This suggests a potential for further upside if support holds.
📈 Key Observations:
- Breakout from the descending channel indicates a bullish trend reversal.
- Support around $1.112T is crucial; maintaining above this level could lead to further gains.
- Watch the weekly close for confirmation of this trend.
Stay vigilant
Do hit the like button.
Thank you
#PEACE

'Inexperienced retail' 'Hodlr' playing with circles top guessJust playing with circles trying to find the alt market's geometrical blueprint and underlying framework it's going along.... From the first time I played around with the charts I became aware of some kinda pattern BTC was following by stacking parallel channels along certain trend lines. In doing this, i realize that there is probably several and more intricate geometrical shapes the overall charts are following. So, with me having no traditional TA experience, my whole approach to looking at the charts is just trying to find the underlying 'macro' geometrical framework that the price appears to be following. In this case, i'm just playing with circles and guessing a possible optimistic shape.... With that being said I could be totally wrong.... But, I'm guessing a July 25th top, then another Top around January 13th .... Just a guess tho, I reserve the right to change my prediction in the future. "The list is fluid" - Stephen A Smith lol

ALTCOIN market UPDATEALTCOIN market UPDATE
yuh pretty obvious cycles going on here
could it be this easy?
bloody hope so LOL

TOTAL2 - Looking at the RSI I expect a continuation pattern on the Weekly RSI with the circle being the comparable point in the bull run.
The RSI shows a large W pattern and we are experiencing the bullish right arm of the W
I think we are bullish until next year easily
This is the altcoin market cap

TOTAL 2 :Total two, this candle can be continuous, so if you have a long altcoin position, you can not close it, but at your own risk 🙂
It is not my strategy to open a short position
TOTAL2 - Sideways PeriodsThree boxes, movements within each are often sideways leading to bull moves
Currently we are experiencing a bull move on TOTAL2.
Lets goo

TOTAL2 - Bullish Above Downtrend A down trend can be drawn using the previous highs peaks
Price has risen above this trend line currently and is finding support above it
This is a bullish scenario with the further breakout upwards just a matter of time to occur.
Daily chart

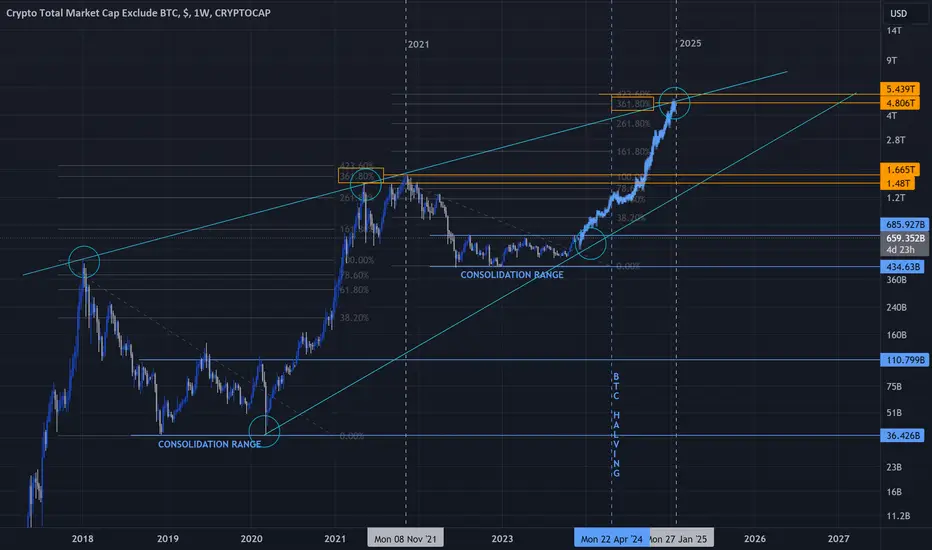
Time is Ticking- Simple as usual, everything in graph.
- BTC Halving is around April 19-2024.
- And of course it will be the main influencer for others altcoins.
- Without TheKing Cryptos are nothing.
- Cryptos Markets in 2021 :
- 1.5T to 1.7T
- Forecast of Cryptos Markets in 2025 :
- 4.8T to 5.5T
- Charge your bag and don't miss the train.
- Play always what you don't need for living.
Happy Tr4Ding !
Altcoins W pattern- Fast update
- All in graphic like always.
- if Altcoins breakout this range.
- the speed of the acceleration could be surprising.
- DYOR " W pattern ".
Happy Tr4Ding !

The new rally of altcoinsThere is a possibility of repeating the repetitive cycle of the altcoins market according to the above chart.

$TOTAL 2 chart is weakening?#TOTAL2 Total Marketcap of #altcoins incl. #eth #sol #bnb #xrp and all #altcoin market cap index has severe weaknesses such as bearish diamond pattern (diamond sends backs the price where it pumped from) and bearish RSI divergence in LTF.
Invalidation: #totalmarketcap 2 , reclaims ~ 1.25 Trillion #usd zone with weekly close.
Not financial advice.

a bandIt has a red resistance band in front of it.
Breaking this resistance band can lead to interesting growth of altcoins

Crypto to launch into the stratosphere- Ethereum ETF approval is one of the most bullish fundamental catalysts in crypto history, very likely THE most bullish event for altcoins in general
- Trump saying publicly, on camera that he will take care of the nation´s 50 million crypto holders is positive and by itself also very, very bullish
- rising wicks imply rising demand but consecutive rising wicks on the 3W time-frame imply serious upside pressure
- first target of the entire crypto market cap is 3T
TOTAL2 :Total Two only approves Ethereum and gives why, because Total Three is a complete box
Ethereum moves faster than Total 2, so don't wait for Total 2 to break
Ethereum moves soon after breaking 1.16

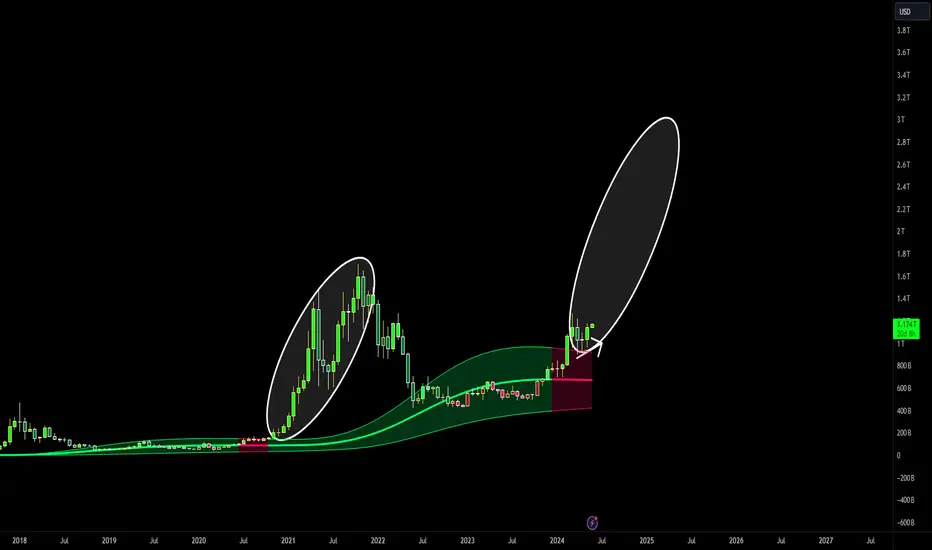
TOTAL2 - Monthly Strong Bull Phase BeginsIn each circle the alligator indicator can be seen to be stretched out or "open"
When in a state like this bull action is most common
This is the Monthly timeframe so patience is required for big gains, regardless we will be seeing more green days than red.
BULLISH

TOTAL2 (Crypto Alt) will go +800% in 12 MonthsFrom Dec 2016, TOTAL2 increased +94,000% for 12 months.
From Nov 2020, TOTAL2 increased +1,180% for 12 months.
From June 2024, TOTAL2 will increase ____% for 12 months?
BTC expected to go +200% within 2024.
BTC.D expected to drop within 2024.
= Alt market expected to go more than +200% within 2024 (I am expecting about +300% in 2024)
In 12 months total, I am expecting TOTAL2 to go +800% within 12 months.
Let's see whether history will repeat itself
