ALTS withstanding the final Resistance before ATH rally.It couldn't be any more simple than that. The altcoin market is having the last short-term correction before an surge past the All Time Highs (ATH). The Pressure Zone 2, which is the Resistance Zone coming off the Bear Cycle's first Lower High, is the last volatility variance and effectively last opportunity to enter before alts start the most aggressive part of the Bull Cycle.
As you can see, they traditional lag behind Bitcoin (BTCUSD), which has already broken past (even marginally) its previous ATH. The pattern is identical to the last Cycle and based on historical behavior, there is no reason to expect something different this time too.
Get ready for a very aggressive Altseason.
-------------------------------------------------------------------------------
** Please LIKE 👍, FOLLOW ✅, SHARE 🙌 and COMMENT ✍ if you enjoy this idea! Also share your ideas and charts in the comments section below! This is best way to keep it relevant, support us, keep the content here free and allow the idea to reach as many people as possible. **
-------------------------------------------------------------------------------
💸💸💸💸💸💸
👇 👇 👇 👇 👇 👇
TOTAL2 trade ideas

TOTAL2 update; ends sooner than you thinkTOTAL2 update; ends sooner than you think
now some months have passed we can see reasonably clearly where we are at since the last analysis right at the start of the macro move up.
obviously black swan etc can ruin this or it just does it differently this time. prob not though tbh and if there is a black swan id bet its around those dates. the events tend to fit the chart for some odd reason not the other way around.
leaning towards the early version. im seeing mid april on a lot of other fractals. basically double tops or just slightly higher last highs then splat.
or it just keeps marching up and up and we all get raris and citadels.
im good with either.
lfg
gl

Total 2 market highs @ fib 0.236Total 2 market highs @ fib 0.236 would be a great profit Sheds interested area
#Hodl #long term views #DYOR

Total 2 market highs @ fib 0.236Total 2 market highs @ fib 0.236 would be a great profit shedding interested area , Altcoins this cycle must go greatly well
Pls #DYOR


Total 2 - daily time frame 2 entries scenarios on daily time frame after ALTs correction based on previous analysis
1 based on FVG and .38 fibb
2 according strong supports area and fibb .61

TOTAL 2 DAILY TIME FRAMETotal to seems to start forming down trend after fail to break big resistance.
High potentials to continue falling down until drops to first major support area (green line)

Altcoins Strong Long Just finishing 3-2 correction and about to head off to hit 3-3, 3rd Impulse wave Summer 2024.

If you're not buying?? Then WTF r u doing? :flushed: PT2Rocket is flying and going higher and higher, Weekly close here above major level tells us the weeks ahead will bring NGU for all.

TOTAL2 hope we go break through to upsideBullish flag is obvious but we saw tons of examples of failure of this pattern. Let's hope the best and break th 1.2 resistance.

ALTcoins May Resume Higher SoonCryptocurrencies slowed down after strong rally into wave 3 of an ongoing five-wave bullish impulse, so current sideways consolidation should be just a correction in wave 4.
BTC dominance is actually still here and Bitcoin can be already progressing wave 5, but that's why ALTcoins are currently slower than BTC.
However, looking at the TOTAL2 Crypto market cap, which excludes Bitcoin, it looks like nice and clean bullish triangle pattern in wave 4 that can be coming to an end with final subwave (E).
So, soon be aware of a bullish resumption within higher degree wave 5 of III, which can push BTC and ALTcoin friends even higher.

alt szn?alt coins have been bullishly consolidating for the past month, this is looking very promising as a lot of indicators got reset and btc is breaking to the upside as well.
will be interesting to see if btc conintues to pump even after halving, (normally likes to dump on or after halving) with buy the rumor sell the news. all in all crypto is looking very bullish and healthy and the dips are for buying.


TOTAL 2 ROADMAPExpect to buy around 855B. Depends BTC and USDT.D. Keep following expect new ATH this year

PREPARE FOR ALTCOIN RUNPREPARE FOR ALTCOIN RUN 2024-2025
The levels to watch for this altcoin bullrun

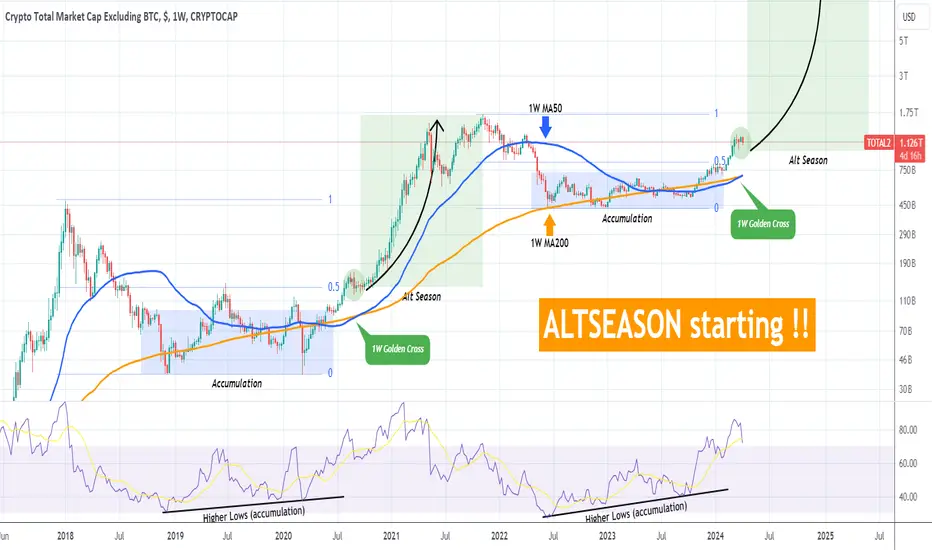
ALTS are ready to explode after this Golden Cross! DON'T MISS ITThe Crypto Total Market Cap excluding BTC (TOTAL2), which is essentially the altcoin market, just completed a Golden Cross on the 1W time-frame. That is the first such formation since September 14 2020.
As you can see, that was during the middle of the previous Bull Cycle, around the 0.5 Fibonacci retracement level and past the Accumulation Phase (blue Rectangle). The 1W Golden Cross essentially signaled the start of the Parabolic Rally (green Rectangle) 3-4 weeks later, which is the most aggressive part of the Cycle and what is otherwise known as 'Alt Season', the time when alt coins see extraordinary growth.
The similarities between the two Cycles so far are striking. The Accumulation Phase was very long and took place on 1W RSI Higher Lows, a Bullish Divergence that paved the way to the Cycle's Rally. Note that this is only the 2nd 1W Golden Cross of the market, a feat that traders and investors should not miss and take advantage of. As long as the 1W MA50 (blue trend-line) supports, the market will continue to be on the Bull Cycle and enjoy its biggest gains.
-------------------------------------------------------------------------------
** Please LIKE 👍, FOLLOW ✅, SHARE 🙌 and COMMENT ✍ if you enjoy this idea! Also share your ideas and charts in the comments section below! This is best way to keep it relevant, support us, keep the content here free and allow the idea to reach as many people as possible. **
-------------------------------------------------------------------------------
💸💸💸💸💸💸
👇 👇 👇 👇 👇 👇
The play of the CenturyInsane to think we are only in the 4th of 32 Bitcoin Halving's. BTC alone will be the hardest asset for the upcoming century's. Altcoins will form a market of their own and constantly appreciate with Bitcoin throughout the Halving cycles. Best savings account in history.

TOTAL2 ready for a big breakouthi Traders,
In September 2023, we have published analysis of TOTAL2:
The target from this idea was reached and we're seeing a successful retest of the previous resistance and confirming it as support. Now it looks like altcoins market is ready for a mark-up.
Bitcoin is still very bullish and we believe that once it continues its parabollic run, TOTAL2 will start its mega pump too.
In this analysis, we would like to show you expected path for TOTAL2. On the chart you will find take profit levels where we're expecting pullbacks or consolidations , and the final target.
Take profit levels and the final target are defined based on the fib extension levels.
Don't sell to early. Altcoins will pump hard in the next months.
Do you agree? Feel free to leave a comment !

Alt coins bull runI highly believe (by analyzing many alt coins in HTF) and by analyzing this TOTAL 2 chart
that the bull run is only warming up
so many alt coins have the potential to do 8x to 10x at least
the potential is insane
on CT we don't even see euphoria yet
the sentiment is mainly people in disbelief or angry shorters
they will have their joy for a few moment maybe, thinking they shorted the top
and then they will get rekt hard by the true rally
bringing FOMO, euphoria and real top
where the angry shorters will give up and start longing when everything already did 10x
I share you my take so that you don't end up being on the side of the frustrated traders/investors
this is the time of the market where spot holders will have a way bigger ROI than most futures traders
ofc, this is only my take, my analysis
don't follow blindly, have your own analysis too
educational purpose only
nfa

All the way up!Looks like indicators showing positive trend, and price is perfectly bouncing from 0.618 fib level from last correction. Next level is 1.618 fib level. Not financial advice.

Crypto is easy. Buy in the Triangles and than enjoy ...the expansionary phases that occur after
LOL
I know it ain't that easy
But everyone else who didn't invest
will say it was.
They will never understand!!!
LOL
best of luck still wildly bullish
But I will become a stablecoin maxi one day not too far away.
And you will probably hate me ;)

TOTAL2 - Similar Upward Moves Comparing a previous bull run on TOTAL2 with the current one we are experiencing
Similar rounded structures formed before the breakout on each one
Imagine if it continued up !
I am Bullish

TOTAL2Break of mid (of the whole move) in TOTAL2 last cycle led to three consecutive weeks chop about the mid, testing demand, before reclaiming mid as support and closing at highs by end of third week...
What if, just as was the case last cycle, we are now in third week of chop about the mid
Simply reclaim and sned highs by end of week
