#TOTAL2 #AltCoins #Short #Crypto #Market #DUMP #Soon #Eddy#TOTAL2 #AltCoins #Short #Crypto #Market #DUMP #Soon #Eddy
(("My analysis of Total 2 and altcoins is like this, from my point of view, it is possible to track the position of short selling transactions on most currencies in the market."))
- What do you think? Have you checked Total 2 in this time frame? Write me in the comments!
- My confirmations are based on Wykoff's review of Bitcoin in multi-time frame, as well as Bitcoin and Tether's Dominance review.
Its about Wyckoff ;-)
(( BTC/USD )) latest update link :
TOTAL2 trade ideas

TOTAL2/BTC: The Altcoin Bull Could Get VERY Wild 🚀Hi Guys,
I've been away for the last month because I got banned and so i'll have to learn to save banter for other websites.
This has only affected my TradingView content.
TOTAL2/BTC is a really great chart for identifying the altcoin market cycle.
And while I was away, a very key candle has printed on this chart.
The chart is Bitcoin against TOTAL2. So it is Bitcoin against every altcoin.
This allows us to see the ebb & flow of Bitcoin and Altcoins.
I think that you really have to have a sense of humour to appreciate what is happening here.
In terms of macro market sentiment, we're just taking first baby steps away from the recession narrative with many fundamental based traders were hoping that the catastrophic crash that Schiff, Prechter etc have been pipe dreaming for most of my life without success.
Bond yields have been very high (which I will cover in a new thread soon), rising inflation leading to many rate hikes, and traders have been clinging to charts such as the Inverted Yield Curve that is touted as an accurate recession indicator by many Gurus.
All of which was supposed to be very bearish for asset markets.
But yet, under unwitting noses the crypto bull market has been sprouting and what I'm showing you here indicates that it is not only coming into full blossom, but that a very impulsive bullish wave is now underway.
On the highest time frame, something very exciting appears to be happening.
A long term three wave correction appears to have completed spanning back to the 2018 cycle end.
And the correction is very shallow; especially the third wave that has only retraced to log 0.382; which is a very bullish ratio for continuation.
Interestingly, the last altcoin bull market against Bitcoin began all the way back in 2015 where altcoins pumped a whopping 29539% against Bitcoin that itself pumped 12125% by cycle end.
Now if we come down to a lower time frame of TOTAL2/BTC we can see that a very bullish Dragonfly Doji has printed plumb on the 0.382 retracement of the 2021 uptrend.
We can think of the previous uptrend as a bull market but remember that it may in fact be a shallow correction wave relative to the overall trend.
This Dragonfly Doji contains high volatility whipsaw and it is a shakeout pattern that has formed a pivot that we tend to see at market extremities.
And we can also see this candle expressed inversely as a Gravestone Doji on the Bitcoin Dominance chart:
Following the Gravestone Doji BTC.D is looking bearish; having fallen through the Demand Lines.
Now again considering TOTAL2/BTC, its incredible to imagine that with all the enormous individual altcoin bull markets that happened in 2021, that they may in fact be part of a larger correction wave that would become a continuation pattern for a much larger and more impulsive uptrend...
But that does appear to be what is happening.
And this impulsive trend has begun only in the last few weeks.
It will be the first highest time frame impulse wave since the 2016 altcoin bull market.
2024 may be extremely wild 🚀.
Not advice.

Altseason Anyone?A similar descending trendline has already been broken on BTC, but it remains intact here.


Correction for Alts could be overIn my last CRYPTOCAP:TOTAL2 analysis, I wrote that although the trend for Alts is strongly bullish, a correction could follow and traders should keep a close eye on 700B zone.
Indeed, the market corrected in that zone and at this moment looks ready for a new rally.
My target in the medium term remains 1T and I will constantly update and analyze interesting coins.

total2/totalIn the ratio of total2 to total chart, we are in a long-term range. We will have upward movement of Ethereum and altcoins from the middle of this channel (more likely) or the bottom of the channel (less likely).

0 experience, Alt coin bull market rhyme forecastI just made a trend line from the bottom of the beginning of the chart, then used the fib tool, but brought the dotted line on fib tool in alignment with the trendline (probably not normal way it is used but IDK), and kept extending it out until I reached the top of the price range tool I had already set up from the 2022 bottom candle to 416% higher (5.3 equation made on crypto crew university for calling the bitcoin top (not sure if it has been that equation in the past for Alts tho but i still just used it.)) .... Then just counted how long in the past has the total market cap has gotten and stayed above the trendline i outlined, to try to get an idea of what may happen if the current alt coin market cap rhymes with the past.... I really don't have TA experience so don't look at it for that, just fun to forecast with my own lil twist on it

After ETF approval, selling is likely to continue on Altcoins.Not trying to introduce more FUD. I just want you all to be aware of what continues to occur in the altcoins space. As you have seen my recent video, major levels are breaking everywhere. This continues to be the case and, in fact, even the strongest of the altcoins are starting to struggle. TOTAL2 is showing a break from our ascending channel as we look to retest support below at around 683B. Below that we have our inverse H&S neckline at just over 620B. I can see us retesting that as well in the coming weeks. I will be avoiding altcoin entries this week. Only the most risk adverse may want to play any sort of spike here which would likely follow confirmation of the BTC ETF approval. But I do expect any spike or wick up to be quick, as the market may then sell the news.

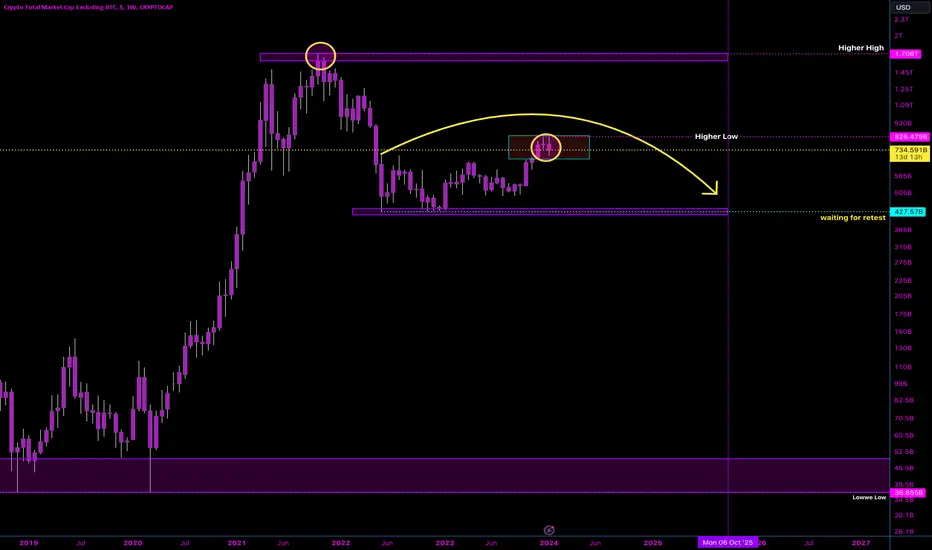
Crypto Bearish Reversal IndicatorIn the dynamic world of trading, it's crucial to decipher the charts and indicators, catching those nuanced market movements. The recent high at 826.479B hints at potential shifts, eyeing a retest at 699.761B and another at 427.57B. ALTS seem poised for fresh highs, and this might just be the opportune moment. Buckle up, fellow traders, and let's navigate these market waters for potential profits!
Alt coin market chart, variation of 2nd chartNo experience.... But, just going off visual trend lines, and putting the fib retracement tool dotted line on same trendline. Then parallel channels trend lines on potential up and down paths. With the keltner channel overlay

TOTAL2As long as we continue to close above first quarter retracement of highs, there's no reason to be bearish. Lots of confluence above around yearly open, which is going to be next major objective for bulls to overcome.
Also, a reminder that your favorite influencers are often, perhaps unintentionally, misleading.

TOTAL2I can see Jan being a cool down/ final accumulatory month where market catches its breath after last 3 months of marking up and prepares for what's next, but to think that there will be meaningful move to downside (having already decreased 20+% on many alts) is wrong imo
If you subscribe to the notion that market topped April 2021, we've had exact same amount of time capitulation as last cycle
We also had first monthly close atop first quarter retracement of previous cycle's high to low, which was the end of accumulation phase in previous cycle
Question is will we see a deviation beneath first quarter (like last cycle's) OR is this simple backtest of first quarter as support sufficient?
So long as continues to close above first quarter you have to remain biased towards the latter.
tl;dr downside is extremely limited, upside is 10x+ total brypto market cap, excluding btc; don't lose sight of bigger picture

TOTAL2 # 002 ( Alt coin season is started , Don’t Drop Behind ) Hello dear traders.
Good days.
On September Long term Monthly Gann Square time frame Finished and after a few days later Altcoin market cap start bullish rally .
Weekly Gann Square validity confirmed .
First Gann Arc resistance broken and after getting support it will start 2nd cycle bullish rally which will be 27-29.Nov.2023.
Road map is plotted with help of Gann Square and Gann Box.
Good luck and safe trades.
Thanks for your support and comments .

Total market crypto is bearish.Becareful for crypto. This is bearish now. wait for retest CRYPTOCAP:BTC someday will retest again. Wait and buy at last deep.
If you like my ideas give a like or comment. If you like my idea.
Check me out for more. Thank you.
👇🏿👇🏿👇🏿👇🏿👇🏿👇🏿👇🏿👇🏿👇🏿👇🏿👇🏿
👉🏿👇🏾👇🏾👇🏾👇🏾👇🏾👇🏾👇🏾👇🏾👇🏾👈🏿
👉🏿👉🏾👇🏽👇🏽👇🏽👇🏽👇🏽👇🏽👇🏽👈🏾👈🏿
👉🏿👉🏾👉🏽👇🏼👇🏼👇🏼👇🏼👇🏼👈🏽👈🏾👈🏿
👉🏿👉🏾👉🏽👉🏼👇🏻👇🏻👇🏻👈🏼👈🏽👈🏾👈🏿
👉🏿 👉🏽 👉🏼 B T C 👈🏼 👈🏽👈🏾👈🏿
👉🏿👉🏾👉🏽👉🏼👆🏻👆🏻👆🏻👈🏼👈🏽👈🏾👈🏿
👉🏿👉🏾👉🏽👆🏼👆🏼👆🏼👆🏼👆🏼👈🏽👈🏾👈🏿
👉🏿👉🏾👆🏽👆🏽👆🏽👆🏽👆🏽👆🏽👆🏽👈🏾👈🏿
👉🏿👆🏾👆🏾👆🏾👆🏾👆🏾👆🏾👆🏾👆🏾👆🏾👈🏿
👉🏿👆🏿👆🏿👆🏿👆🏿👆🏿👆🏿👆🏿👆🏿👆🏿👈🏿
None of this should be interpreted as financial advice, I am not a professional or certified financial adviser! all charts, and or analysis' are my personal opinions and observations only!

#ALTCOIN MARKETCAP MOVING SLOWLY TO A TRILLION!#AltcoinMarketCap is following our anticipated trajectory, bringing us closer to the $1 trillion market cap milestone.
The dip experienced yesterday proved to be a fortuitous opportunity for those who approached it with seriousness and resilience, avoiding panic and capitalizing on the favorable market conditions.
Do show your support by hitting. the boost button.
Thank you
#PEACE

Total 2The recent pullback in the overall market value of Altcoins can be interpreted as a strategic re-test of a crucial support level on a higher time frame (HTF). The HTF support is a long-term support level that represents a significant point in the market’s historical price action.
Currently, the market value is holding above $700 billion, indicating that the HTF support is providing a solid foundation for the Altcoin market. This level is crucial as it has historically played a significant role in determining market trends. The ability to maintain a value above $700 billion suggests a potential resilience in the Altcoin market.
ETH, Ethereum, BTC, Bitcoin. Cryptocurrency, s4style
Looking forward, the next major technical challenge is expected around the $1.2 trillion mark. In technical analysis, round numbers like $1.2 trillion often act as psychological resistance levels. If the market can successfully surpass this level, it could indicate a strong bullish sentiment and potential for further upward movement.
Traders and technical analysts closely monitor these key levels to make informed decisions. The successful re-test and holding above $700 billion suggest a favorable scenario for Altcoins, but attention will be keenly focused on how the market reacts when approaching the $1.2 trillion resistance.

TOTAL2 - Market Cap BOOMThe current structure forming at this low is very similar to the structure that formed very early in the crypto market (45M) which led to a bull market towards (428B). I believe we will see another massive growth period pushing the market cap excluding Bitcoin well into the T areas.

As Expected, We Have Our Pullback! Now We Watch This Closely.Traders,
As predicted a few weeks ago, altcoins have finally met their downside target of 10-15% (see links to related ideas). But this move down will not confirm further downside unless/until we have confirmation to the underside of our current channel. We have to watch that bottom support closely along with the support on our RSI chart. Should one of them break and the price remain on the underside tomorrow through Friday, this can be further indication that more pullback may occur.
This is the healthy correction that I have been waiting patiently for and I am glad to see it.
Stay tuned.
Stewdamus

TOTAL CRYPTO MARKETCAP Repeating Itself ALTCOINS!Looks like the entire altcoin market is about to take a breather for a month or 2 before it is about to go into its parabolic phase.
My guess is take profits around the beginning of Q4 2024.

ETFBe careful, this year is a strange year, if the ETF is approved, the market will do something strange, but at the same time, America's hand will be opened for more legislation and management.
And according to technical and fundamental, many currencies will be zero

total2In this chart, according to the chart's movement algorithm, I can imagine 2 movements, and we also have price reversal ranges

Alt coin market initial bull range (my 2nd chart) so salt grain A fib range from previous trend lines, expected to be in buy zone where it goes up, but my opinions are based off my slim to no experience so yea

🚨Some red today on altcoins.🚨 Some red today on altcoins.
However, trend still intact.
Time for our #altcoins Weekly Analysis
Facts First, conclusion at the end.
----
FACTS
1. Price trading above our RSI red line.
2. Bullish trend support is 20% below current prices.
3. Trend Strength indicator still signaling strong upwards trend.
4. No bearish signal on Rider Algo Oscillator.
----
CONCLUSION
A. As price is trading above red line I am still holding most of my alts portfolio, rotating money from overextended alts that are showing weakness signals into ones that seem ready to take off, reducing risk that way.
B. Expect great volatility as price is 20% above of the trend support, that is why we have huge red days followed by a green day the next one. (support gap fighting the red line), if you do not tolerate volatility then just take profits.
C. Mid term target seems like a matter of time, currently 40% above current prices, this is the main reason I am willing to hold as long as red line remains intact.
Not financial advice.
One signal at a time.
----------
That's a wrap! If you enjoyed this Weekly Analysis:
💙Like and RT this tweet to share it with your audience.
