ALTSthis is a chart of altcoins market cap except for ETH , you can make this chart using TV .
alts now left 500days+ accumulation range , technically , could be a deviation before getting back inside the range . my opinion , is we will continue higher , a B corrective wave to the upside that will retrace a good % of the fall from last bull run ATH . our first target 500B give or take 10% . second one 850b give or take 10% . and after that , probably an aggressive and fast C wave the will give as a wick inside the accumulation range , could be deep into it . ( will update then) .
correction all the way up could take place respectively in : 390-420B - 450-600B zones .
our targets : 450-600B , 50% from here
850-900B which gives 130% from here .
my opinion is that , we will get till the final target which will give 85% - 90% retracement of the fall from ATH to bottom .
refer to my detailed alts previous analysis :
please refer to my alts/btc analysis :
this is not a financial advice . thank you .
TOTAL2 trade ideas

alts this is a chart of altcoins market cap except for ETH , you can make this chart using TV .
alts now left 500days+ accumulation range , technically , could be a deviation before getting back inside the range . my opinion , is we will continue higher , a B corrective wave to the upside that will retrace a good % of the fall from last bull run ATH . our first target 500B give or take 10% . second one 850b give or take 10% . and after that , probably an aggressive and fast C wave the will give as a wick inside the accumulation range , could be deep into it . ( will update then) .
correction all the way up could take place respectively in : 390-420B - 450-600B zones .
our targets : 450-600B , 50% from here
850-900B which gives 130% from here .
my opinion is that , we will get till the final target which will give 85% - 90% retracement of the fall from ATH to bottom .
refer to my detailed alts previous analysis :
please refer to my alts/btc analysis :
follow me :
www.tradingview.com
this is not a financial advice . thank you .

alts against btcafter FTX collapsed , altperp ( ftx alts index ) is no longer valid .
i made this alts index myself excluding btc and stable coins
the chart includes levels and zones to watch for alts/ btc .
this chart is very important to observe alts behavior against btc and chase the best opportunities to long/short or invest in ALTS .
thank you

Understanding DelayVery simple Chart.
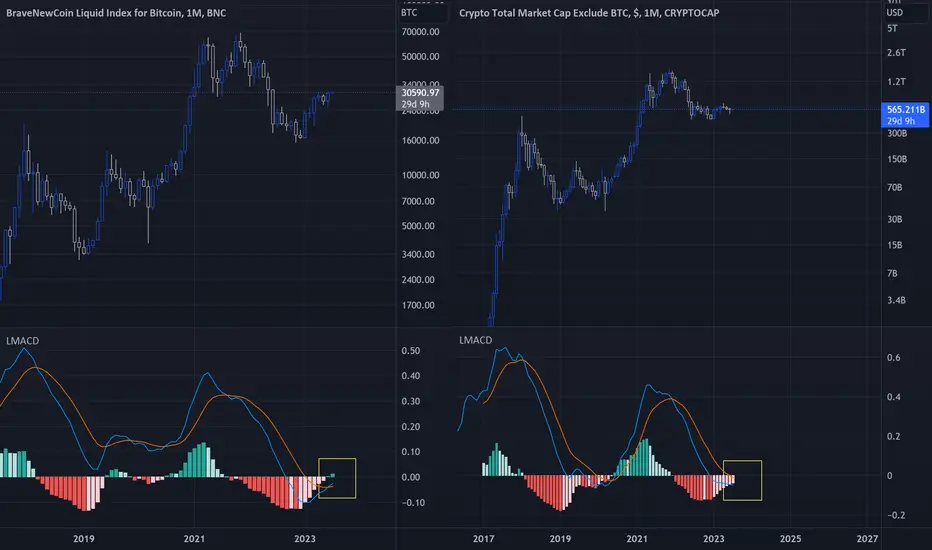
- This graph just show the difference between BTC price and Altcoins Total Market.
- Notice MACD in BTC Chart Crossed up on Monthly Timeframe.
- Notice MACD in Altcoins Total Market Still in Bear mode on Monthly Timeframe.
- So your altcoins will pump, but not yet.
- Have to be patient until BTC reach his new dominance ATH.
Happy Tr4Ding !
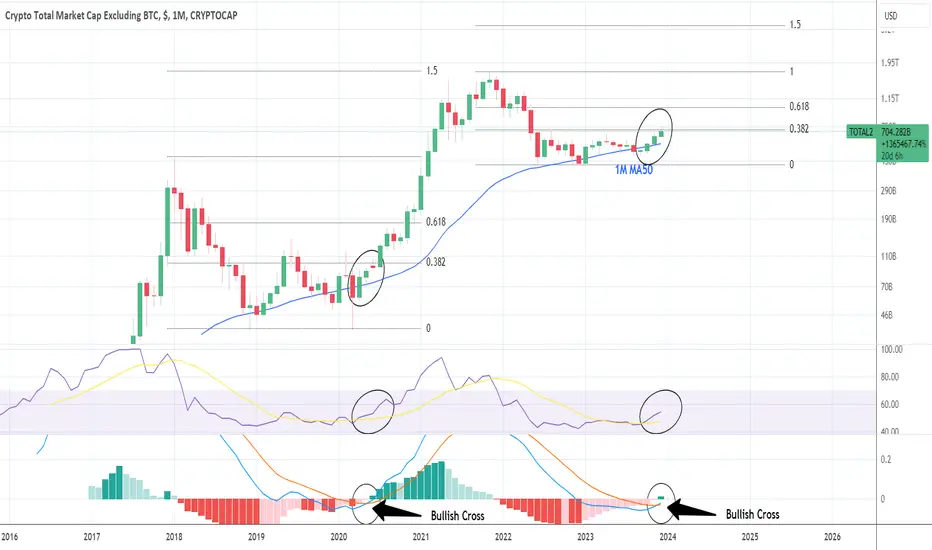
BULL MARKET Forecast TOTAL 2Today i wanted to check out what happened to TOTAL 2 in the last years.
You can see this chart was very easy to anticipate the bull-bear cycles.
If this is true for the next bull-cycle we can see in aprox 6 months from now
a New Bull market may start...
This chart also may be invalidated because it's to easy to anticipate :)) the future
And the big players don't want us to see ...they want to keep us blind and scared.
this would be interesting to watch until end of spring-time 2024
✌️✌️✌️


total2 Daily time frame review and analysisIn checking the TOTAL 2 chart, we notice that unlike the movement of BTC. TOTAL. In addition to the fact that it is not even close to the supply area, it is also failing and stabilizing above a supply level, which is an important indicator that with the recent growth of btc and the relatively lower growth of altcoins, we may suffer in the near future. The movement of btc will witness alt seasens and the strong growth of alts, and it is a very suitable starting point for spot purchases

🚨Altcoins are about to ride the Overbought Wave🚨Altcoins are about to ride the overbought trend.
#Altcoins Weekly Analysis
Facts first, conclusion at the end.
FACTS
Price trading above Red overbought line (good)
Bullish Wave present
Strong Bullish strength indicator.
No Bearish Signal.
CONCLUSIONS
A. Still holding altcoins, as long as candles stay above red line will not TP on most coins.
We saw the same weeks ago with Bitcoin and we are still riding that trend.
B. There is a clear target zone, 50% above of current prices. As long as I don't see bearish signals, this will be the midterm target.
One Signal at a time.
Simple
That's a wrap! If you enjoyed this Weekly Analysis:
💙 Boost this post and share it with your audience.

Altcoins weer aantrekkelijk om in te investeren?De marktkapitalisatie van #altcoins is zojuist de 2-jarige MA gepasseerd tijdens hetzelfde MACD bullish cross.
De laatste keer dat dit gebeurde was in 2020 en het altseizoen volgde daarna.

Alt coins ready to fly!The market cap for alt coins break above the resistance(red line) and retested it. Now it have no resistance until the purple area. Many huge gains on alt coins are expected during coming months. Invest in AI coins like FET and INJ!

Its time to reveal the truth. We about to take OFF !Hey everyone,
Im not that active as I would like to be because Im bussy doing other stuff then just investing and traing but I feel sad for many people turning bearish now so I thought
I might reveal the truth !
This might be a massive BEAR TRAP and that we are going up or pass the 10 Trill exclude BTC in next bull cycle which allready started months ago, but majority dont accept it until they see ATH ( This is where majority of retails start to buy)
When you see media joining we are close to the top ( Just so you know)
Lets make it simple and not overcomplicated with trillions of indicators and charts newbies cant actually even read. FOLLOW THE TREND & THE MONEY FLOW
For thoose thinking this is some random :shit: I dont appear here everyday but on important events to try rescue as much people as possible.
Stick with the long term plan and stay SAFE !
Keep in mind that there might be a pullbacks/corrections but that doesnt instantly mean the trend is turning bearish so PLEASE DO NOT FALL FOR BEAR TRAPS !
Wish you all the best.
Cheers
---------------------------
R:R, money management, risk, reward, technique, style, trading, bitcoin , bitcointrading, profitable trading, profittrading, profit trading, secret, divergence, bull divergence, bear divergence, divergencetrading, divergence trading, trading strategy, how to trade bitcoin , bitcoin trades, bitcoin trading, make profit, take profit, trading strategy, trading technique, successful, successful trader, successful technique, successful strategy, successful secret, how to trade, trend analysis, technical analysis , indicators, rsi , relative strenght index, let it rain, successful life, easy strategy, easy trading, easy technique, make money, crypto investing, investing, crypto, cryptocurrency, cryptocurrencies, mentoring, money, chartart, beyond

Here's What Needs to Happen Before I Grow Interested in AltcoinsTraders,
We've done great with 22 winning trades in a row, exiting just before this little pull back. I wanted to bring you a quick update to show you what I am waiting on before I grow interested in re-entries into my altcoins of choice again.
Stewdamus

TOTAL 2 - I am still not FOMO.
In my opinion, TOTAL2 gives one more (last chance) to people to enter. T2, has hit the ceiling of the box, and it might come all the way down to the middle of the box or 0.13 level of Fib (i.e., $520.5 Billion).

CRYPTO: Brace for a big Alt Season.All critical indicators have been aligned perfectly for a new alt season rally. The price is now over the 1M MA50 and on the 0.382 Fibonacci level from top to bottom. The 1M RSI is at 55.000 while the 1M MACD just made a Bullish Cross. The last time all those took place together was on June 2020. That was at the start of the Cycle's parabolic rally and this was only one in a total of two red months until May 2021 (9 green months in a total of 11). We can't get a stronget buy signal in the crypto market than that, a clear sign that this is probably the last opportunity to invest in the market for extraordinary gains.
## If you like our free content follow our profile to get more daily ideas. ##
## Comments and likes are greatly appreciated. ##
#ALTCOINS are about to surge higher than your expectation!#TOTAL2 : Altcoin market cap retraced to the local trendline support we plotted a few hours back. Continuation is highly likely from here.
Now isn't the time to be scared of the dip; these are opportunistic moments.
My plan: I don't want to buy in aggressively right now. Instead, I'll ladder in partially in case we hit the lower support of $630 billion.
#CryptoNews 📈

Alts coin Season Good day everyone
After carefully taking a look of this chart I think I once BTC stays above 35K and ETH holds 2200 we can start an alts coin season or maybe already enter phase one of the season when we broke out form the descending triangle. The target of the breakout is measure form the bottom of the triangle to the highest point and this will give us a target close to TP1. Depends on if we consolidate around that range we can push forward to TP2 to TP5z

Are you playing your cards right? #ALTCOINS🚀Are you playing your cards right?🌟
Altcoins must continue to rise while #BTC either moves sideways or corrects and maintains a sideways trend.
I will not give up on my altcoins for 3x to 7x gains while it can go 50x to 100x!
The chart you see below this post is like a lottery If you know what I mean! Things have changed my friends and you need to go with the trend.
I will be focusing on the latest narratives that drive the trend, whether it's RWAs, Gaming, or AI.
You need to adapt to the trend.
💡 Let's learn from past missteps avoid taking random trades and move strategically.
Money is transient, but the next 2 years hold life-changing potential.
I'm dedicated to curating a portfolio of top-tier altcoins.
💡 If you are new, stop being degen, This is the best advice I could give you.
🔥 Bookmark this post!
Follow me and repost to know my carefully chosen altcoin picks.
Together, let's make the next 2 years not just profitable but extraordinary!
#altcoins

Altcoins are looking to pullback 10-15% soonMore of a caution here. Alt bulls are starting to lose a bit of steam here in overbought territory on the RSI. I can't go through all the charts rn but they are all looking fairly similar, overbought on the daily RSI and looking to test major levels of support on the underside. Do what you will with this information but for me personally (as my followers know), I have taken quite a bit of profit off the table yesterday afternoon and this morning. I have moved my stops up to be in the profit on most of my trades and as I look through my current positions I am considering more action to ensure I exit appropriately if we get this pullback the charts are showing.
Again, I don't expect anything major. As you all know, I have stated that BTC should be going sideways to down (at least according to the technicals) over the next few days to weeks. This will give ALTS a bit of a chance to catch up more. But before this happens, bulls may need to catch their breath.
Best,
Stewdamus

Alcoins- Is there still room for growth?Lately, many altcoins have risen above important resistance levels and gained a lot. So, a key question pops up: Can they still grow more? I believe so, and the chart shows why.
Looking at the chart, after hitting a low in 2022, Total2 CRYPTOCAP:TOTAL2 stayed in a range between 432 and 674. After the second resistance touch, it found new support at 500.
December started with a breakthrough above resistance, and now we are at 750 B.
With people feeling optimistic about the crypto market again, the most likely scenario is more growth.
As seen in the chart, the next big challenge is around 1 T, which is about 40% higher from where we are now.
To sum it up, the smart move seems to be buying altcoins when their prices drop (during corrections), especially near support levels. This way, you're in a good position for potential gains, going with the current market trends.

ALTSEASON Get ready for a game-changing rideTOTAL Market Cap is on the breakout.
Looks like we're inching closer to the official ALTSEASON 2025.
The real fun is about to kick off.
Total 2 Breaking out.
Get ready for what could be a game-changing ride!
Did you find this crypto market analysis helpful? Stay updated about the latest crypto market update.
Please continue to follow my analysis and feel free to ask any queries, you may have. I am here to assist you.
TradingView: @FarmanBangashh

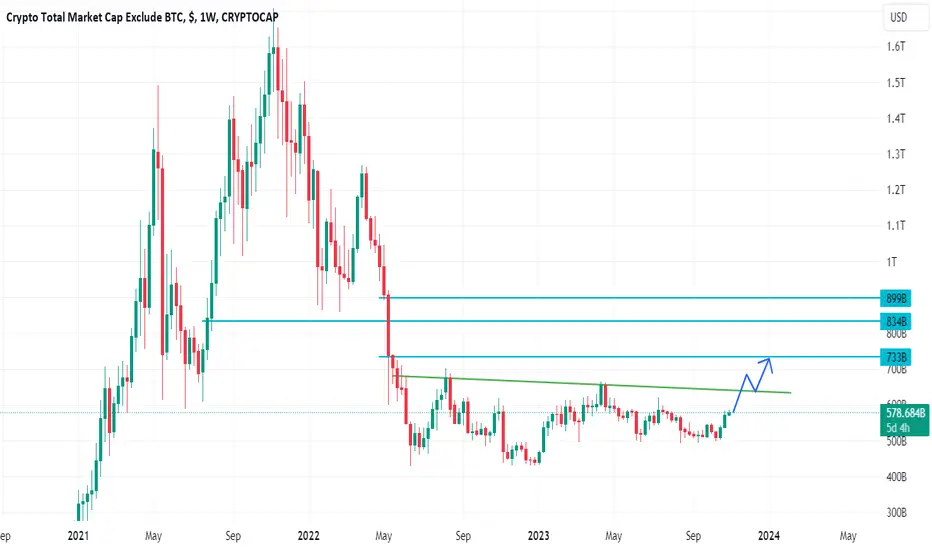
TOTAL2TOTAL2
TOTAL2 is the total market capitalization of cryptocurrencies, excluding the total capitalization of BTC.
On the chart, after a long accumulation since May 2022, we see the first glimpses of growth. 2 week green candles.
For further growth, we need to break through the green resistance and gain a foothold above it. After this we will be able to take the following targets: 733 - 834 - 899
If this happens, then we will see how all the alts will start shooting. In case of updates, we will definitely inform you.
Don't forget to show your support by like(rocket) and comment✅
TOTAL2 Crypto Market Cap Bearish StophuntCurrently, there is a Bearish 12H and daily stophunt on the TOTAL2 market Cap, which is TOTAL minus BTC.
TOTAL2 is not showing a 3day Bearish stophunt like TOTAL is showing..
Stay tuned; likely to be a bloody weekend, but it may present us with some opportunities.

