#altcoins will have a blood bath?Here' s the #altcoin #totalmarketcap incl. #ethereum . This chart shows , altcoins' market cap have come to the top of the channel. Declination here is will doom altcoin bag holders. Clear breaking channel with volume and weekly closings is the invalidation. I showed the support levels on the chart. The war is not good for markets, a friendly reminder. Always use stop losses. I don' t say buy or sell , always train yourself and this is NOT FINANCIAL ADVICE.
TOTAL2 trade ideas

one more dip on Eth.Alts Capbullish divergence forming one more dip can signal the bottom for alts before we move up to alts coin season.

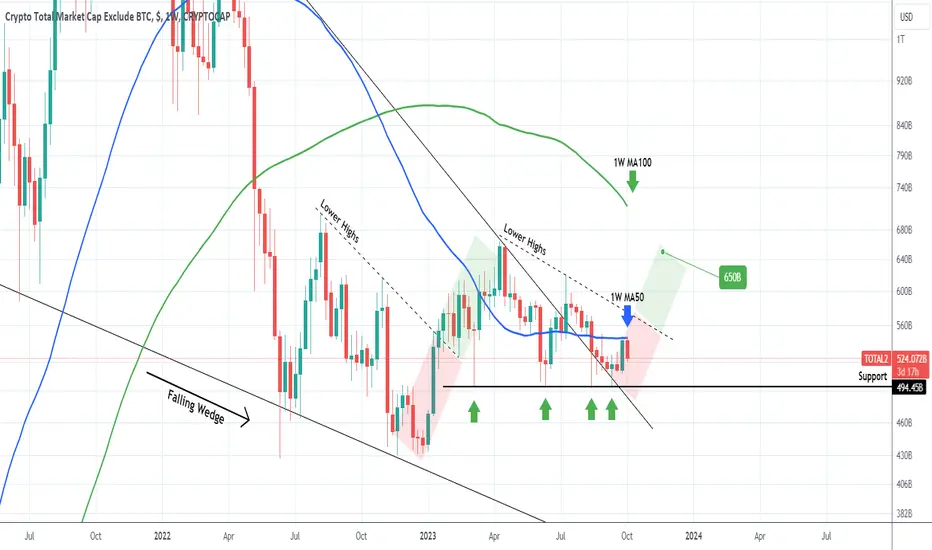
ALT SEASON underway and this Support shows you WHY!Looking at this chart, it becomes more obvious how the alt coin market, which broke this Summer above the Bear Cycle's Falling Wedge, is preparing for a big move upwards. The 494.45 level has been tested 4 times and emphatically held on all as it provided rebounds that left large 1W candle wicks behind.
The latest was on September 11 but stopped last week on the 1W MA50 (blue trend-line). A 1W candle close above it opens the way for a Lower Highs test, similar to January 09 2023, which when it broke it started the 2nd part of the rally.
There is only one long-term Resistance left from the Bear Cycle and that is the 1W MA100 (green trend-line) that is intact since May 09 2022. This what the markets target should be, we estimate a potential contact at 650B, by the end of the year.
-------------------------------------------------------------------------------
** Please LIKE 👍, FOLLOW ✅, SHARE 🙌 and COMMENT ✍ if you enjoy this idea! Also share your ideas and charts in the comments section below! This is best way to keep it relevant, support us, keep the content here free and allow the idea to reach as many people as possible. **
-------------------------------------------------------------------------------
💸💸💸💸💸💸
👇 👇 👇 👇 👇 👇
Altcoins will breath againhistory repeats itself , same waves as previous cycle which again i believe altcoins outperform bitcoin by far percent , covid crash delayed wave 9 play but nothing will stop the trend ,theres a green box which i believe its accumulation zone and be break upside soon enough , lets see how it plays .

Hunting for A Few Altcoin OpportunitiesTraders,
In this video, I am cruising through my altcoin list. These are a few alts that I enjoy trading. We'll look at setup opportunities, technical patterns, and discuss potential entry prices. Hope you enjoy.
Stew

First 30B is in within 9 of days sharing my previous postThere is potential for more as previously mentioned. DYOR.

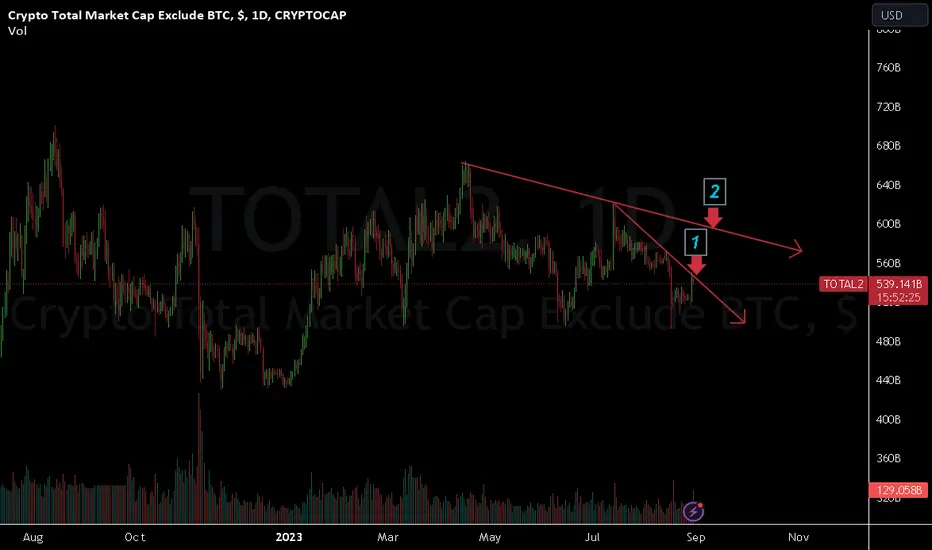
TOTAL2 - Falling WedgeA large falling wedge structure which is a bullish structure
This will be a break out of a larger long term structure that the falling wedge is encompassed in
The structure on the Weekly is quite flat, we might see Uptober for bitcoin and altcoins.

uptober!!!altcoins really trying to make a break out here, been holding support and needs to make a decision this month. break support or falling wedge

CRYPTO TOTAL 2For a bullish continuation on altcoins, it is necessary to retrace above the broken trend line and then break above the devil number and then confirm as support.
Otherwise, there is a very real possibility of the start of flushing into the sewer.

Alts first plan200B will enter into Total2 within months and we are about to see the first 30B in the upcoming days/weeks.

Alcoins in danger but opportunities to accumulate
Hi all,
I would like to update my previous analysis for alcoins. This new one give similar outcomes: altcoins are still bleeding and will do more. The reason is shown in chart: a H&S pattern was formed. The break-down of the neckline will trigger the way down to the support trendline of the descending channel.
The only adjustment (wrt to the original one) is the new timeline where I expect a buy zone at the end of this year 2023 until the BTC's halving (end of April 2024). Certainly, this timeline is average estimation for all altcoins and it may change depending on each altcoin.
What do you think about this analysis and what is your view on altcoins, in general and on a specific altcoin in particular?

A Possible Scenario TOTAL2Good evening friends,
It was a little while ago, I was trying to compare situations and look at it in a way that made sense to me and how I should approach this accumulation period on the market.
Sometimes its tough to call a time period distribution or accumulation, but we still try and play the game based on what we see.
With that being said, I marked on the chart what I believe was accumulation before the last bull market, and if it is repeating it would mean we still got a little while to go before the boom.
Which correlates with the cycles we've had before.
I hope you find this useful.
Trade thirsty.

ALTCOIN MC update ; looks... badALTCOIN MC update ; looks... bad
zoom in, you can see momentum is rolling over to the downside;;; again.
its all just getting dragged out this time. which sucks because that prob means massively long lame asf bear market.
good aspect of that is it gives you time to accumulate shit coins that will survive.
aim for the ones with LONG dev runways who maintain development. thats it. the only two things that count.
everything else will die or barely survive and only half ass pump next time.
*activate hybernation mode
*apply for mcdonalds job

HAMMER TIMETotal 2 has almost printed a hammer, falling slightly shy of the mark with somecandle body just below the 618. It has formed at the VPOC and will likely get strength from the ETH hammer. Stay sharp!


total2Total Index Two Crypto Total Except Bitcoin
The overall status in the weekly descending time - RSI is also within the Birish area
The point we have in the past is that the candlestals are only infiltrated into the area and move upwards after a few re -candles and above the range.
For now, we can expect to have a re -test of the 2, which could cause a further downward trend for the queen, and may be expected to climb after reaching this range, but with re -examination.

Altcoin Market Cap Potential through Wyckoff Analysis 📊🚀📉 Wyckoff Analysis Refresher: Wyckoff analysis is a method for understanding the phases of price movements in markets. It encompasses Accumulation (a period of smart money buying), Markup (bullish phase), Distribution (smart money selling), and Markdown (bearish phase).
📈 Applying Wyckoff to Altcoins: We can adapt Wyckoff analysis to the altcoin market. Accumulation represents the phase when astute investors accumulate altcoins at low prices. Markup follows, with prices surging as the broader market catches on.
📉 Distribution and Markdown: After a substantial rise, we may see distribution, where early investors start selling. Markdown is the subsequent bearish phase when prices drop.
🚀 Assessing Market Cap Potential: By analyzing altcoin price movements within these Wyckoff phases, we can gain insights into their market cap potential. If an altcoin is in the Accumulation phase, it may have untapped potential as smart money accumulates.
💡 Key Takeaway: Wyckoff analysis can guide your altcoin investment decisions. If you identify an altcoin in the Accumulation phase, it might be a promising long-term bet. But remember, thorough research is crucial.
🔮 The Future Unveiled: Keep in mind that markets are dynamic, and past patterns don't guarantee future results. Wyckoff analysis is a tool to aid your decision-making, not a crystal ball.
In conclusion, applying Wyckoff analysis to the altcoin market can provide a unique perspective on market cap potential. Recognizing which phase altcoins are in can help you make more informed investment choices.
Stay analytical, stay vigilant, and remember – understanding Wyckoff principles can empower you to navigate the altcoin landscape with a strategic edge! 🚀📈
❗See related ideas below❗
Follow + Like this post and share your insights in the comments; your engagement fuels the creation of valuable content! 💚💚💚

TOTAL2 ANALYSISCurrently, it is trying to hold above the EAM200 and trading below the descending trendline.
We've to keep an eye on a solid breakout of the descending trendline which would be a further bullish confirmation after news

TOTAL2Hi, look at my previous analysis and gain your profit :https://www.tradingview.com/chart/TOTAL2/wiOqP9Jb-TOTAL2/
.....me personally took some of my profits off the table like polka dot but i think due to big bounce in bitcoin we can see second target in total 2 .....then we can take off some or profits but let our other coins like uni swap and ltc run more .....
Good luck
TOTAL 2 S&R>>>>>>I Have Tried My Best to Bring the best Possible outcome in this Chart.
In 588 long and below 480 short.
For short term trade setup.
All important support and resistance's in Short -Mid - term marked on the chart.
It's Not a financial advise.
PLZ DYOR
With hopping succes

Altcoin Cycle TopsAlthough everyone is currently in search of the 'Cycle Bottom', I thought it just as interesting to point out an observation on the TOTAL 2 (Market Cap without BTC) chart, which has the potential to be a big insight into the next 'Cycle Top' for Alts.
Although some Alts may have topped in May '21 (before the feeble 'blow off top' we had in November '21 last bull run), I think this chart could still be intuitive for ascertaining an edge to taking profit next time round.
It's intrigues me to see that the last 2 Altcoin Market Cap 'Cycle Tops' indicated on this chart, have come 550 days (78 weeks) from the previous Bitcoin halving!
Granted, many macro factors come in to price at cycle highs and lows, but the 'Bitcoin Halving' will always be the most influential pivot when ascertaining Bear and Bull trends in this space.
If this is anything to go by, October '25 could be the next Altcoin Top should history wish to maintain recent habits.

One big glance at all ALTCOINS Bullish or Bearish?In this video i analysed from top to bottom what to expect for the altcoin. There are 3 scenarios in total one being bullish in a short to midterm and 2 bearish in the mid-long term.
This analysis takes into consideration the classical analyst view and the price action analyst.

TOTAL2Hi everybody ,, as you are seeing on my chart ,,, i will unload my all nibbling alts positions around that TOTAL2 resistance......
Good luck
