TOTAL2 trade ideas

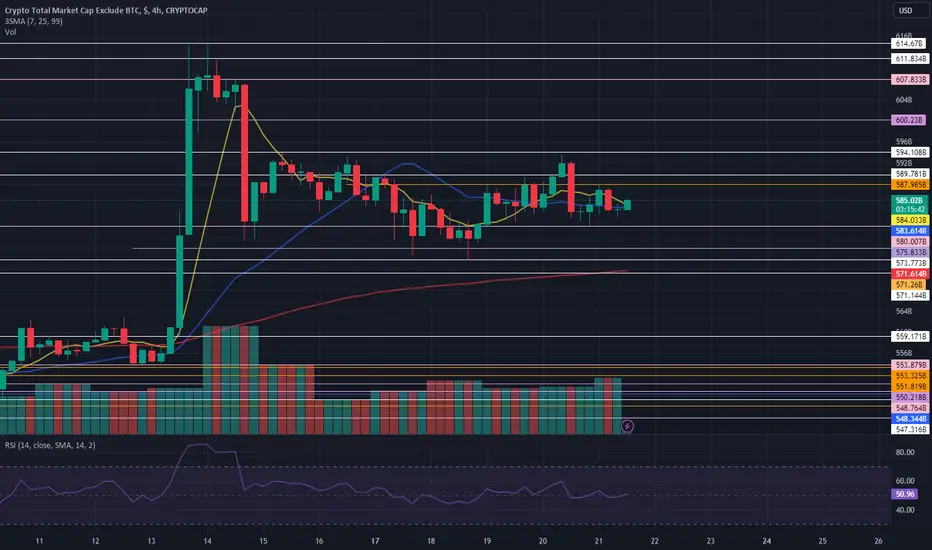
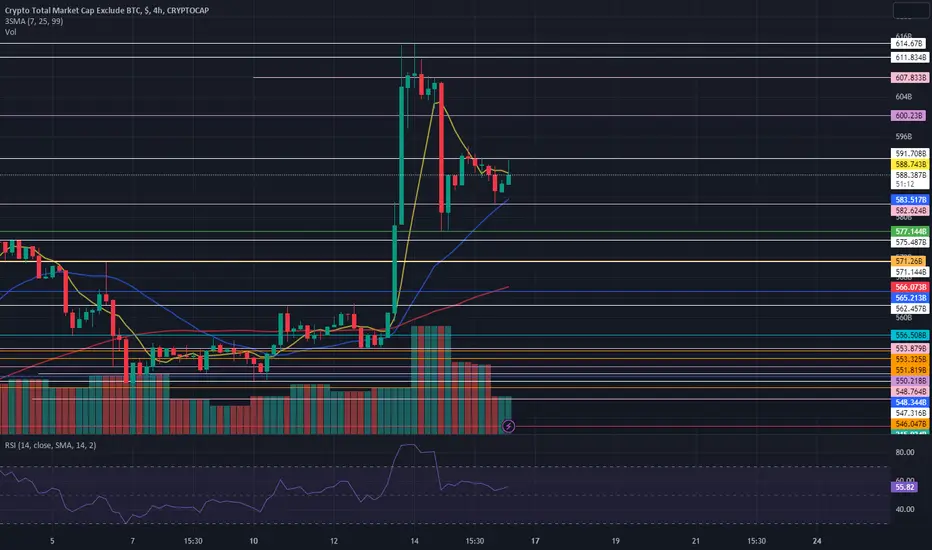
Total 2:Below 565, open a short position, above 580, open a long position. These two confirmations of Safe Total today are Bitcoin itself and don't check for long. Today, short positions are for coins.
Algo, MANA, zil, dydx

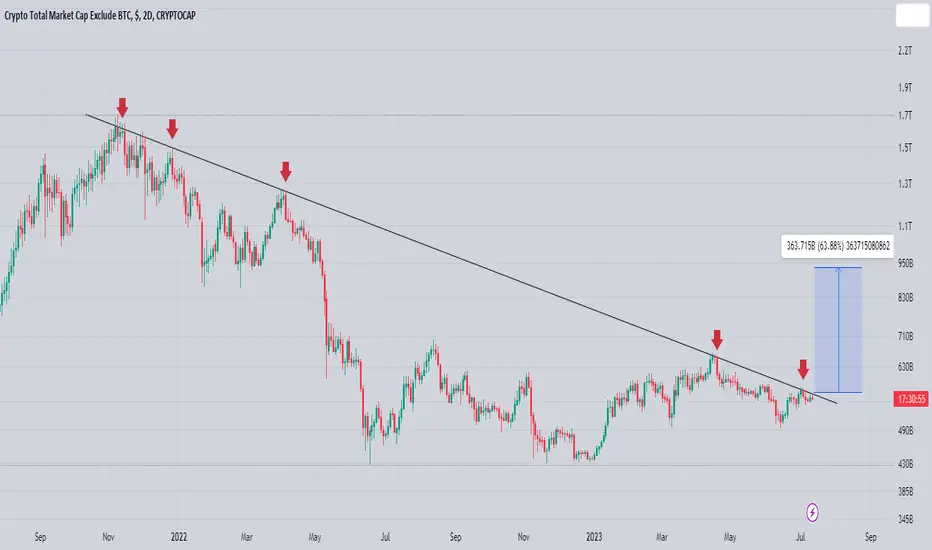
Altcoins - Still Look Ready to Rally I will post an update on TOTAL 3 as well, but here is TOTAL 2 (alts excluding BTC). Just to back track, we made a post on May 22, 2023 outlining how TOTAL 2 was maintaining our old resistance trendline as new support. This remains true. Even with the SEC attack against altcoins they were able to hold the candle bodies as support upon our trendline and have caught a bid ever since. Here is a link to that post.
Current day we might be seeing a breakout on the 2W chart with a smaller fractal pattern. We see something very similar to the 2019-2020 Fractal pattern, just in a more condensed time period.
In 2019-2020 we formed a clear base for TOTAL2. This was constructed around $37 billion and had a double bottom at FWB:37B during the covid crash. We also formed a very clean symmetrical triangle (orange trendlines). Once we broke out of our triangle, marketcap came back down to test old resistance as new support and after that the bull market began.
Current day, we formed a clear base around the $430B level and had a double bottom during the SEC Security FUD at $430B. The $430B level was also our top in 2017 so it is creating a massive base of old macro resistance flipped into new macro support. We have also formed a symmetrical triangle (orange trendline) that marketcap recently broke out from. Marketcap is currently testing our trendline of old resistance as new support. If successful, we could see a large resurgence of altcoins.
The only difference is if we do have an expansion of the altcoin market I do not think it will be the start of the bullrun as we saw in the 2019-2020 cycle. I think it is a little to early according to the 4 year cycle theory. I also feel we have not seen true capitulation of altcoins. Will keep you all updated with the TOTAL cryptomarketcap as more developments are made in the charts.

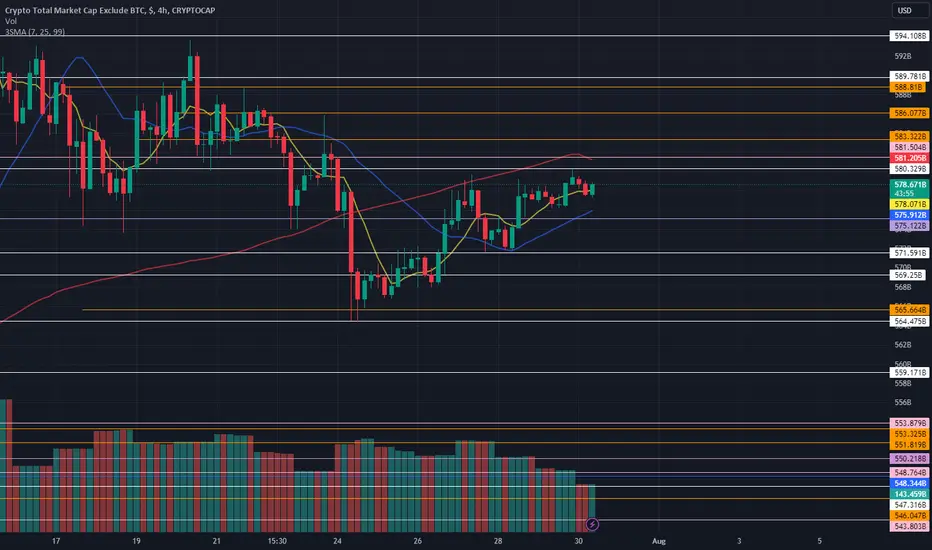
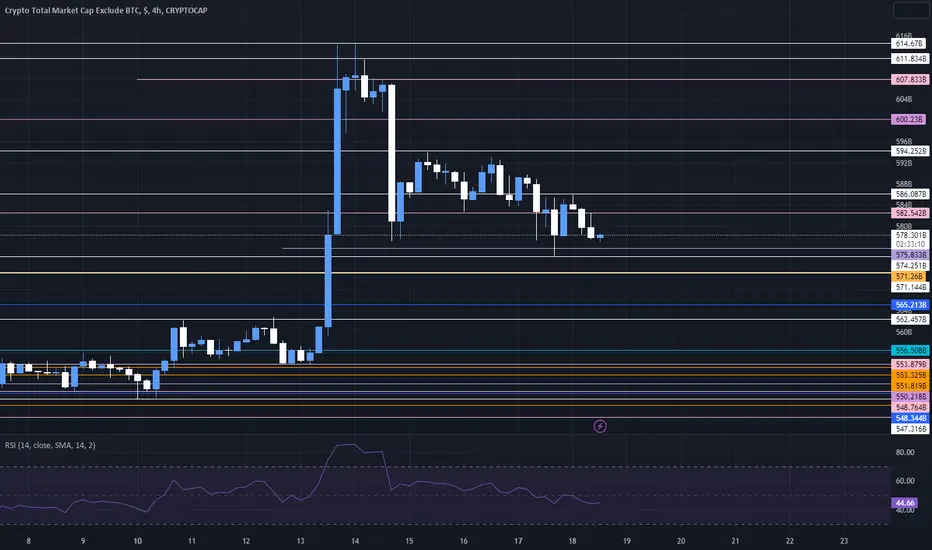
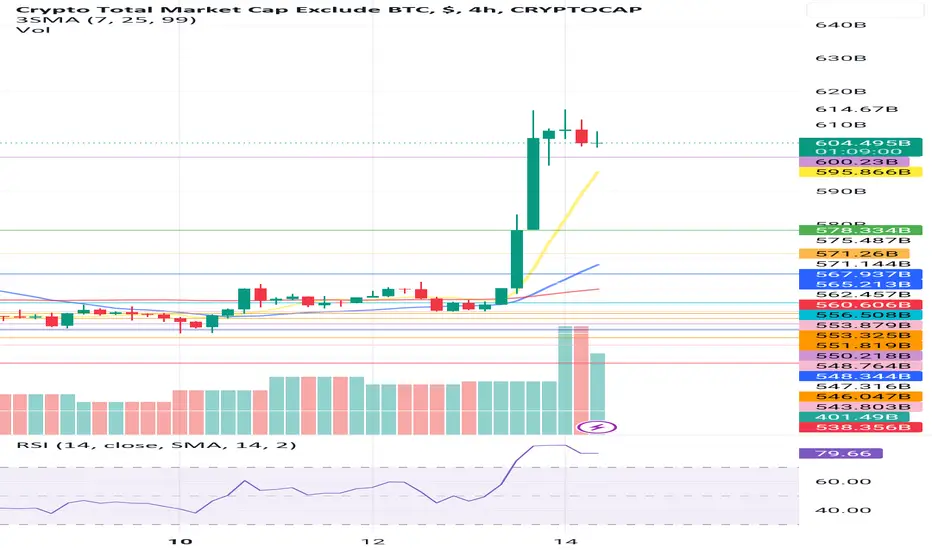
Total 2:Open a short position below 564, open a long position below 566, above 578, just wait for it to get rejected once, then it will be safer to go long.

TOTAL2 Altcoins Market Cap 1WWe have a Falling Wedge formation on weekly chart. Send it if we do break out the pattern, otherwise 438B level is coming.

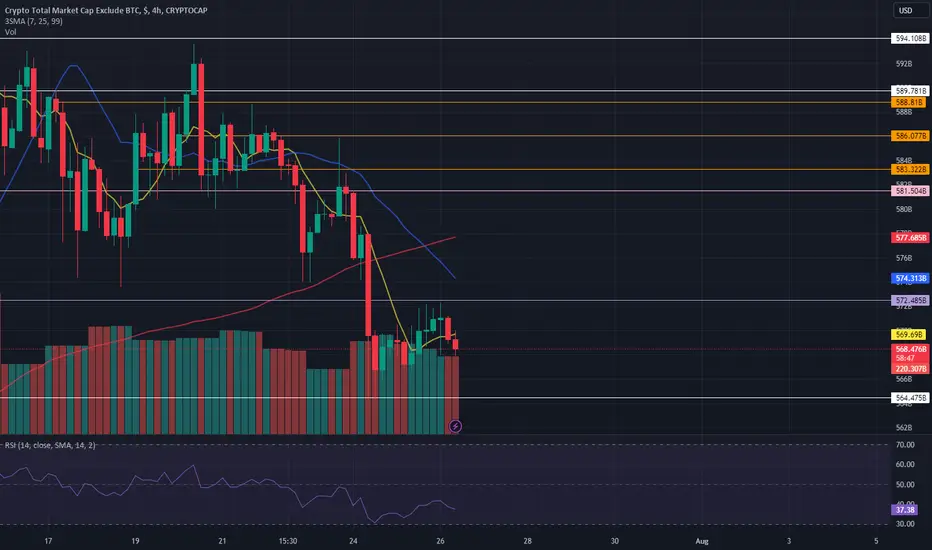
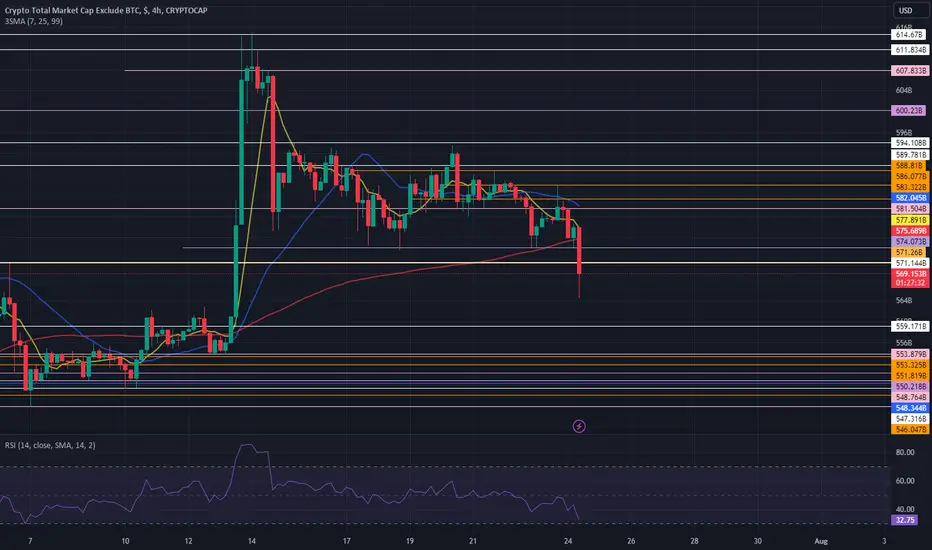
Total 2:old bitcoin and old ethereum and you get confirmation that the market itself is bullish, then there was resistance, then you open a long position, just like that, there is no confirmation for a long position, total, open a short position below 574
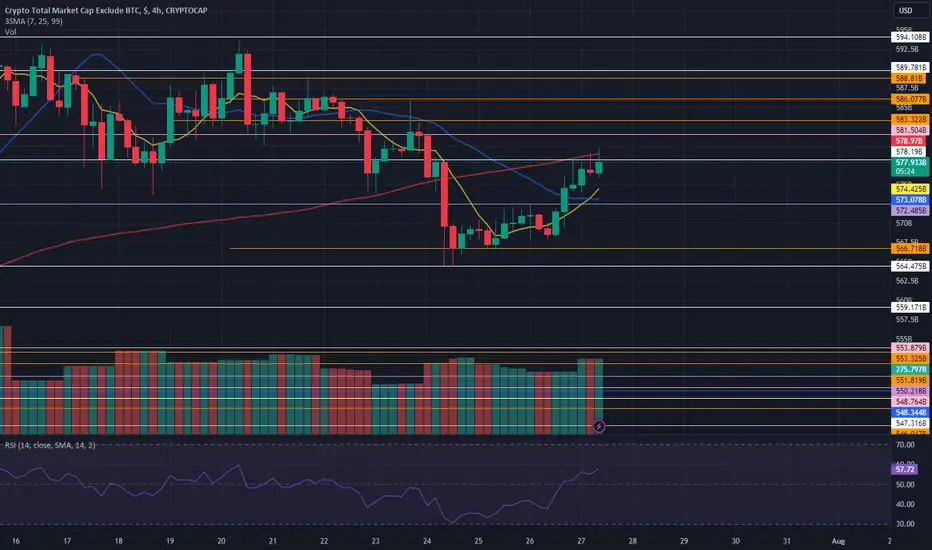
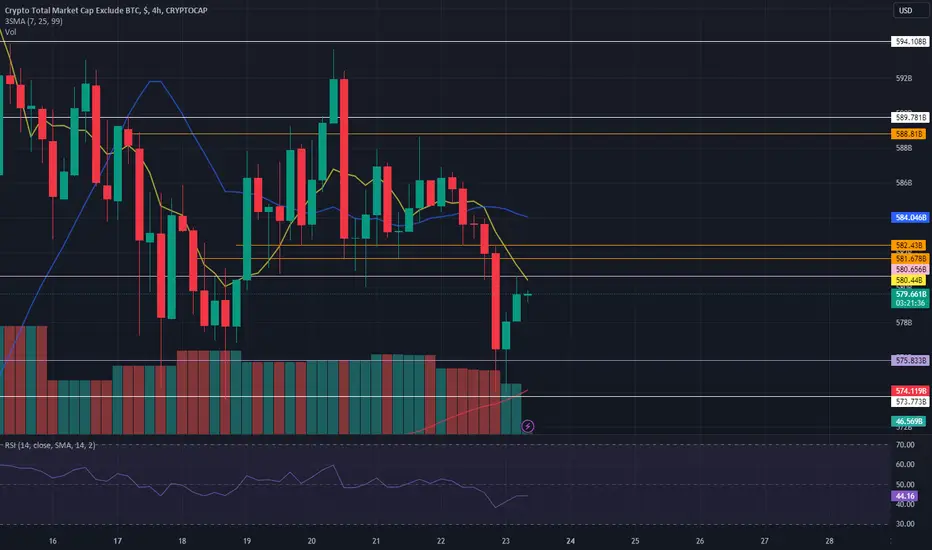
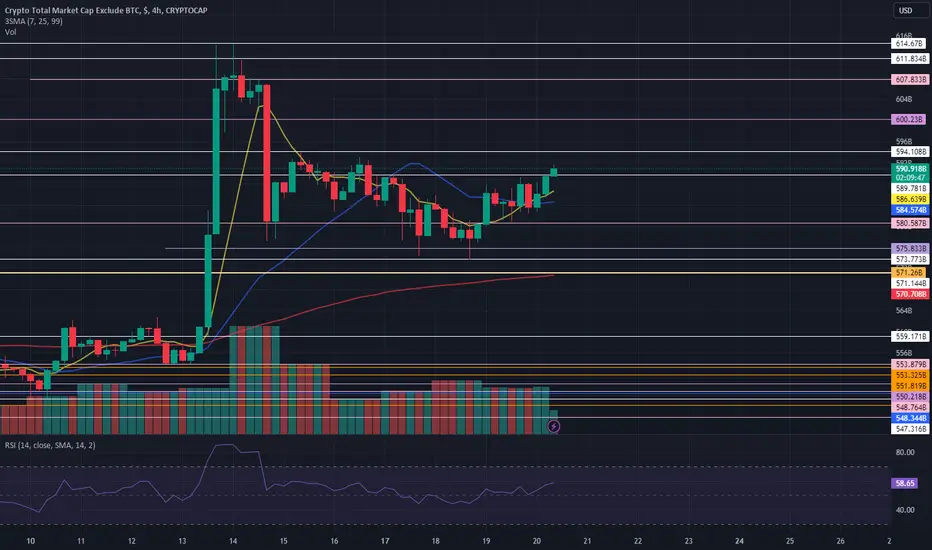
Total 2:Open a long position above 592, open a safe short position below 573, but you can take a risk below 575, you don't have total confirmation, open a long position for now
Total 2Total 2 coincides with BTC. We should also have completed the Flat correction. I expect a move up to the 881B zone.

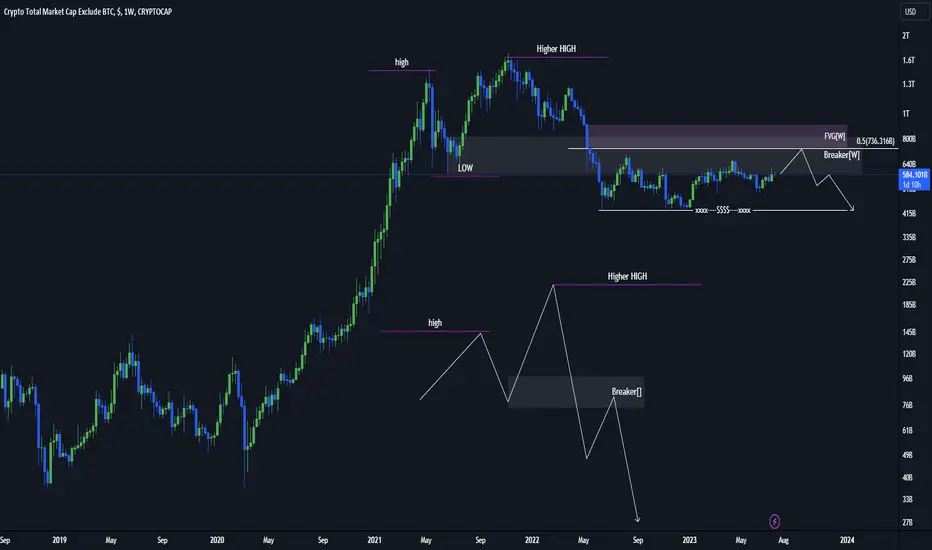
Bull trap incomingObserving the Breaker formation on higher time frames for both Total and Bitcoin, it appears that Total 2 may trade up to the weekly fair value gap before experiencing a decline. Considering this, I believe it's prudent to exercise caution and refrain from making new entries until we receive clear indications of candle patterns above the Breaker formation.
In light of this analysis, I've decided to book some profits in some of my coins and adopt a wait-and-see approach to assess how the market reacts to the Breaker formation. During this time, I'll implement strict stop-loss measures to mitigate risks. As the days pass and the market approaches the Breaker level, I'll gradually reduce my exposure, further minimizing potential risks. I'll consider re-entering the market only when I witness a clear and distinct bullish movement taking shape.
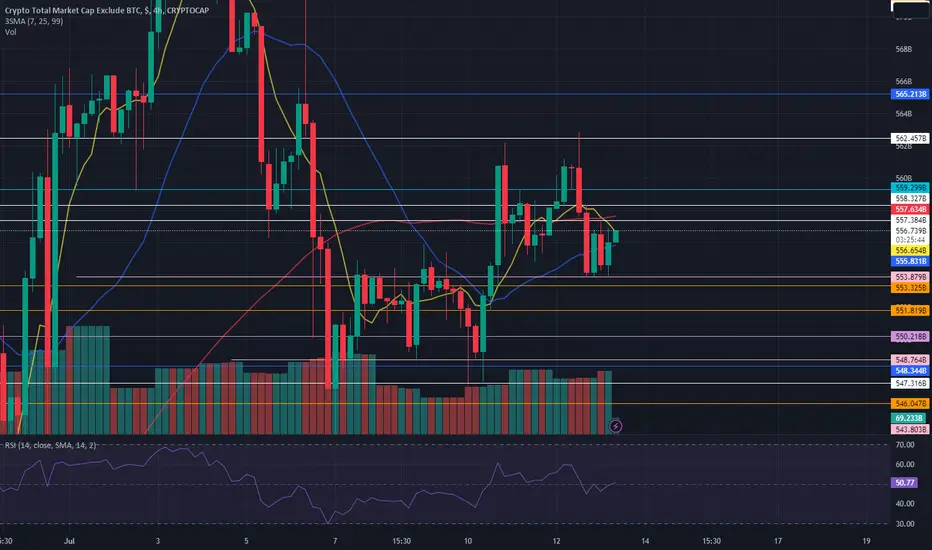
Total 2:Above 594, open a long position, below 573, open a short position. We are in a triangle. When it gets stuck like this, the market will bother you. I think it is better to be a spectator like you.
TOTAL2 CRYPTOCAP Once again at the 21W MA.
What will happen next? I know what I will be doing: waiting for the system to give me another entry signal.
Se you soon

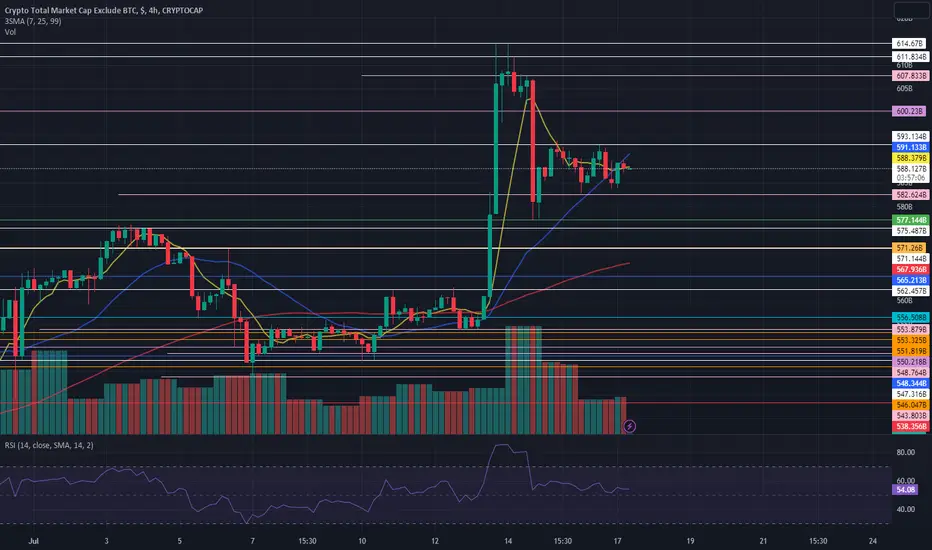
Total 2:Descending range, but open a long position above 593, open a short position below 577, if you get a long confirmation, open a position from Total 2 coins that are old to Bitcoin.
Total 2:After 591, open a long position, open a short position below 582, just pair it and you have to stabilize it.
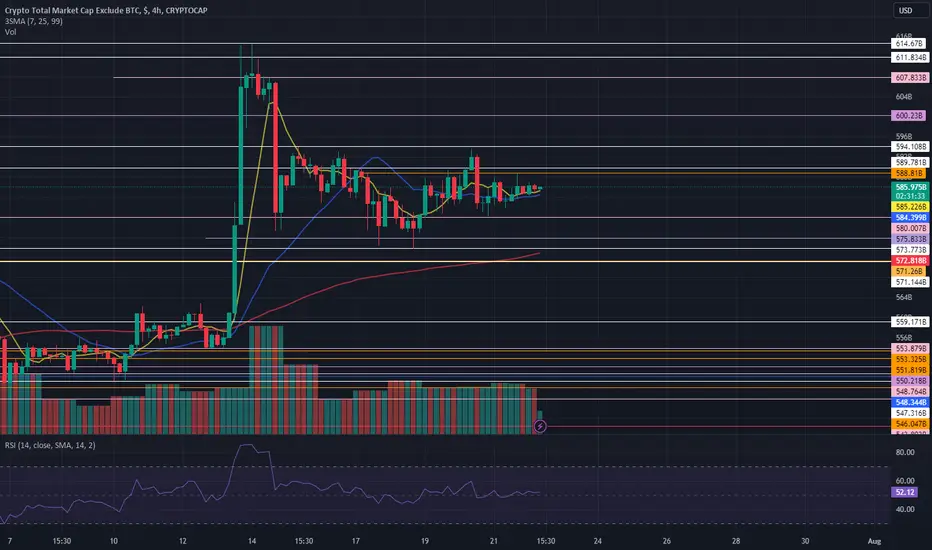
Total 2 :We are almost close to Bulleran, but it is not confirmed. It will be confirmed after 648 and then Dominance Tether will come below 6.48. We are ready for the market to go for Bulleran. For long position, open above 614 for short position below 556.
TOTAL2(Altcoins)Hi, compared to last post about TOTAL2 :https://www.tradingview.com/chart/TOTAL3/4GKYIsCh-bullish-on-some-alts-really-short-term/
now I think it is risky area to going long on many ALts and caused by that i opened some shorts like eth and sol ,,,,, you see in chart total 2 pull back to trend line and i think next week will not be good for ALts ....
stay cautious.

Crypto Alts On Verge Of Massive Breakout Altcoins Market Cap Testing Crucial Trend line In 2 Days Timeframe Seems Trend line Is Weak & Cap Building For Breakout Incase Of Breakout Can Expect Massive Bullish Rally In Alts In Coming Days Also Alts Are Breaking Trend line s & Bullish Patterns I'm Expecting Massive Recovery In Alts
Get Ready for 2x Crypto Rally