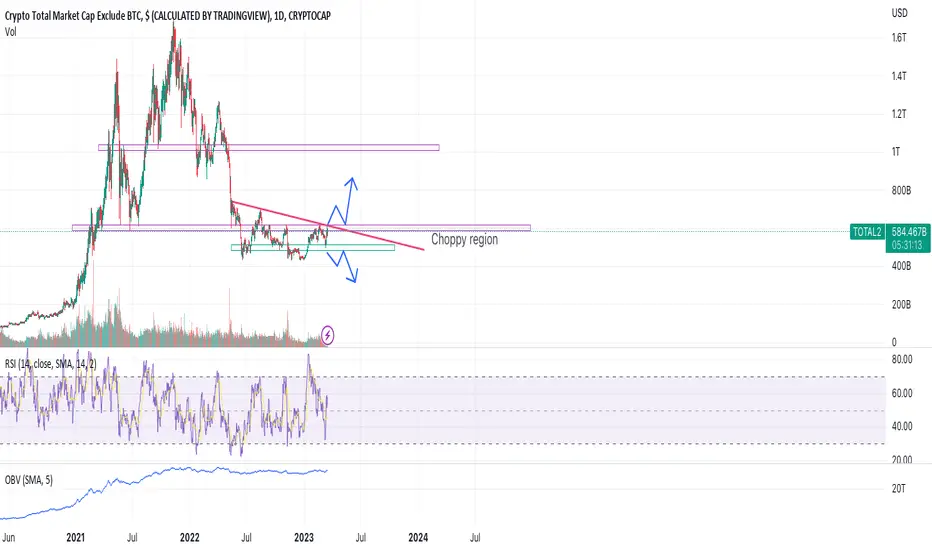
Choppy region for your favourite altsWhile world collapsing, bitcoin shows the strength. People remembered why BTC has invented! Total market cap for altcoins are at the resistance point. If we break this resistance we may see green rockets as we saw in the old days. Otherwise choppy session will continue. Let's pray we don't break down the green support zone.
Disclaimer – WhaleGambit. Please be reminded – you alone are responsible for your trading – both gains and losses. There is a very high degree of risk involved in trading. The technical analysis , like all indicators, strategies, columns, articles and other features accessible on/though this site is for informational purposes only and should not be construed as investment advice by you. Your use of the technical analysis , as would also your use of all mentioned indicators, strategies, columns, articles and all other features, is entirely at your own risk and it is your sole responsibility to evaluate the accuracy, completeness and usefulness (including suitability) of the information. You should assess the risk of any trade with your financial adviser and make your own independent decision(s) regarding any tradable products which may be the subject matter of the technical analysis or any of the said indicators, strategies, columns, articles and all other features.
TOTAL2 trade ideas
KEY support for Crypto BullsAltcap (TOTAL2) is retesting the upward green TL, the blue channel, and has completed an a=c retrace. Great longside R/R here and key support for any further wave up in this manic move!

Total2 update...Imagine the smell of support on the supply zone...
Means a big Altcoin season coming up, when this happens...

CYCLES within Cyclesorange line is BTC market cap
Blue is total 2 excluding btc market cap
so my understanding is when the orange line crosses down underneath the blue line is when we get our mini alt season
as you can see from the dominance chart i posted earlier corn has a lot of room to go before its first resistance
so that basically is confluence for my btc pairs bleed untill btc ranges and money flows to btc pairs
that "mini Alt season" is basically people swapping their corn for lagging or too good to ignore coins
keep in mind they just need a few btc to move them 3-5X
anyways my plan is to secure profit IF the above plays out ( good time to do lever up on btc pairs )
then log off for a while ..
hope this helps someone still trying to figure out the lottle cycles within cycles

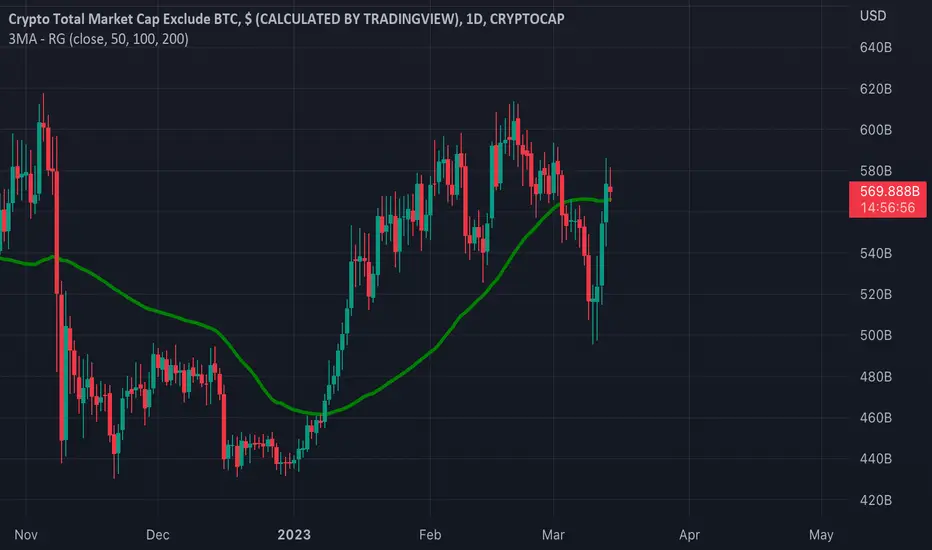
TOTAL2 - Strong Daily PositionStrong daily price point above the daily 50MA in green
It looks as if the bull is poking its head back out
This is a good sign for the bulls, more ahead from BTC and the crypto market as a whole.
Total 2 possible pathwaysHere are the possible scenarios for total 2 depending on how the macro structure and fud news will head in the near future…lets see how its gonna turn out,Always a student!

TOTAL2 Inverted H&SInverse H&S structure is forming on the altcoin market cap chart
This right shoulder might push the cap much higher and result in a recovery
Chart pattern analysis
Daily timeframe
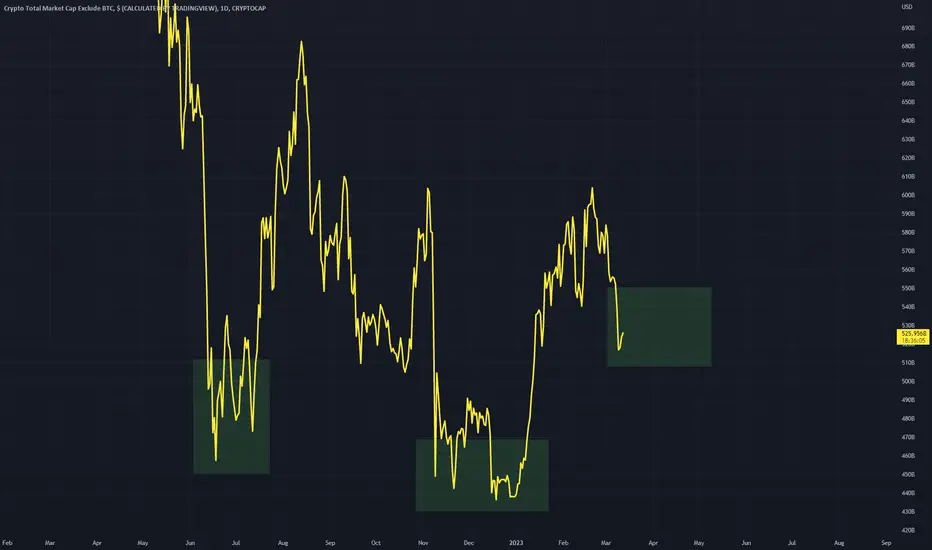
📈 Altcoins On Sale (Buy Opportunity!) | The Law Of Three (3)Did you miss the January 2023 Cryptocurrency bullish wave?
Nobody blames you, it was an easy wave to miss after a very difficult year 2022.
It is normal to become a bit distant, detached, after such a bad year.
The great thing about financial markets is that there is always a second chance, new opportunities, more and more.
Here we have 3 weeks of red already and with each passing days, the prices become better and better in anticipation of the next bullish wave.
Do you think we will continue straight down, forever more?
No, no, no...
The market will recover, print another a new high, a higher high after cementing the current higher low.
The market is giving you an opportunity to load up on your favorite coins.
The Law Of Three (3)
✔️ If you bought and later secured profits.
✔️ If you missed the chance to buy in the previous wave.
✔️ If you just came in now and are thinking what will be.
Just remember to do your own research, build a plan and think long-term.
There is always risks involved but the market rewards those who wait.
Persistence and longevity is key.
Namaste.


ALTS attempting to break the 2 year Falling Wedge!The Crypto Total Market Cap excluding Bitcoin, has been trading within a Falling Wedge pattern for the past 2 years. Being kept from breaking above the 1W MA50 (blue trend-line) for three straight weeks, it appears that as the 1W MA200 (orange trend-line) continues to support, it will start to squeeze the price action and most likely will cause a break upwards as in May 2019. First target of the Falling Wedge break-out is the 0.5 Fibonacci retracement level at 860. Alts are heating up!
-------------------------------------------------------------------------------
** Please LIKE 👍, FOLLOW ✅, SHARE 🙌 and COMMENT ✍ if you enjoy this idea! Also share your ideas and charts in the comments section below! **
-------------------------------------------------------------------------------
💸💸💸💸💸💸
👇 👇 👇 👇 👇 👇

Total 2 #total2
I see an accumulation on the monthly chart and this is how I determine my possible roadmap.

TOTAL2 Bear IdeaA bear idea showing two comparable points
A small rise followed by a larger down move back to the dominant bear downtrend
Lets see if the current bear trend is still dominant or if we have shifted to a bull standard


3 DAYS EMA100/200I have already mentioned that EMA100/200 cross
on a large timeframe is a more stubborn thing than the same MA 50/200.
It's been a very long time since I posted a TOTAL2.
We have 4 crosses in history on this t.f.
1. Golden received in March 2016. The cycle to the next cross lasted 1030 days.
2. Death cross received in January 2019, the cycle to the next cross lasted 554 days.
3. Another golden cross in July 2020. And almost 800 days to the next red point.
4. Death cross received in September 2022. It's just been 152 days.
I have to tell myself something about why all of a sudden
a new golden cross should be received during the spring?
I'll just open a beer for now.

TOTAL2 Scenarios, Bull and Bear TOTAL2 has formed a strong upward movement, this could be followed by further upward movement, favoring continuation or a downward move, favoring the chart pattern of an inverted H&S
TOTAL2 is the altcoin market, but largely follows BTC and TOTAL
Lets see what happens
4Hr chart

$TOTAL Right Angled Descending Broadening FormationThis is a work of art. Thomas Bulkowski talks about the right angled and descending broadening formations, and this also fits into my previous outline of the TOTAL2 charts progress inside of a wyckoff distribution schematic.
Typically these dont break out on the first attempting, but the retrace now gives us the argument of a partial decline inside of this pattern as well.
Above that its the top of the range which would be the sign of strength in the wyckoff schematic.
From there you'd expect high and tight consolidation and then an expansion away from the range
Ill be following each level to look for reactions or more confluence with this idea.
More than likely, given the type of structure we have been seeing across the market, id be confident in a retrace to at least the .618 IF we break the top of the range.
Deep retraces would lessen my confidence. Impulsive waves should hold the .382, but any lower than the .50 id be concerned.
Its supposed to be a sign of strength and that would give confidence to the whole idea.
The implications, should this chart continue to play out in this fashion, are very positive for the alt coin markets.

TOTAL2 8hr time frame looking goodWe should be reaching 680 billion shortly. That would be last August 2022 high. This is only a prediction, not a financial advise.

TOTAL2 looking good on weekly time frame A good case scenario can push TOTAL2 up to 1.2T by early April. Again this is only a prediction not a financial advise.

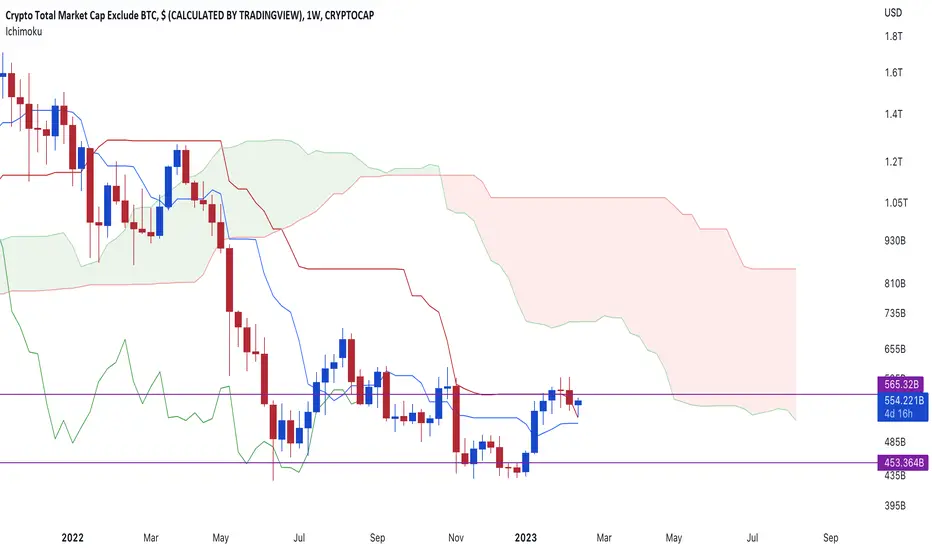
Ichimoku Analysis for TOTAL2weekly #IchimokuOTAL #alts chart suggest chop-chop as lagging is in the price. And with Kijun pointing downwards make sure to keep a good sl on your longs for now.
ALTseason on the way💰Alt season is in this year💥
But wich coin gainer of this altseason?😎
If you want dont miss next shib read comment👇
Amiri Cryptoe👊
( always profit _ never lose ) 😎

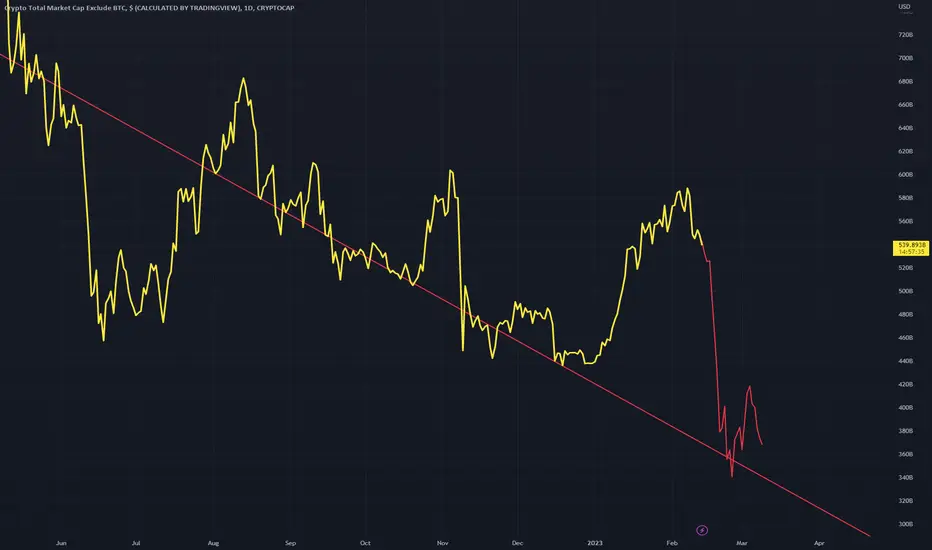
TOTAL2 - Bear TrendlineA bear trend line that could be touched one last time if mcap decides to break down further
This is similar to a scenario that occurred in the previous bear market
I do think we are seeing some more bullish results across the board however so this idea may become redundant if price climbs.
Total2 (Altcoins) is broken dynamic Supporthi everyone
as you can see total 2 is broken its dynamic support even pullback to broken support is confirmed and we will see more and more blood in most of the altcoins, if you check EHTBTC you will understand what i am saying...
just be careful and do not open any long position on altcoin, especially ETH.
please share your opinion in the comments
I consider all analyses performed in relation to that trade position.
Our analysis is not a buy or sell referral.
If you found our analysis useful and interesting, feel free to share it so that more individuals might benefit from it.
And please don't forget to like and comment; we will read them all.

TOTAL2 vs. DXY Corresponding Peaks & TroughsAs it does with Bitcoin and the stock markets, TOTAL2 crypto marketcap also shows corresponding peaks and troughs with DXY. When DXY makes a new peak, TOTAL2 sees a new trough shortly after, and when DXT makes a new trough, TOTAL2 sees a new peak shortly after.
Will TOTAL2 see a new peak form here after DXY'ss most recent low?
Or, has TOTAL2 not yet hit its corresponding trough from DXY's recent high?
