ALTimeterAlts, especially the more established ones: haven’t had an expansive phase for 5 years
Now we get to see if crypto is at an end or a beginning…
GRI 2023
TOTAL2 trade ideas

new analysisIt's really hard to explain this
but we have a slight downpour, and then about 1 month to 45 days the market is bullish , and the altcoin will grow between 100 and 1000%, currencies with high market caps like Ethereum 100% and currencies with low market caps up to 1000%,
and then we have a terrible fall that many currencies will be destroyed
if you like analysis with me. Join me and make a profit to message me or comment
I put 7 new analyzes I will let you see all the analysis to pay attention to the analysis dates and do not harm

total2go head for years crypto
it is my idea in total2
go head for years crypto
it is my idea in total2

TOTAL2 : Will the $420 billion support be maintained?USDT.D index and TOTAL index were checked simultaneously.
Short-term support is at $420 billion and short-term resistance is at $500 billion.
You have to be very cautious, because in case of losing the support of 420 billion dollars, the market can fall to the range of 260 billion dollars from the technical point of view as well as supply and demand.

📈 TOTAL2 iH&S | Altcoins To Recovery SoonWe have an inverse Heads & Shoulder pattern on the TOTAL2 chart.
The Altcoins are about to recover.
This is a bullish pattern and shows up at the bottom of a trend/near support.
So far we also have a higher low in December compared to November.
One final signal favoring the bulls is a bullish divergence with the RSI.
These are early signals but good nonetheless.
Stay strong, stay good, be good, stay safe.
Trade safely and plan ahead of jumping into any trades.
Thank you for reading.
Namaste.

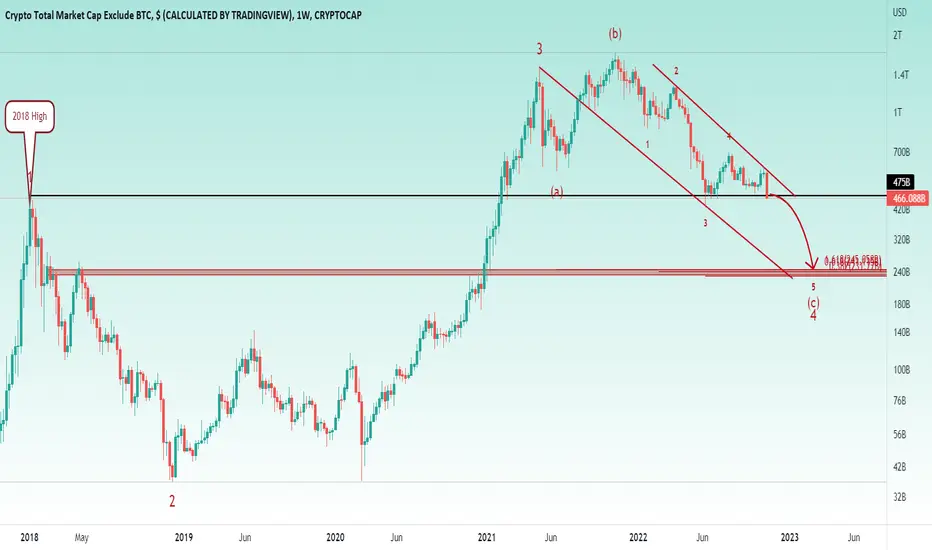
❗️ I EXPECT ANOTHER -50% DROP FOR ALTCOIN📉 475 Billion Is a Strong Support Which Is 2018 High Too ,I Expect It Will Breakdown Soon And The Next Stop Will Be 250 Billion As a Wave 5 From C PRZ
$CRYPTO TOTAL MARKET CAP EXCLUDE $BTCFolks, I don't think we are even close to the bottom of the market yet. This chart is CRYPTO TOTAL MARKET CAP EXCLUDE BTC, and if you look carefully, #head_and_shoulders_pattern matches with target #falling_triangle_pattern. Whole #Altcoin MC will fall other -70%, and have a correction of -92%, which is normal for #Altcoins 🤭. Whatever it looks very bad.

Insanity ahead, once bear is over
Why? Because its already triggered as long as major 4.236 holds.
Top for the altcoins will be major 8.236 extension because major w3 (yellow) > 4.236.
And guess whats the confluence for the local wave? Right w3 (red) on 2.618 implicating w5 (red) on 4.236.
Oh those just match by coincidence? Riiiiiiiiiight...
Hold my beer pls
----
No financial advice, do your own research, don't be stupid

TOTAL3 ALTCOINS vs TOTAL 2 ETH vs TOTAL BTC
As mentioned in a tweet, we should pay attention to what TOTAL3 (orange) is doing and not TOTAL2.
If we look at the difference, we see TOTAL3 has already R/S flipped the june low (as well as BTC has done) while ETH is able to keep TOTAL2 yet above.
Implication from here: ETH looking strongest of all (alt) coins, maybe even stronger than BTC for now, but its the last coin keeping the faith here, once ETH starts dipping, theres no way back
Hold my beer pls
----
No financial advice, do your own research, don't be stupid

💥$TOTAL2 - STRUGGLE CONTINUES✊🏽We all anticipate for the bear to end but charts are proving otherwise. The crypto Total Market Cap Exclude BTC chart shown here indicate that we have liquidity sitting at $208B.
A breakout below the triangle will quicken this bias.
What do you think?
Not a financial advice 🙅🏼♂️
Share your opinion in the comment section✍️
Please support this idea with a 👍 if you find it useful😋
Happy Trading💰💵💸

Altcoins Local Bottom? Think Again(Opinion)
A local floor may be forming in the altcoin market.
CM_Williams_Vix_Fix_Finds Market Bottoms Indicator is starting to form one on the 1-hour. This may be short lived though.
The DXY still have room to move upward after its first few hours being open. This could potentially push the TOTAL / TOTAL2 down further.
4-hour charts for the TOTAL / TOTAL2 also have much room for a continued move down if we break this support level.
Bulls beware. It's going to be an intense week with the FOMC meeting on the 13th & 14th.

total2 chart seems that altcoins will drop 40% or morealtcoins will drop more , please pay attention ....

ALTCOINS Watch alts explode in 2023 if Dollar moves lowerThe chart is pretty self-explanatory. The Crypto Total Market Cap (top chart), which is the market cap excluding Bitcoin has had strong expansion periods when the DXY (bottom chart) was on a downtrend. The pattern behaviour before and after those periods seem to be consistent between them.
Now the DXY had a major rejection on a Higher Highs Resistance that goes back to March 2015. The parabolic channel before that seems consistent with the one in 2016. If we get a similar downtrend channel to the 90.000 Support similar to 2017, when expect the alts to explode in a major alt season.
Follow us, like the idea and leave a comment below!!

Altcoins channel cross⭐️occurred as predicted in November🚨🚨🚨Altcoins channel cross⭐️occurred as predicted in November🚨🚨🚨
A channel cross can signal the "bottom is in" since we saw lowest low in the red main bear run
We are now in the gray accumulation phase
Let me know your thoughts in the comments🤗
⬇️⬇️⬇️
Likes and Follow for updates appreciated🤗
Disclaimer:
Not financial advice
Do your own research before investing
The content shared is for educational purposes only and is my personal opinion

$TOTAL2keep tracking this once a month played out as expected but not the path to the T
at present bouncing from a key support on HTF reclaiming 200 should kick it up to the 50 ema
most likely chop in this zone till sep 2023 before a dip then rip .
lets check back in a bit...
key meetings coming up on the 9th and 13th so expect movement there

Total2 analysisIf you have seen my previous analysis about the totals that I put in the caption, you will understand that I predicted this fall in the total market and now we are returning to the pivot and we have also formed a low falling pattern that indicates a fall. The fact that there are total altcoins means that there is going to be a crash, when money comes out of altcoins and the whales are at the bottom of the bitcoin price. save more bitcoins and then we will see an increase in the price of bitcoins up to $28,000

Total 2 Marketcap bullish ?Lets take a look at Total Marketcap minus bitcoin Looks like a local bottom has been reached on Hr4 IHAS shape, Looking like support/resistance flip of a clear supply zone as highlighted in red Should lead to a relief rally on alts the next few weeks Any pumps and you should STILL be taking profits Still should be considered a bear market rally on MACRO IMO.. $BTC $CRYPTO

Altcoin marketcap total2 usdAltcoin marketcap total2
tether usdt long support
exclude btc bitycoin ether xrp

TOTAL ALTS ; WEVE MOVED!! update ; flip bull?yo yo we finally made some sorta move.
decided to clear this up a bit. these two macro fractals both kinda make sense.. we'll get a clear invalidation of one of them in a few days. lambos or traps?
i have no frigin idea which one but i bet one of them plays and it becomes more clear very soon.
regardless we prob have a few more days of UP to get everyone nice and semi hard again.
gl degens

Accumulation - Crypto Total Market CapAccumulation - Crypto Total Market Cap
Support port capitulation, attractive buy to accumulate alt-coins below the ATH with tight spreads.

Yin or YangWhich path should it take?
For me, with the current nosedive of the DXY, it should be Yang.

Wyckoff Accumulation - Total Marketcap (without Bitcoin)Real nice example of wyckoff accumulation here on the TOTAL2 chart. This is the total market cap without Bitcoin , though all of these charts have a similar style accumulation range, BTC being the most effected by the FTX event.
We have broken the supply line and regained support above critical levels after the spring event.
I also notice there is a new gap in the ichimoku cloud , that could be the targeted path for the impulsive "Sign of Strength" move, provided we maintain control of the range lows.
I think Litecoin is an early mover, possibly offering incite as to what we could expect next should this play out in this fashion.
Hope every ones doing well, more updates coming soon.

ALT COINS - STILL A LONG WAY TO GO DOWNAlt coins are hanging on to their last line of support. I think that pretty much all alt coins will at least fall another 50% from current prices. If this does play out Im going to look to enter the market when the alt coin market is around 250B.
Thanks for viewing my post.
Not financial advice.
