CRYPTO - TOTAL MARKET CAP 2It's truly amazing how total market cap excluding btc runs in perfect channels.
So far we can see we are trnding up and first natural target is the main trend line which is aso the upper line of descending channel.
There I expect longer september correction which can lead us to the second touch of the lower band of our huge channel.
Making hgher low there would be imo very bullish for the nearest future.
TOTAL2 trade ideas

Low Risk Crypto Shortsetup using Harmonic patternsKeep it simple. Using Harmonic patterns.
The chart speaks for itself, a beautiful AB=CD pattern with the D mark at 638.575B, the zone between that D mark and the 632.919B mark is a very Low Risk Crypto Shortsetup. You can also see the rejections of the price above the 632.919B mark in the past. If you put in scaled orders for going short in that zone you should be just fine.
𝘼 𝙡𝙞𝙠𝙚 𝙖𝙣𝙙 follow 𝙬𝙤𝙪𝙡𝙙 𝙗𝙚 𝙖𝙥𝙥𝙧𝙚𝙘𝙞𝙖𝙩𝙚𝙙!
Thank you and have a good one

TOTAL2 - Recovery FormationSimilar scenarios can be seen to the earlier green rectangle period
This green period was the result of a breakout from a falling wedge (recovery formation)
The green rectangle period we are approaching now also follows a recovery formation, however a different one, an inverted H&S
This rise will lead to another retest of the strong downward resistance in white
Daily timeframe


Alt SaisonAction reaction
Fibs
Presume this comes from btc partially (btc.d) but think smart money is poised also
GRI 2022

ALT M.CAP IS TRYING TO BREAK OUT!!Hello everyone, if you like the idea, do not forget to support with a like and follow.
Welcome to this TOTAL2 (Alt M.cap) update.
Total2 is forming a symmetrical triangle in the daily time frame. Currently, it is at the resistance trendline. Also, there is a 100MA. All we need is a close above the triangle and 100MA for a perfect breakout.
If it gives a perfect breakout then August will be very good for ALtcoins. We might see an 80-100% pump in many Alts. As of now waiting for a breakout.
Support:- $590B
If you like this idea then do support it with like and follow.
Also, share your views in the comment section.

TOTAL2 finally taps out the major resistance level around $605B - $640B. Index strength looking weak now and right now price testing the structural support around $590B. Market is bullish above $550B. If price unable to sustain above this then we gonna see some massive crash in the market.

BTC.D Testing Key support levelThis graph shows 1/Total Crypto Market Cap(excluding BTC).
Currently we are seeing general uncertainty in the most volatile market. It may be a better idea to hedge your positions with spreads . In other words, if you are bullish due to fundamental analysis factor on ETH or any other altcoin, you may place a long with your alt and a BTC short .
- Same goes for otherway around (BTC long, shitcoin short)
- This idea is based on the assumption that Cryptocurrencies move in the same direction

APEUSDT#APEUSDT Buy signaling 1D,2D Timeframe
The signal on this chart is typically very strong
>>>>>>>>>>>>>>>>>>>>>>>>>

TOTAL2 "No recession right now, but anything's possible"Such a slowdown, I.M.F. officials wrote, “will make it increasingly challenging to avoid a recession” — no matter how you define the term.

AUGUST SHORT SWINGS....Hello traders, we follow the chart and we are currently testing a resistance zone. for me am bullish on dollar index which is bearish for other markets. shorting opportunities on alt enjoy.
Tradehubng


The Important Area
According to Elliott Waves, we made 5 original descending waves on the daily frame, both for Bitcoin and the rest of the coins.
The price could take three bullish corrective waves and then complete the original bearish waves, or it could take a sideways wave trajectory and then complete the original bearish waves
Or has another opinion about the end of the bear market and the beginning of the original bullish waves
So this gray area has a share of its name!
In conjunction with the possibility of the price testing the downtrend, which supports the possibility of descending
Honestly, every possibility has its backing and strength
But the strongest reason that happened in my opinion, which is (breaking the bottom that formed the last top) remains a difficult number in the equation


Ichimoku Analysis TOTAL2Today's closing will decide whether #alts will bounce from here or goo little more deep. 568 is the value it should not break.

TOTAL2 butterfly and bat patternthere are three bullish pattern are created.
the first point is 312B
the second is 288B and third is227B
the most possible is the first point.


Totalmarketcap2 1T
Downtrend has broken on time flame 3 month .retest we are with down sides probabilities until altcoins marketcap retest the lows of downtrend pattern
Target 100% after retest..
1T. Market2
Happy trading

total2If the Total 2 index growth is higher than the Total Index, that means that the penis shows better than bitcoin

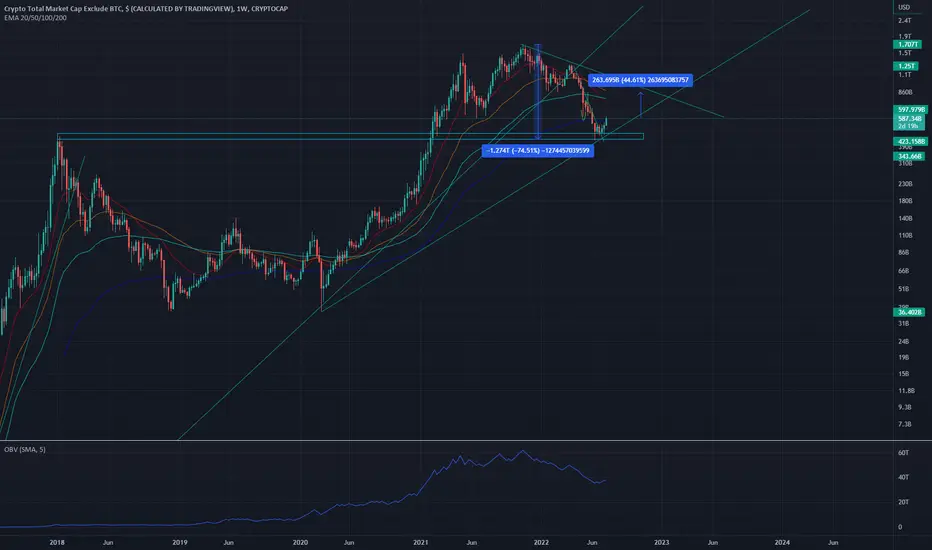
TOTAL2everything accept btc marketcap
44% on the +side here think we see more relief (up) coming into the retest of exponantial moving averages
expecting heavy resistnace at that downtrend line till next halving catalyst event
or potential breakout for succsessful eth2.0merge
overall macrobullish
retested 2017high and bounced significantly
after a 75% retrace from speculative highs (euphoria cycle)
accumulating through summer and these lows will prove profitable in the long run imo
pyscologically speaking not much more can happen barring massive war escalaton or another pandemic
TOTAL2 1 Trillion +This one is also about to shoot up strong.
Over 1 trillion very likely in the weeks ahead.
Party weekend.
Or profitable weekend.
Green weekend.
Bullish weekend.
Money weekend.
The cryptocurrency weekend.
Namaste.

TOTAL2CRYPTO TOTAL MARKET CAP EXCLUDE BTC
This analysis suggests for intraday traders:
Wait until price touches the trend lines then look for signal bar and key bar /Breakout and pullback to recognize direction of price movement.
Please consider this index before opening position Altcoins
Money Management must be obeyed.
