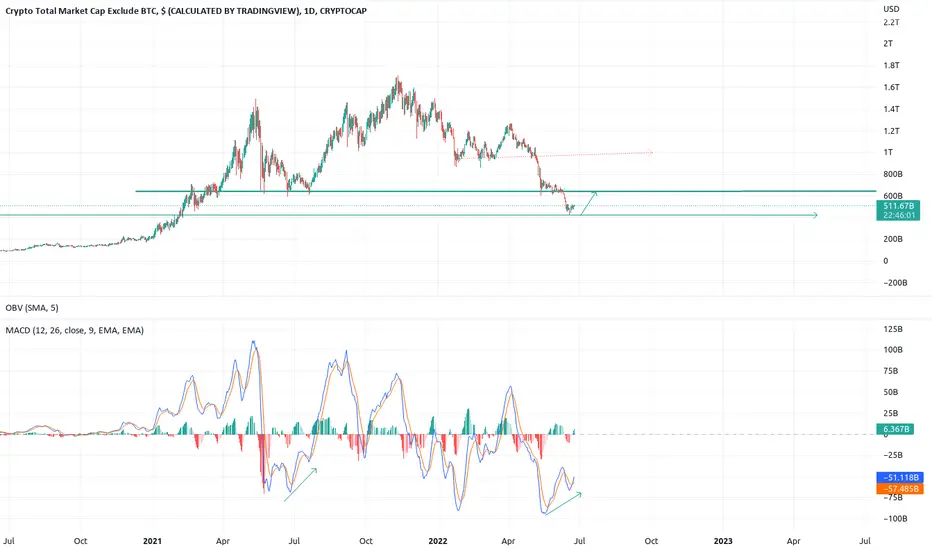
alt coinsalts will recover some loses, up till they hit ressiatnce, like i said you might want to start building position a couple days ago, massive divergences are being observed also CFTC will likely regulate the crypto space rather than the SEC thats also very bullish
TOTAL2 trade ideas
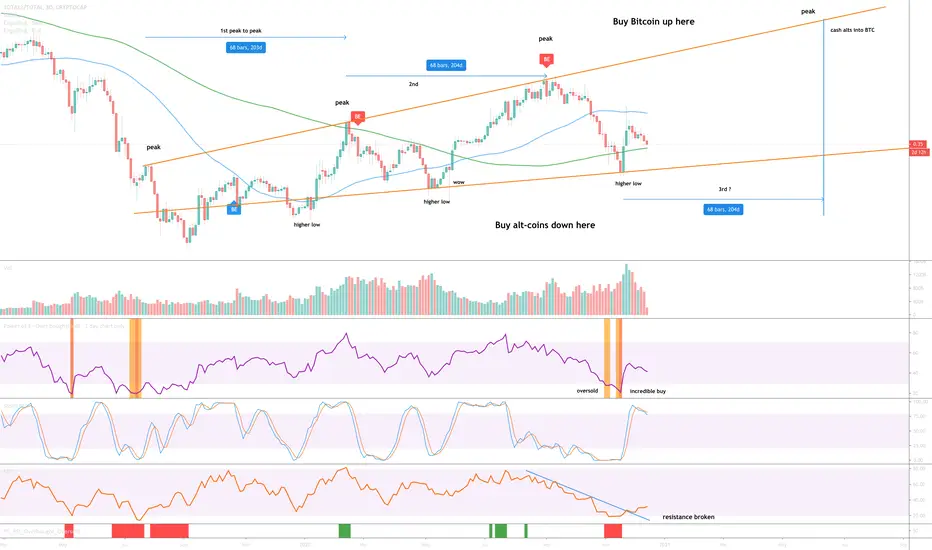
Alt-coin market is about to boomOver the months this 3-day chart has been very powerful for me. Think it is about time I shared it.
Over the last several weeks I’ve been selling my Bitcoin into various Alt-coin positions. It almost does not matter which, a rising tide lifts all boats to coin a phrase. My reasons for doing so is almost exclusively because of the this chart. Take time to study it.
This chart is showing you the ratio in dominance between Bitcoin and Alt-coins. So what’s going on?
1) Dominance between Bitcoin and alt-coins has been exchanging support and resistance in the above channel (between the orange lines).
2) Price action at the bottom of the channel is a superb time to get exposure to alt-coins.
3) Price action at the top of the channel was a superb time to sell those Alt-coins into BTC.
4) 204 days - peak to peak was 204 days in Alt-coin market tops. I don’t know why. The next peak in Alt-coins in Bitcoin terms is around Mid-June.
5) We can see Alt-coin dominance is about to test the 21-week moving average (green line), probably after Bitcoin makes another move up above $20k.
6) The ‘Oversold / incredible buy’ condition (orange column) on the above 3-day chart tells us we are at the bottom.
7) Money Flow Index (MFI - bottom oscillator) resistance was recently broken.
Questions? Just ask below ;)
alts marketcaplol finally touched the 200day ma on the weekly and immediately retraced, rsi is way oversold now, support after support have been crushed, . alot of top coins looking very good i think if one want to start builsing their long position at this level its very valid. make sure to choose the top coins with nice accumulation, and chose the ones that can sirvive on the long run,

TOTAL2TOTAL2
Like the Total chart, the situation is not good, and if the support of 460 is lost, we can have up to 230 drops, and if the support is provided, it is possible to increase the price up to the range of 600.
#TOTAL2 #TOTAL #BTC #BTCUSD #LUNA #LUNC #UST

Crypto Market Cap UpdateInteresting things happening in this chart , Crypto Market Cap "Excluding BTC".
The head and shoulders pattern is clearly playing out and the technical target of this pattern would be at 303 billion dollars which happens to line up perfectly to the 0.618 Fib.
At the same time we have a very rare signal flashing in this RSI indicator I use , it's based on the elliott wave theory and shows when waves have completed 5 counts , since 2018 we have had just three signals and keep in mind this is not a lagging indicator its real time .
Last time we got green triangle was the bottom of the bear market in December 2018 and now its flashing again , keep in mind that in order to confirm this signal we must close the weekly and if market cap goes lower the signal will move to the next candle , always have to wait for candle after for confirmation of a trend reversal.
The point is that the fact that its flashed on means the bottom is could be near for the alt coins but this head and shoulders pattern has over 80% success rate so if it does play out it would be a brutal move down to 303 billion.

Total 2 - Wave count Daily Total 2 - Wave count Daily
this is the target for the end of the 4th wave from the weekly chart...
you will want to hold support here so that we can start the next impulse up we will call wave 5.
Total 2 - Wave countThis indicates a larger wave will come.
we label the next bull cycle wave as wave 5.
Using this logic , it means we are in the 4th wave.

Total2 Crypto - Monthly chart Total2 Crypto - Monthly chart
price is at support , where as TOTAL chart on the Monthly is not yet there.
this indicates that bitcoin is stronger then the general market including ETH. also check the TOTAL 3 chart.

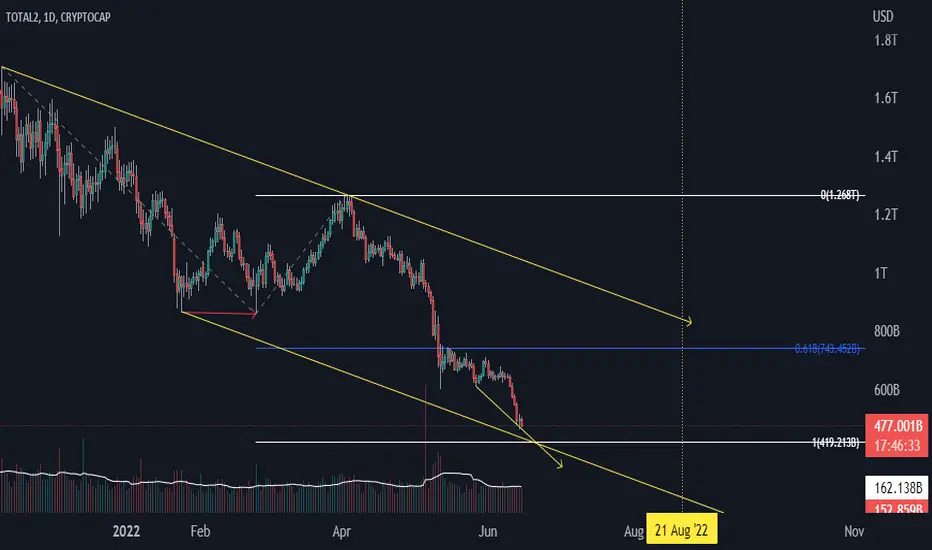
total 2 weekly total 2 shows a return in daily time frame
it can revive Altcoins but there is a plan B for a greater crash in market after the date we reach to this price .

ALTCOINS TOTAL MC :UPDATEHELLO
total2 hitting the intersection of strong support lines... coinciding with #DXY reaching a strong resistance level,
All this indicates a temporary recovery of the alternative currencies during the next week.

Whale SightingThe green line in the indicator represents the biggest-sized wallets participating in the market and the red line represents the price. We can see whales coming into the market at a time where a potential reversal could be on the cards. What a time to be alive dawg

ALT/USD on the best place for a bounce !TOTAL2 (which is Top 125 altcoins vs USD) is currently retesting the 2018 top.
This was previously resistance and is now being tested as support.
This is a good time to dig into some altcoin charts to find some nice risk-adjusted longs because invalidation of the trade is quite close
Thanks for following us! If you have any questions, please don’t hesitate to ask.

$BTC MCAP vs Rest of Crypto excluding BTCcheck this chart a few times a year ..looking for the blue line to reverse back down and form a death cross with the orange line or money from btc to flow into alts
for now dominance is on a tear but what goes up must flow back
confirmation of kick ass Alt season .
1 trillion used to be a dream a few years ago long term even half of gold market cap would be lovely ..

ALTCOIN Super Cycle speculation?INFLATION needs to be addressed and im wondering if the retrace after the C leg will kick off the ALTCOINS.
T1 & T2 will need to break through some resistance points.
Lets see what the news/narratives is during the retrace.

TOTAL2 Where will it recover? The 200MA is a strong point of support right now on the Weekly timeframe for the alt coin market cap
This will likely be the point of recovery from this current bearish action
Get the alt coins while they are cheap!!

TOTAL2TOTAL2
Like the Total chart, it is at its most critical point.
If the level is not supported in the line, it can fall to level 460, otherwise level 870 is available with divergence.
#USDT.D #TOTAL #TOTAL2 #BTCUSDT #ETHUSDT


HOW LOW, CAN WE GO! HOW LOW, CAN WE GO! (TOTAL2 VERSION)If I had to guess, the crypto market minus BTC still has ~10% of bleeding left to do before it hits previous support. Forgot to check but that's like a few billion at least.
Breakdown & bear retest of 200 on 3D supports this idea
Breakdown into oversold RSI on 3D indicates we may see a bounce soon - but it could also get stuck down there for a while while we continue down.
I think the admirable performance of ETH is the only thing keeping this afloat right now, and will be the only reason this *doesn't* play out, if it catches support sooner.
Anyone buying ETH around these levels will look like a genius a year or so from now...
happy trades, always ~
CD

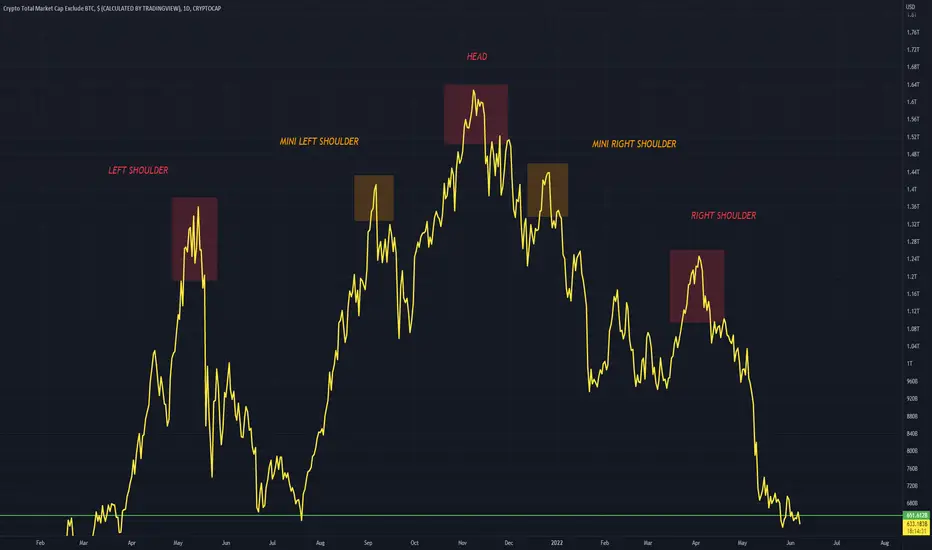
TOTAL2 Completed H&S PatternThe altcoin market (TOTAL2) has completed a H&S pattern
While also including simultaneously a mini left shoulder and a mini right shoulder
A visually appealing pattern to view
Alt coins bottom?Last bear market total2 bottomed at around 23.6 level of Fibonacci and now it is around same level of last bull phase. Could this be the bottom of bear market?

alt coins alts aright at weekly support, if ti fails and drop lower, chances are another 30% down before it reached the weekly 200day moving average for support, already 10 red weeks bears getting exhausted buy now

#ALTS MARKET CAP ANALYSIS!!welcome to this quick update on the TOTAL2 analysis.
I have tried my best to bring the best possible outcome in this chart.
#ALTS Market Cap Analysis
It is moving in a parallel channel in a bullish trend. It is currently trading above the trendline support. The RSI is in oversold territory. We will have to wait for a sustained breakout to confirm its next move.
Sorry for my English it is not my native language.
If you like it, hit the like button and share your charts in the comments section.
Thank you...

#ALTS MARKET CAP ANALYSIS!!Hi guys, This is CryptoMojo, One of the most active trading view authors and fastest-growing communities.
Do consider following me for the latest updates and Long /Short calls on almost every exchange.
I post short mid and long-term trade setups too.
Let’s get to the chart!
I have tried my best to bring the best possible outcome in this chart, Do not consider it as financial advice.
#ALTS MARKET CAP ANALYSIS
It is moving in a symmetrical triangle in a downtrend. Currently holding above it's trendline support. MACD crossover is loosing bullish momentum. RSI is in the oversold region. We've to wait for a sustain breakout/breakdown to confirm it's next move.
This chart is likely to help you in making better trade decisions if it did consider upvoting this chart.
Would also love to know your charts and views in the comment section.
Thank you
