Price at Bullish Curve TOTAL2Price is touching and wanting to break out of this bullish curve it is touching
Very bullish situation for BTC and altcoins along this trend line
Daily chart
TOTAL2 trade ideas

total 2 potential monthly double bottomtotal 2 double potential monthly double bottom, which align with the fed interest rate cycle, similar to 2018-2021. bottom around end of 2025, then big rallies coming into 2026

TOTAL2 - Down Channel Breakout An example of a strong move out of the current down channel on TOTAL2
This breakout could continue to a position of strong resistance which i have labelled with the horizontal line
Good time to buy alt coins
2Hr chart

Alts/BTC cap vs global net liquidity indexChart shows Alts/BTC cap vs global net liquidity index, where we can see possible BOS on index, that could mean alts are bottomed out.

TOTAL2 - Support CurveA curved support line on the 4H chart for TOTAL2
I suspect this to HODL and price to rise on the right side of the larger overarching pattern
The dashed green line is a strong horizontal support
4HR chart

Does this chart provide the hint to time HTF altcoin uptrends?SFP = HTF HL = altcoin uptrend? = investing in altcoins +EV as this charts hints at more money being put into the market soon (as TA suggests a HTF HL is likely?)?

TOTAL2 Weekly Chart – Is Wave (5) Incoming?Join our community and start your crypto journey today for:
In-depth market analysis
Accurate trade setups
Early access to trending altcoins
Life-changing profit potential
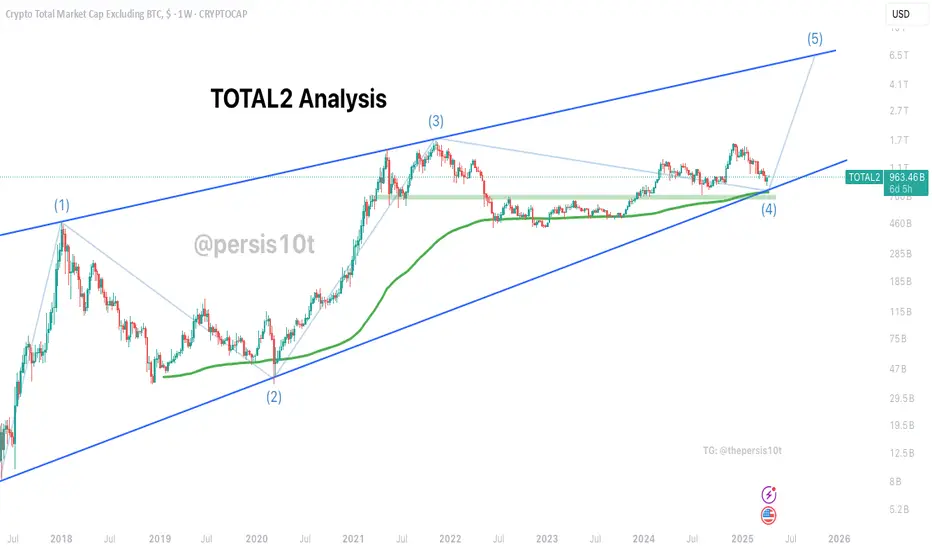
Let's analyse the Altcoin market cap (excluding BTC):
The TOTAL2 is showing a textbook Elliott Wave structure, and we might just be at the most exciting juncture yet — the potential beginning of Wave (5).
Elliott Wave Count:
Wave (1): The 2017 altseason explosion.
Wave (2): 2018–2019 crypto winter correction.
Wave (3): Massive 2020–2021 altcoin supercycle.
Wave (4): Prolonged sideways-to-down correction (2022–2025).
Now, price has pulled back to the channel support and appears to be respecting both the lower trendline and the 200-week MA, indicating that Wave (4) may be complete.
Technical Confluence:
Price respecting the long-term ascending channel.
Retested and holding the 200-week moving average.
Support from mid-2022 and mid-2023 ranges is still intact.
Potential higher low formation, typical for Wave (4) setups.
What to Expect if Wave (5) Begins:
Wave (5) could take TOTAL2 towards the upper boundary of the channel, potentially targeting the $6–6.5T region.
Historically, Wave (5) tends to be impulsive but less aggressive than Wave (3), offering strategic mid-to-long-term opportunities.
A breakdown below the trendline + 200-week MA would invalidate this scenario and signal a deeper downside.
Watch for confirmation with volume and weekly candle closes above recent swing highs.
Conclusion:
Altcoins are showing early signs of strength after a multi-year correction phase. If this Elliott structure holds, we could be entering the final macro bullish wave — one that historically has rewarded patient positioning.
If you find this analysis helpful, please hit the like button to support my content! Share your thoughts in the comments, and feel free to request any specific chart analysis you’d like to see.
Happy Trading!!
Crypto Market Cap: Short-Term Pullback Before Major RecoveryTechnical Analysis
The chart illustrates a well-defined ascending channel for the total crypto market cap (excluding BTC), currently experiencing a downward retracement. The price action suggests a probable dip towards the lower boundary of the channel around the $969 billion support zone before rebounding significantly. This level aligns with previous price reactions and serves as a strong demand zone, making it a potential bottom before the market resumes its uptrend.
Fundamental Analysis
Liquidity Flow & Market Sentiment
The broader market has seen increasing stablecoin dominance (such as USDT’s market cap exceeding $130 billion), indicating risk-off behavior as investors move to safety. This suggests a short-term sell-off in altcoins before a reinvestment phase.
Institutional inflows into ETFs (like Ethereum and broader crypto ETFs) will likely drive the next bullish wave, but the current correction reflects temporary uncertainty.
Macroeconomic Factors
Interest Rate Policies: If the Federal Reserve signals rate cuts in mid-2025, risk assets (including crypto) will likely benefit from increased liquidity.
Regulatory Clarity: The market is awaiting key regulatory developments, especially in the U.S. and EU, which could influence capital inflows into crypto.
Altcoin Cycle & Market Recovery
Historically, the crypto market experiences phases of correction before a strong recovery. With the next Bitcoin halving approaching (April 2025), the overall crypto market cap is expected to rebound as bullish momentum returns.
DeFi, gaming, and AI-based tokens continue to gain traction, setting the stage for an altcoin-driven rally once risk appetite returns.
Conclusion
A short-term pullback to the $969 billion support level is highly probable, after which a strong bullish reversal is expected. Long-term investors might see this dip as a buying opportunity, anticipating a rally towards the upper boundary of the channel (above $2 trillion) as macroeconomic and institutional factors align in favor of crypto.

APRIL Market Analysis Drop your assetsHi Everyone,
April opens with a storm and it’s not just crypto causing the turbulence. The intensifying U.S. tariff trade war, now stretching far beyond China and striking major global economies, is shaking the foundation of both traditional markets and digital assets. The shockwaves are real and they’re hitting every corner of the financial world.
From equities to commodities and now crypto, global uncertainty is driving market-wide caution. Institutional investors are rebalancing, liquidity is tightening, and fear is visible in both macro and micro structures. These geopolitical tensions have amplified risk-off sentiment, causing even strong altcoin setups to face unexpected rejection zones and liquidity grabs.
But here’s the truth: Volatility is not the enemy—mismanagement of risk is.
🔹 Is this the start of something bigger?
🔹 Are altcoins gearing for a true breakout or just mimicking strength?
🔹 Which coins are respecting structure vs. falling into distribution traps?
Let’s find out together.
📩 Drop your favorite altcoins in the comments, and I’ll provide professional, unbiased technical analysis—pinpointing key price levels, confluences, and possible setups based on current price action and macro sentiment.
📅 Submission Deadline: April 15th, 2025
🔹 Request Format:
✅ One coin per person
✅ Use tickers (e.g., ETHUSDT, SOLBTC)
✅ Full name optional but helpful
Market Pressure is Real — But Don’t Lose Hope
We know it's frustrating. Long-term holders are watching gains evaporate. Traders are seeing stop-runs and failed breakouts. But remember: some of the best opportunities in crypto history were born out of similar uncertainty.
A Word of Encouragement to Holders:
This is a time to reassess, not to panic. Smart money thrives when weak hands fold. If you’re holding strong assets with sound fundamentals, patience and discipline are your greatest allies right now.
Professional Risk Management Tips:
✅ Never go all-in. Use capital allocation strategies (2-5)% of portfolio per position depending on conviction and timeframe.
✅ Use proper stop-losses. Don’t guess, define invalidation levels based on structure, not emotions.
✅ Avoid revenge trading. Losses are part of the game. Reset your mindset before re-entering.
✅ Preserve capital first, then profit comes next.
✅ Be flexible. The market doesn’t owe anyone a move. Let the chart guide your bias, not your feelings.
This isn’t just another bearish phase. It’s a testing ground for your patience, your strategy, and your risk tolerance. Let’s stay vigilant, stay smart, and ride through April together because when the next major wave comes, it will favor those who remained focused when others lost conviction.
🚀 Let’s build through the storm.

CRYPTO TOTAL MARKET CAP EXCLUDING BTC📊 Altcoin Market Cap Analysis (Excluding BTC)
Date: 9th April 2025
We're currently observing the total market cap of all altcoins (excluding Bitcoin), which has historically shown a consistent pattern around the $700B demand zone. This area has repeatedly acted as a launchpad for significant altcoin rallies, marking the point where new capital tends to flow into the crypto space.
🟢 Historical Market Rebounds from the $700B Zone:
July 2021:
✅ Market cap rebounded from $725B → $1.7T
February 2024:
✅ Market cap rose from $750B → $1.26T
August 2024:
✅ Market cap surged from $745B → $1.65T
🔍 Current Market Situation (9th April 2025):
Current Total Altcoin Market Cap: GETTEX:879B
This suggests that while we’re still above the critical $700B demand zone, there is potential for further downside in the coming weeks. If the market revisits that area again and holds, we could see another strong wave of capital inflow and a major rally across the altcoin space, just like in previous cycles.
✅ Key Takeaway:
$700B remains a key regional support zone.
If it holds, history suggests we may witness another strong altcoin market recovery.

Is there any chance for an ALTSEASON now??Just some chart fun. Do you think the pattern will be completed and the current altcoin Bull Cycle will follow the previous two? Do you think there will be a new Altseason amidst the tariff chaos?
Whatever happens, the 1W MA100 (green trend-line) has to hold (close 1W candles above it) if that would be the case and it just got breached.
-------------------------------------------------------------------------------
** Please LIKE 👍, FOLLOW ✅, SHARE 🙌 and COMMENT ✍ if you enjoy this idea! Also share your ideas and charts in the comments section below! This is best way to keep it relevant, support us, keep the content here free and allow the idea to reach as many people as possible. **
-------------------------------------------------------------------------------
💸💸💸💸💸💸
👇 👇 👇 👇 👇 👇

NEW ALL TIME HIGHSBullish divergence on the 3M chart forming on RSI and OBV indicator. Very very high probability of seeing new highs. Dont be fooled by the news. Numbers are more important than words.
Stay blessed.
DYTRDR.

Small Relief Rally CRYPTOCAP:TOTAL2 BINANCE:ETHUSDT
Disclaimer: Not financial advice! 🚨 Do your own research. Markets are risky—trade at your own discretion. I’m just sharing ideas, not guarantees. 📉📈

ALT Market cap - Dip before 3TThe Crypto Total Market Cap Excluding BTC (CRYPTOCAP) is currently testing a critical support zone at the 21-month Simple Moving Average (SMA). Historically, this moving average has acted as a strong dynamic support, marking significant market reversals and uptrends.
✅ Price is bouncing off the 21 SMA, similar to previous bull market cycles.
✅ The recent correction appears to be a healthy retest of support rather than a trend reversal.
✅ The formation of higher lows suggests bullish momentum building up.
✅ If price holds above this level, we could see a strong rally in altcoins, pushing the total market cap higher.
A successful bounce from the 21 SMA could trigger a bullish continuation, leading to a market expansion toward 1.6T - 2.3T levels in the coming months.
🔸 A monthly close below the 21 SMA could invalidate this setup, leading to a deeper correction.
🔸 Key support zone to watch: $900B - $950B
🔸 Breakout confirmation: Monthly close above $1.1T
If history repeats, this could be the perfect accumulation zone before the next major altcoin season! Keep an eye on the monthly close and volume confirmation for the next big move.
Follow our TradingView account for more technical analysis updates. | Like, share, and comment your thoughts.
Cheers
GreenCrypto

LONG $900BMorning fellas,
I have been getting some spite, and about 75% of people who follow me stopped liking or commenting on my posts just because I've been sold since $100k and calling non-stop for this drop.
The drop came, and the moonfellas out there finally gave in.
Now it's time to look for longs and nothing better than a few select alt coins. I'm thinking $888B to $900B should hold and then we fly. Check trajectory line.
You people need to stop only posting that it's going up to the moon, and be realistic about things. Buy blood not green, buy LINK at $7 and not $25. Buy dot at $2 and not $15, and so on.
Trade thirsty, my friends.

Still Doubting Altseason? This Chart Might Change Your Mind..Hello Traders 🐺
Before we begin, let me tell you why I decided to publish this idea:
Over the past few weeks, I’ve received tons of comments and messages from people saying, "This time is different—we’re not going to see an Altcoin Season." So, I decided to lay out the full evidence pointing to a massive upcoming Altcoin Season. 🔥
📊 Breaking It Down
To make this easier to follow, I’ve used a line chart to remove the excess noise. As you can see, there’s a strong inverse correlation between BTC Dominance (BTC.D) and Altcoins' performance. But how does it actually work?
Every time we see a top in BTC.D, we enter a BTC season—meaning most of the capital flows into Bitcoin while altcoins lag behind. But after a while, BTC.D starts weakening, and at the same time, altcoins begin to gain strength and outperform BTC as the market shifts. 📉➡️📈
So far, we’ve had 2 major Altseasons, and right now, we’re seeing the same scenario playing out again:
✅ BTC.D is starting to show weakness
✅ Altcoins are beginning to outperform BTC
✅ If you zoom in on the ALTS/BTC chart, you’ll notice that many altcoins are trading near their all-time lows against BTC — a huge opportunity!
What Else?
I also believe we’re close to entering a Quantitative Easing (QE) phase, which means more liquidity will be available to fuel the next rally. Combine that with current chart setups, and the case for Altseason 2025 becomes even stronger.
I hope you enjoyed this idea! Make sure to like and follow for more updates—and as always:
🐺 Discipline is rarely enjoyable, but almost always profitable 🐺
🐺 KIU_COIN 🐺

TOTAL2 Altcoins #Altcoins mcap TOTAL2 gathers strength above coraltrend and ema20 major support ahead of next major run!

Why A New Quarter Is So Important Why a new quarter is so important and how/why it can change market trends
• Performance Reporting: Institutions evaluate performance each quarter, influencing new investment decisions.
• Portfolio Rebalancing: Hedge funds and institutions reposition holdings, adjusting asset allocations based on new quarterly forecasts.
• Fund Inflows/Outflows: New investor capital often enters or exits funds quarterly, triggering significant buying or selling.
• Sector Rotation: Institutions shift funds to sectors expected to outperform, aligning with updated quarterly outlooks.
• Earnings Season Anticipation: Market positions adjust ahead of quarterly corporate earnings reports, impacting price volatility.
• Regulatory and Risk Management: Institutional investors rebalance to meet regulatory requirements and manage risk exposure quarterly.
Share below in comments other reasons why a new quarter is so important

Crypto Total Market Cap Excluding BTC (TOTAL2) - Daily Timeframe1. Market Overview:
Current market cap: $1.05T (+0.83%)
The market cap has bounced from recent lows (~$827B) and is showing some recovery.
The Fibonacci retracement levels suggest key areas of resistance and support.
2. Fibonacci Levels & Market Structure:
The downtrend retracement from the recent high ($1.64T) to the low ($923B) is mapped with Fibonacci levels.**
23.6% ($1.09T) and 38.2% ($1.2T) retracement levels are key resistances.
Major resistance around $1.28T (61.8% Fib), which aligns with previous consolidation zones.
If the price fails to break above $1.09T convincingly, a potential retest of the $923B- MIL:1T range is possible.
3. RSI & Momentum:
RSI is showing slight bullish divergence, indicating that selling pressure is reducing.
RSI is currently below 50, meaning there is still cautious sentiment, but an upward break could confirm a bullish shift.
4. Key Scenarios:
✅ Bullish Case: If TOTAL2 reclaims $1.09T and holds above, it could target $1.2T and then $1.28T.
❌ Bearish Case: Failure to break $1.09T might result in a pullback towards MIL:1T or lower.
Conclusion:
Short-term: Neutral to slightly bullish (needs confirmation above $1.09T).
Long-term: Needs a break above $1.2T for trend reversal confirmation.
Watching volume and RSI movement is crucial for next moves.
Would you like a detailed trade setup or further insights on potential altcoin impact? 🚀

AltCoin Total 2 Index The divergence of HD+ in the altcoin index (weekly timeframe) indicates a potential pattern. Following the BX movement, we experienced the XY growth. If the previous step repeats, we can expect growth from the current range. Additionally, during the recent correction, we observed an increase in the depth of the range three times, similar to the previous corrective step.

#TOTAL2 1W-TF🚀 #TOTAL2 Analysis
📊 Weekly Timeframe:
📈 Ascending Parallel Channel – Price has tested and rebounded from lower support, keeping the structure intact.
⚡ Key Outlook:
- If momentum strengthens, CRYPTOCAP:ETH and alts could see a bullish move.
- A breakdown below support may invalidate the trend.
👀 Watch for confirmation of strength before positioning!

BULLISH DIVERGENCE Crypto Total Excluding BTC... GOOD FOR CRYPTOLooking for any constructive criticisms, happy thoughts, tips, tricks, or any other cool stuff. Looking at the Crypto total market cap excluding bitcoin, it appears to be showing a bullish divergence with the Mkt Cap Total showing lower lows, as the RSI is now showing higher lows. Looks like a Bullish Divergence to me. What do you think? The RSI is a momentum indicator. Please let me know your thoughts.
Cheers!

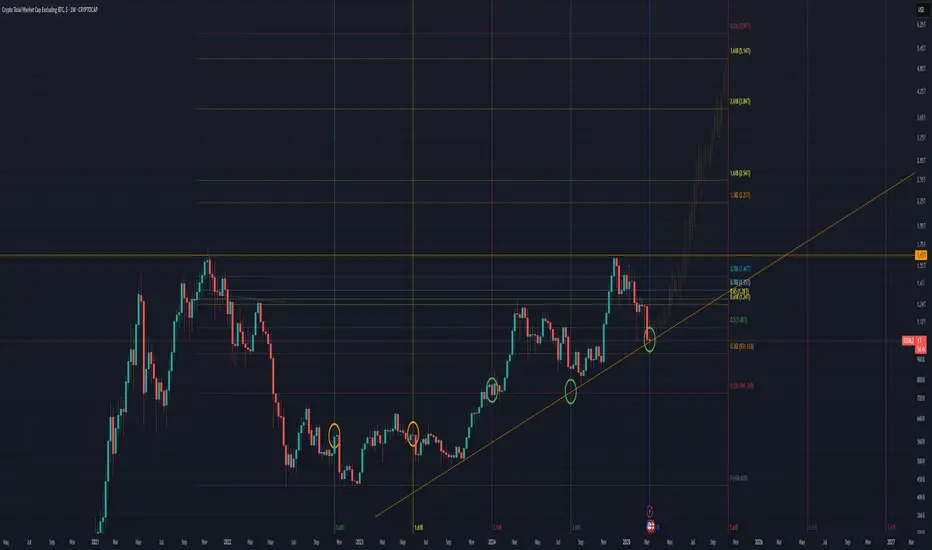
The Official Start of Alt Season (Only Up For 217days)I dare to say that it’s the official start of alt season. Over the next 217 days, we are going only up...
ONLY IF WE HOLD THE LINE.
So, throughout this technical analysis (TA), you will see some very important charts that we need to hold the line on. If the line is broken, there is no alt season for me; the line in the sand will be drawn.
The main chart above is currently TOTAL2, which means the total crypto market cap WITHOUT BTC.
What you’re about to see here on these charts is nothing short of amazing. The chart on the left is my new secret weapon for knowing when alts have bottomed. As you can see, every time we hit the top of this resistance on this chart, it marks a major alt bottom. So far, it has been happening once a year since 2022.
As of this week, we have gotten the 4th hit.
The stars are once again aligning. Finally, once I see everything lining up, I know that there’s an extremely high chance that I will be correct. What are the chances that we hit the top of this resistance for the 4th time on the week of the Fibonacci time sequence you see on the main chart, which also happens to be the bottom of this diagonal support? Again, too many things are lining up here for me.
This time, the Fibonacci sequence I’m following failed to give us anything on the first two hits, but the third (2.618) showed a nice pivot, and the fourth (3.618) showed us the August 2024 alt crash, which is a very important date and event because it mirrored the COVID crash of the last cycle in many ways. So far, then, we have a 50% hit rate on this sequence. We shall see if this week’s Fibonacci count is the actual bottom and pivot of the year.
The most important date for me is the one after October 13th, 2025. This has very much piqued my interest because this is exactly when I think the altcoin market will top this year.
Why October? Well, if you take a look at my Bitcoin TAs, I think September 2025 will be the Bitcoin cycle top this year, and what normally happens is the altcoin market rallies 20–30 days after BTC has topped. Let’s take a look:
As you can see, Bitcoin topped in April 2021, and 28 days later, the alt market topped.
In the 2017 bull market, the same thing happened: Bitcoin topped, and 22 days later, the altcoin market topped.
My thesis for Bitcoin is that we are currently starting the final Wave 5 that will top in mid-September. As you can see, my Fibonacci time sequence has a hit on this timeframe, which is also 1,050 days from the cycle low—the exact length the last two cycles have taken from bottom to top. So if Bitcoin tops in Mid September 2025 its very much possible that 20-30days after that alt market will top which line up with Mid October !
The ascending triangle technical target is about a 5 trillion market cap at the 3.618 level, which is the Fibonacci level we topped out at last cycle.
Many of the greatest rallies have started at this RSI level.
The Wyckoff Spring indicator fired off for the third time in ETH history. This is a real-time signal; it has no lag.
Could this be the spring?
Conclusion
I’m 99% sure this is the bottom as long as this diagonal support is not broken. That’s the only condition here. If it holds, a V-shaped recovery is likely, and expect only up for 217 days.