TOTAL2 (Altcoin Market) Bearish SentimentUsing two different Fibonacci Circle plots we can see price being rejected at purple and inversely being supported as orange
Currently price is in the middle of the purple fib ring, this allows a bearish conclusion to be made
Bearish action is plotted by Bars pattern in red (just a guess of how it will undergo)
Once price reaches orange again resumption of a bull market is possible (green)
Bitcoin will recover before altcoins
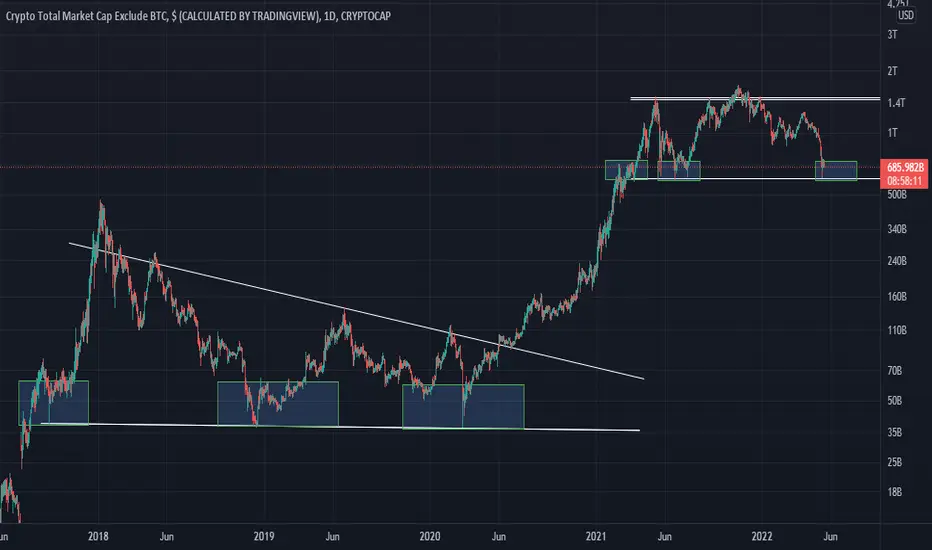
TOTAL2 trade ideas

long term trend line was missed !look from far
Altcoins need to capitulates..
so don't rush to buy
give a time to price
supports zones are clear in chart

Potential H&SLooking at RSI it is possible to get a little bit of upwards movement before we fall back down hard again

Alt coins entering Thrill & Euphoria Dear traders,
Intro: My name is Hugo, I am 25 years old and trading crypto currencies since late 2017. English is not my main language, however, I will try to explain everything brief and clear. Be aware that I am still in the learning curve. Every idea I post is not financial advice and is only meant for entertainment purposes only.
I think the alt coin acceleration is going to play out somewhat like this. Will take profits gradually in BTC.
1. Remember, buy alt coins where ALT/BTC charts are currently going sideways.
2. Use untested levels as TP's (take profit) on the ALT/BTC charts.
3. Dump the alt coin when the ALT/BTC chart is going vertical to the upside.
4. Look for alt coins that didn't left off yet and still going sideways.
5. Repeat steps 1,2,3. Until market is getting saturated.
Looks easy, but is pretty difficult.
Time focus and pay close attention lads.
WAGMI
Goodluck,
Doctor Hugo

Total (excluding Bitcoin $0) Of course just playing around here by maybe Bitcoin is the only real value asset here? Alt coins looking like a Tsunami of dotcoms

TOTAL2 1 Month AnalysisTOTAL 2 is on the support ($650B) right now. If it starts running from the support first destination is the trend resistance ($750B). If it breaks the trend next destination going to be EMA which is $950B. Then we can consider $1,2T

TOTALCRYPTOMARKETCAPhonestly im not bearish here...
think we see a recovery from this 55% drawdown
bullish c fork starting to look good...
obv never even broke bullish trendline
if that goes ill flip way more bearish
but fundamentally anyone in crypto knows the quality products built this cycle should stand the test of time and eventually institutional finance will have no choice but to start considering positions
the luna fiasco will only make them more wary and decide to do more thorough research before investing in bound to fail uponly ponzis
total cap eventual target in the long run is around 7trillion so weve got a ways to go before im going to loose total faith in this market

TOTAL2 is going 500-400It is forming a head and shoulders pattern, and could fall to the $ 450 billion market cap.

TOTAL2TOTAL2
Total 2, like Total, is on a very important support.
This index is located in a decreasing triangle and after reaching its support, it is predicted that the ceiling of the triangle will continue its trend.
#TOTAL2 #LUNA #UST #BTC

Crypto Total Market capThis analyze is about the DogeFather token.it has formed couple formation and it is ready to delete 4 zeros soon.Not Financial advice.
DogeFather token
Contract;
0x15E2BFF3AB5dcF1F7b5b854636939F3649ce3cf8
it has formed couple formations that it can delete 4 zeros and 56% of supply already burned.
Copy and paste this url to check DogeFather token chart.

Alts and btcI think it’s ok to long alts now unless it loses 700 billion support . btc should be going up as well for now

Bear market for the ALTS or there is a way out?Hi there!
You can see the Fib retracement of the previous big order flow is to the 61% level, next fig order flow is retracing to 100% so far. That's the level at 652 B. Nothing wrong unless we drop under the 100% Fib retracement.
This is very important level because if we drop under, we will probably be in a long bear market for the ALT coins. Let's hope to stay over the water and to bounce up. If we do bounce up, then we ultimately will be targeting to reach out the completion of the big ABCD pattern ending with the ellipse (1,85 T). That it would be a nice bull run for the ALTS. GL to us!

Fibonacci Circles Idea TOTAL2 Green and Red are sequenced events
While Aqua and Yellow are related only by the 3.618 Fibonacci Circle of both Bear and Bull Trend lines
Any further interpretation of these events is welcomed

$TOTAL 2 - Alt coins have bounced off this important sup levelFor those who can stomach this crypto volatility, we have seen the market cap chart of the Alt coins bounce off $600mil this morning. Notice how important this support zone was in 2021 touching it multiple times and bouncing. Also importantly, this is where the anchored vwap zones come in using the December 2018 and March 2020 lows. This is no doubt an important support zone and bulls will want to protect it at all costs to keep Alt coins alive.
Note: Used a LOG chart to show more perspective, but same levels apply on the normal chart.

Total 2 Absolute CarnageAlt Coins are in total free fall.
A massive Head & Shoulders pattern has been completed and the measured move down from the break is 49.43%.
That puts the Total 2 Cap around 483 Billion.
Short-term relief is possible, but the general direction seems clear.

#ALTS MARKET CAP UPDATEHi guys, This is CryptoMojo, One of the most active trading view authors and fastest-growing communities.
Consider following me for the latest updates and Long /Short calls on almost every exchange.
I post short mid and long-term trade setups too.
Let’s get to the chart!
I have tried my best to bring the best possible outcome.
TOTAL 2 UPDATES:
total 2 is making this big descending channel pattern, currently, it looks like it is going to retest the lower support.
we can bounce from the lower support of this channel so let's see how it goes.
if it breaks the lower support of this channel then the chart will be invalided
This chart is likely to help you in making better trade decisions if it did consider upvoting this chart.
I would also love to know your charts and views in the comment section.
Thank you

TOTALSHITThis is the total cryptocurrency marketcap with wrapped bitcoin and stablecoins removed.
(MIM and BUSD marketcap were not available so substituted mcap of AVAX and XLM)

Total 2 is in sensitive situationIn the past, we had a fibo 0.618 as a strong support level,
but now, when market is making double high , and the correction is also at fibo 0.618
If there is no pullback from there,
We might see Total 2 market drops to 760B

Total 2 Analysis? more dip is coming!!!📊 Total2 marketcap
🕒 Daily Analysis
🟢 The TOTAL2 broke the important support and dumped hard from breaker block. Most altcoins see double digit loss in last 48 hours. TOTAL2 is now taking support at $780-$800 billion area. IWe might see a test of $925-$970 billion resistance now. If it goes above this resistance then we see some positive movement otherwise the dump will continue. Use proper stop in all your position because of market situation.

ALTCOINS ARE TRASHED Altcoin next stop is 400B.
Then 200B.
We may get back to COVID low like Netflix did.
From the COVID low 20B dollar for Altcoin, It has done 80x to reach ATH of 1.7Trillion dollars for nothing, no real usages, some Jpeg, Metaverse hype, P2E hype, Web3.0, Dao, Memes,... A lot of shits in the Altcoin market.
Now we will pay the price for FOMO in the market after it has done 50x-60x.
The pain is yet to come.
- You have seen irrational of Altcoins Market Cap. Just a hype, merely an idea and a website it has reached billion of dollars market cap.
- I see it as a Dotcom Bubble all over again.
- Like Market Makers said we were in the biggest and longest bulllrun ever since 2008 in stock market and crypto market.
- This bubble will cost so much to the people. The crash will not be in a day or two. It's gonna be a slow bleed and then Capitulation.
- Bitcoin may drop lower than 10k
- And Altcoins will be nothing.
Stack some money to buy the greatest dip in the FINANCIAL MARKET HISTORY.


#TOTAL2 1DAY UPDATE BY CRYPTOSANDERS Welcome to this quick update on the TOTAL2 analysis.
I have tried my best to bring the best possible outcome in this chart.
A very good position for ALTS!!
Total2 still holds support and is testing the previous resistance trendline and the altcoin may pump
If it is broken and closed downside from the support level then the chart will be invalid.
Sorry for my English it is not my native language.
Do hit the like button if you like it and share your charts in the comments section.
Thank you...
