[UPDATE TOTAL2] It's always the same story. 2022 / 2024? Well, history rhymes.
This model suggests we could reach > 10T in total 2 market cap between 2023 and 2024.
TOTAL2 trade ideas

Will Altcoins perform a Perfect Bump and Run Pattern or Fail? 1. Leading phase.
2. Bump
3. Retest and Run.
Let's see.

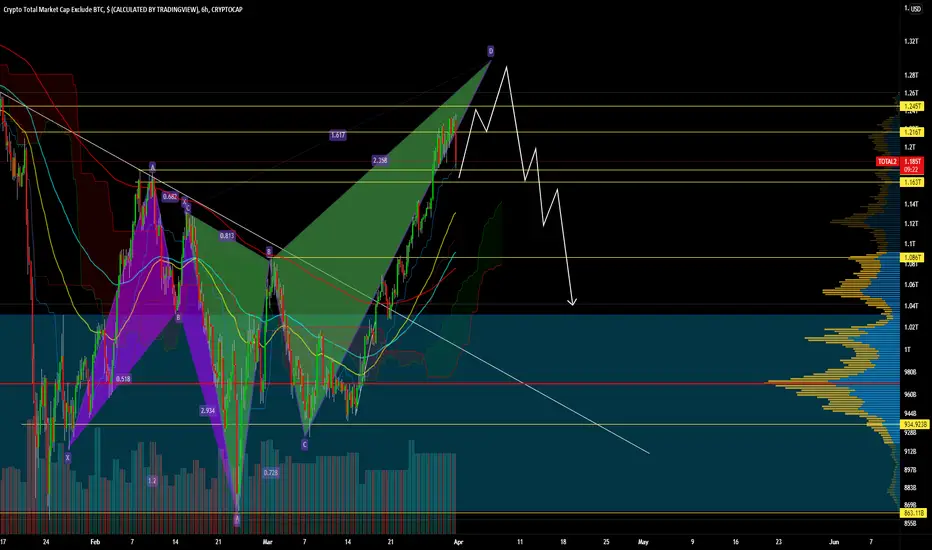
TOTAL2 : shows bullish signshello guys
-Over $31 million in #BTC Long Liquidations in 30 minutes on that recent move down,
And double this amount for the rest of the currencies.
-This game has become known and the price will return and rebound, and what supports this, looking at the TOTAL2 chart:
-There is a positive divergence with both stochastics and RSI
-The price was originally at the previously breached support area, to retest, and the current dive is only to liquidate long contracts. -- Also, the price touched the newly formed rising trend line - also a retest of the previously breached descending trend line.
-All this is useful for the market in the coming period.

Alt coinsI will be buying the dip on top alts it’s clearly still inside an uptrend channel even if btc drops to 40k it will stilll be well inside. for now could retrace to lower supports so keep an eye but overall bullish

TOTAL2 - We are quite safe from BearsThe 50MA is protecting us from Bears
This 50MA on this Weekly timeframe will most likely hodl and lead to a big price hike in price
Simple yet effective Analysis

TOTAL MARKET CAP 12 HOURS UPDATE Hi guys, This is CryptoMojo, One of the most active trading view authors and fastest-growing communities.
Do consider following me for the latest updates and Long /Short calls on almost every exchange.
I post short mid and long-term trade setups too.
Let’s get to the chart!
I have tried my best to bring the best possible outcome in this chart, Do not consider it as an
My previous total 2 charts is going wall currently It is lying on the support of this EMA.MACD crossover is showing bearish momentum. RSI has entered the oversold region. We've to wait for a sustained breakout/breakdown to confirm the next move of ALTS.
This chart is likely to help you in making better trade decisions, if it did do consider upvoting this chart.
Would also love to know your charts and views in the comment section.
Thank you

TOTAL2: ALTS STARTS BOUNCING AGAIN SOON!!Hello everyone, if you like the idea, do not forget to support with a like and follow.
Welcome to this TOTAL2 aka Altcoin market cap update. Total2 is the market cap of the whole market excluding BTC means which measures the market cap of all the Altcoins.
Total2 forming an Adam&Eve pattern 12hr time frame. After the breaking out of the neckline currently it is going for a retest. The retest level is at around $1.14T from where we can expect a good bounce in Alts.
As of now, it's better to wait for a long entry and if you holding any then hold only on spot.
If you like this idea then do support it with like and follow.
Also, share your views in the comment section.
Thank You!

Crypto danger if....If it closes the daily inside the downtrend again....I better unload some cryptos

Crypto correction3 tops...odds are that the uptrend is broken....a possible support in pink rectangle

Total 2 alt coins marketcapDon’t get this wrong , buy the dip rally has started this is a pullback only from recent highs

total 2Im seeing momentum here in Total 2. We are also approaching resistance in the near future. Enjoy the pumps but also take some profit

Market cap of alts looks very promising for next weeks/monthstotal market cap .. higher lows... MACD weekly bullish crossover - STRONG signal because of weekly :) keep it eye on that guys... together with btc.dominance chart it is very important to know those dependencies and overall market conditions :)


Altseason 100% started!Altseason has definitely STARTED! My btc.d idea is processing correct, my usdt.d idea is processing correct and now this pattern broke up and is ready to make total 2 and 3 fly up to the sky! a falling wedge in total2 has been broken and the target is the top of the falling wedge which is 1.7 trillion. Ofcourse in my opinion its gonna go higher this time and make altseason more epic! this idea is linked with my btc.d and usdt.d idea if you haven't read them please do below! Altseason is right now happening! Buy more alts quickly!!!!

TOTAL2 finding new range 🕋Greetings,
What is total2? TOTAL2 shows total market capitalization of the top-125 cryptocurrencies, excluding Bitcoin.
Both total & total2 are extremely important tickers on TradingView to use as analysis tools and general understanding supply and demand within the markets.
Another chart I like to use it when assessing TOTAL & TOTAL2 is the 1YR HODL chart. You can see with the picture below that the HODL Wave typically declines as BTC price increases; and rises when BTC price decreases. This could be used as as an indicator to time market entry/exit.
1YR HODL WAVE
Remember, nothing is guaranteed, control the controllables.
Mogues
