ALTS MARKET CAP ANALYSIS. Altcoin Market Cap Analysis: Potential Rebound or Breakdown?
The altcoin market cap is currently bouncing off the support trendline of its ascending triangle pattern, which indicates a potential bullish continuation.
Ascending Triangle Support:
The market cap is testing a key support trendline within an ascending triangle, which is typically a bullish formation.
Sustaining above this level strengthens the case for a breakout.
Ichimoku Cloud Indicates Bullish Momentum:
The Ichimoku Cloud is turning supportive, which indicates an improving market sentiment.
A move above the cloud could confirm bullish momentum.
Possible Scenario:
If the price sustains above the trendline, the altcoin could see a strong bounce, leading to further gains.
A breakout above the resistance level of the triangle would confirm a larger uptrend.
A break below the support would invalidate the bullish structure.
This could lead to a deeper correction, which indicates increasing risk.
If you found this analysis helpful, hit the Like button and share your thoughts or questions in the comments below. Your feedback matters!
Thanks for your support!
DYOR. NFA
TOTAL2 trade ideas

Resistance at 1.3T: Is a Deeper Crypto Correction Coming?The long-awaited Trump inauguration, which was expected to trigger an altcoin season, had the exact opposite effect. This once again proves that when the majority of market participants expect one outcome, the market often does the opposite.
After several days of testing support, the "tax policy" announcement triggered a breakdown below the 1.3T level, causing Total 3 to drop around 30% to 1T.
The market is now experiencing a normal rebound, but I am not very optimistic in the medium term.
Technically, 1.3T has now turned into strong resistance. In my opinion, after this rebound, a new leg down is likely.
I expect a drop below 1T, potentially reaching around 900B in the near future.

Total 2 Marketcap - Is this cycle repeating the last two cycles?In this analysis, we are discussing the possible repetition of the last two cycles by the total 2 (Crypto Total Market Cap Excluding BTC) on the monthly timeframe. By comparing this cycle in conjunction with the RSI and the Stochastic RSI with the previous two cycles we could make a statement that the market might follow the same bearish signals.
What did we see in the previous two cycles with regard to the price action and RSI
In both bullmarket cycles we saw the total 2 making highers highs and higher lows. In both instances the RSI made a lower high while the price action made a higher how consulting in a bearish divergence on the monthly timeframe.
What did we see in the previous two cycles with regard to the price action and Stochastic RSI
In the last two bullmarkets we saw the Stochastic RSI (momentum indicator) rising to levels above 80 on the indicator, overbought territory. This means that the momentum to the upside in the Crypto market is immense. However, in both instances the Stochastic RSI was in overbought territory during the first top. After the first top the momentum weakened and thus resulting in bearish momentum below level 80.
However, the momentum weakening, both cycles made a new higher high. By making a new higher high the Stochastic RSI made a bullish cross around the 40/50 level. Nevertheless, after making a new higher high and a new Stochastic RSI cross up the price fell, resulting in another bearish Stochastic RSI cross down.
What we can conclude is that in both previous cycles the Stochastic RSI made a cross down below the 80 level at the first top and made a second cross down around the 40/50 level during the final top.
How does the previous cycles relate to this current cycle
In this current bullmarket we see the Total 2 Marketcap rising and making higher highs and higher lows. However, this cycle looks alike the past two cycles in comparison with the price action, RSI and Stochastic RSI.
This Cycle the price action made higher highs and the RSI made a lower high. Thus, resulting in a bearish divergence.
Also, in this cycle the first peak occurred with the Stochastic RSI above the 80 level and breaking down at a later moment, resulting in bearish momentum. However, this cycle did the same as the previous two. With the bearish momentum the Total 2 Marketcap made a new high with a second Stochastic RSI cross down at the 40/50 level.
Conclusion
This cycle looks a lot like the past two cycles in comparison with the RSI and Stochastic and thus suggesting that there is a possibility that we go in to a new bearmarket and repeat the last two cycles. The current evidence shows that the market might follow the similar path again.
What is a bearish divergence
A bearish divergence signify potential downtrends when prices rally to a new high while the indicator (RSI) refuses to reach a new high and thus making a lower high.
Thanks for your support!
Drop a like and leave a comment to have a conversation about this topic. Make sure to follow me so you don’t miss out on the next analysis.

TOTAL2 - Weekly Support Possibility The middle of this indicator was previously seen as a strong support
Right now this is being tested as support right now
Will it act as support as before or break down further?
Weekly timeframe for this indicator which is still in its bullish state

TOTAL2 - Bull IdeaAfter some short term bear movement I expect a strong bull move as we enter the final stage of this bull market
I have shown this bull movement with the green bars pattern with an extension up to 1.272
Don't get shaken out as we are in a large green upward channel
Daily timeframe

TOTAL2 \ #Altcoins Total2 alts mcap 936b major support retest phase is completed and then a new run will begin

TOTAL2 - Daily Uptrend RetestI think price will retest green circle, a point which was seen as a great support point leading to a strong bull move.
This bull move may occur again on this second retest of the upward white line within this broadening structure
still bullish it just may take another test of this downward movement
Daily timeframe

Altcoins Ready to Soar!By forming solid lows, it reaches a good zone where it can target the equal highs at 1.35

Total2 - threatening cycle top. 3W 21 SMAThe total2 is currently losing the trendline that it has held since 2017 for a second time. We were able to push back up through it last year.
Circled in purple are the times in history that the Total2 has came in contact with the 3W 21 SMA and either battled the 3W 21 SMA only to come back down through it...and close candles below it. Every time that this has happened, it has either been a market cycle top leading into a bear market, or the COVID crash...which was coming off of a market cycle bottom...so it is a tad different.
What are we doing in current time? We are losing the 2017 trendline for a second time this cycle, and we are also battling the 3W 21 SMA for a second time this cycle. If we don't have a very strong rally to push us up and out of trouble, then chances are we have a big crash, and perhaps fall into a bear market.
We are coming off of 3W bearish divergence playing out on the RSI and Stoch RSI, and the stoch RSI momentum is pointing downward. The 1W stoch rsi is oversold right now, though. So, price action on a weekly basis is what can save us, but it is looking pretty grim.
Downside targets would be 841B at the .50 fib, and 688-720B at the .618 pocket area.

We are due a 2017 style ALT season.One for the memory banks!
Now
do we actually get what we are "owed" ?? :)
We don't know
and nothing is owed to us of couurse
But
Selling too soon could be quite disastrous... as many peopleI speak to say to me 5X - 10X I am out..
Which may be prudent
If you are out. Stay out and don't FOMO back in again near the tops
So it's best to scale out in my opinion
last cycle was a quite difficult Alt season ... some bag holders actually did not get to experience any euphoria
Hence why I am leaning to an exsplosive alt season
BTC at $70k doesn't feel euphoric
so what will it take?

TOTAL2,CHART Analysis This is a 1D (Daily) Chart of TOTAL2, which represents the crypto market cap excluding Bitcoin. Here's the technical analysis based on the chart:
Key Observations:
Market Structure:
CHoCH (Change of Character): Multiple CHoCH signals indicate trend shifts.
BOS (Break of Structure): Bearish BOS confirms lower lows and downward momentum.
Support & Resistance:
Current Market Cap: ~$1.07T
Major Resistance (~1.3T - 1.5T): Marked by red zones indicating supply areas.
Strong Support (~900B - 1T): Blue zone suggests potential demand.
Next Major Support (~720B): If price breaks below the current support, the next major demand zone is around 721B.
Moving Averages:
200 EMA (Blue): Currently above the price, acting as resistance.
Short-term EMAs (Orange/Red): Price is below them, confirming a bearish trend.
RSI (Relative Strength Index):
RSI is below 50, indicating bearish momentum.
No clear bullish divergence yet, meaning further downside is possible.
Potential Scenarios:
Bullish Case:
If price holds above the 1T support zone, a bounce towards 1.2T - 1.3T resistance is possible.
RSI reclaiming 50+ could signal a shift in momentum.
Bearish Case:
If the price breaks below 1T, a drop towards 900B or even 720B could happen.
Market remains bearish unless we see a significant break of structure (BOS) to the upside.
Conclusion:
Market structure is currently bearish.
The 1T support zone is crucial—if it holds, a bounce could occur.
A break below it could lead to a deeper correction towards 900B or lower.
Would you like a trade setup suggestion based on these levels? 🚀

March Altcoin Analysis Request – Drop Your Coins Below!Hi
The crypto market is heating up as we step into March! With major breakouts, liquidity hunts, and key levels being tested, it's time to analyze the best opportunities across altcoins.
Will this month bring altcoin season, or are we in for more shakeouts before the next leg up? Let’s break it down together!
🔹 Which altcoins should I analyze?
🔹 Are we seeing strength or just another bull trap?
🔹 Key support/resistance zones, trend shifts, and market structures
Drop your favorite altcoins in the comments, and I’ll provide technical breakdowns with precise levels and trade setups based on market conditions!
📅 Submission Deadline: MARCH 7th, 2025
🔹 Request Guidelines:
✅ Each member may submit one altcoin for analysis.
✅ Use the format: ETHBTC, ETHUSDT, or ETHUSD.
✅ Ensure you include the coin’s ticker symbol or full name.
Despite the harsh conditions, we’re committed to analyzing at least 30 altcoins and providing clear, unbiased insights to help everyone make informed decisions.
⚠ Important Reminder:
All analyses are for informational purposes only and do not constitute financial advice. Always conduct your own research before making investment decisions.
💡 The market is ugly right now, but this is also where the biggest opportunities are born. Stay focused, stay disciplined, and let’s work through this together! 🚀
Growing PainsHigh Chances of a reversal soon off the 1:0.618 window.
The falling star through the 0.618 signals the clue.
The market is currently shaking out weak hands; But according to the trend based Fib tool, the time may be closing in soon for a rally.
When the rally up begins, I do believe there is a high possibility that we break through our previous high. Main reasons due to the evolution of crypto and increased market participation.
This TA doesn't suggest that a trip to the 0.786 overshoot doesn't apply, but I think the chances of that happening are unlikely, but never impossible.
- Not Financial Advice -

Where Did Altcoin Season Go?Ah, Altcoin Season —that magical time when every random token is supposed to skyrocket, turning you from an average investor into a crypto mogul overnight. At least, that’s what the hype says.
Yet, despite endless Twitter (sorry, X) posts and YouTube thumbnails screaming, "It's coming! Any day now!", it still hasn't arrived.
So, let’s cut through the noise and ask the real question: Why didn’t Altcoin Season happen?
________________________________________
1. Everyone Was Expecting It—But Someone Was Selling
There’s an unwritten rule in financial markets: When everyone expects something to happen, it probably won’t.
Every self-proclaimed crypto guru has been yelling: "Altseason is here! 100x! To the moon!"
Meanwhile, someone was selling.
Instead of an explosive rally, we got some pumps followed by brutal sell-offs. Why? Because while retail traders were waiting for liftoff, big players were cashing out quietly. Someone always has to be the exit liquidity.
________________________________________
2. The Market Is Not the Same as 5 Years Ago
Just because Altcoin Season happened in 2017 or 2020 doesn't mean it will play out the same way again.
The crypto market has changed dramatically:
• No more reckless retail FOMO throwing money at anything with a flashy logo.
• Institutions have entered the space—but they don’t care about low-cap moonshots.
• Liquidity is more concentrated—Bitcoin and a handful of top coins dominate the inflows.
Altcoin Season thrived when everyday investors piled into random projects without thinking. But after multiple crashes and rug pulls, that blind optimism has vanished.
________________________________________
3. Projects Make Promises, But Don’t Deliver (Shocking, Right?)
Let’s be honest: Who makes the most money in crypto projects? Right—the developers.
Every market cycle, we get new buzzwords: DeFi revolutions, AI-blockchain fusion, metaverse takeovers… but what actually happens?
• Fancy whitepapers, vague roadmaps—but great marketing.
• Tokenomics built to enrich insiders, not retail investors.
• Initial hype, then a slow decline—until the next trendy project appears.
At this point, we all know only a tiny fraction of altcoins provide real innovation. Without real progress, there’s no fuel for a true Altcoin Season.
________________________________________
So… Is Altcoin Season Dead?
Not necessarily. But it’s no longer a guaranteed, predictable event. The expectations have changed.
• Without new retail money flooding in, who’s pumping these coins?
• With Bitcoin dominance high, who’s paying attention to altcoins?
• If most new projects exist to enrich devs, why would an altseason even happen?
Instead of waiting for a mythical altcoin boom, maybe the smarter move is to ask yourself:
Am I investing in a solid project, or am I just hoping to be "the lucky one" who catches the next 100x?
Either way, good luck with your HODLing—and with those "If I had just invested $100 at that price..." screenshots.

A POSSIBLE STATE OF BEAR MARKET NOW, THIS WHAT MIGHT HAPPEN NEXTTOTAL2 tells a story for the ALTS.
Beyond 2018, there is a 2 accumulation area made, from 2018-2019, 2022-2023 and beyond that there is a pump.
Now as we take a look last pump, the december 2024 last pump bounce on that strong resistance now lately the strong support is broken also just like before cycle.
as we can see the pattern is so very similar to the last cycle, take note that probably the BULL MARKET started around 2023 and until 2024 it is longer unlike before run, i think altseason started already but it is on SELECTED coin due to overwhelming count of altcoins made, like SOL for example and other meme coins.
now heres the crucial part:
- if this will be followed a probable fall will be on the 800B level due to the last level around 400B is so deep to fall since institutions is embracing crypto now.
- if we believe altseason is not yet come, then the BOX on the right is the remaining days of 2025 meaning the window of time is very short? will 2 resistances will be break? or at least 1? also if thats the case then you believe that the run will go until 2026 which is i think its overdue.
- the run between oct 2023 until december 2024 i think is a long enough for bull run then accumulation around 2026-2027 then another cycle
- as we can see the HALVING part if we compare last time whats happening now is we are short on months so therefore 2025 is the last chance we get another pump but if WE BREAK the new resistance but for me it will rejected? lets see on the next, hoping for the best!
GOD BLESS!

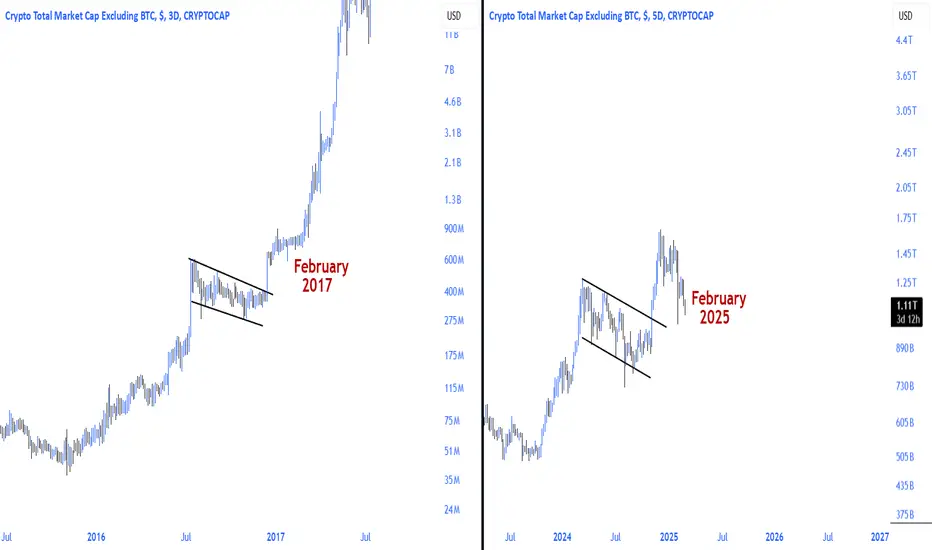
#Altcoins capitulation phase.Altcoins run started after the last correction stages towards the end of February 2017, before the parabolic run in the 2016 2017 altcoins bull run.
we are here
total2Accompanied by feelings of hatred, the biggest #Altcoins run in history will become inevitable!

Total2 Bullish Setup: Potential Altcoin Breakout IncomingThe Total2 chart, representing the total market cap of all cryptocurrencies excluding Bitcoin, is showing strong bullish signs, suggesting a potential altcoin breakout.
Should watch for confirmation signals such as increased volume, BTC dominance trends, and key breakout levels to position for potential high-reward altcoin opportunities.

Not enough bull pressure; TOTAL2 on the vergeThe only hope is the total2 breaking 1.27T, which is unlikely to happen.
Bulls pushed total2 from 1T to 1.22T, but they haven't managed to break the important resistance yet. We are seeing rejections, and we might soon see the start of bear pressure again.
Even if total2 breaks 1.27T, the 1.7T resistance needs to be broken to have the potential for an alt season. For now, as I said, this resistance must be broken, and if it is, we can see the bulls pushing to break 1.7T.
Otherwise, if nothing happens soon, total2 can fall to the previous low range, losing 1T. The 950B and 850B supports are crucial, and if they are lost too, 600-650B will likely be touched. This will also complete the inverted Head & Shoulders pattern in the higher time frame.

Altcoin Anarchy: A Wild Ride Ahead?Altcoin Anarchy: A Wild Ride Ahead?
The crypto jungle is stirring. Rustling leaves, chattering monkeys, and a distinct scent of… gains? Could it be? Are we on the verge of another altcoin explosion? Forget the tranquil Bitcoin dominance – the altcoin zoo might be about to throw a party. And it's not going to be a polite tea party.
Why the Crypto Chaos?
Bitcoin's Boredom (Maybe): Bitcoin's been acting a bit… predictable lately. Like a well-behaved elephant, it's plodding along, which, ironically, can be a good thing for its smaller, more agile cousins. When the big guy chills, the little guys get to play.
Dominance Dwindling (Perhaps): Is Bitcoin's crown slipping? Maybe just a little. A slight dip in dominance can be like a red rag to a bull – in this case, the altcoin bull. Capital starts sniffing around, looking for juicier pastures.
Tech Tsunami: The innovation faucet is gushing. DeFi is evolving, NFTs are getting weirder (and sometimes, more practical), and the Metaverse… well, the Metaverse is still trying to figure out what it is, but it's attracting a lot of attention (and money). All this tech wizardry fuels the altcoin hype machine.
FOMO Frenzy (Potentially): Humans are wired for FOMO (Fear Of Missing Out). When one altcoin starts mooning, everyone else wants a piece of the action. This can create a self-fulfilling prophecy, driving prices up and up, fueled by pure, unadulterated greed (and a little bit of hope).
History Rhymes (Sometimes): Crypto history doesn't always repeat, but it often rhymes. Past bull runs have often followed periods of Bitcoin consolidation. Are we seeing a repeat performance? Maybe. Or maybe not. That's the beauty (and terror) of crypto.
Navigating the Crypto Carnival:
DYOR (Do Your Own Research - Seriously): Don't just blindly follow the hype. Do your homework. Understand the tech, the team, and the tokenomics. Otherwise, you might end up holding a bag of… well, you know.
Diversify (Spread the Risk): Don't put all your bananas in one basket. Spread your investments across multiple altcoins to reduce risk.
Stay Vigilant (Be Aware): The crypto jungle is full of predators. Be wary of scams, rug pulls, and pump-and-dumps.
Manage Expectations (Be Realistic): Don't expect to get rich overnight. Crypto is volatile. Be prepared for wild swings and potential losses.
The Bottom Line (Sort Of):
The altcoin market is a wild card. It's unpredictable, irrational, and sometimes downright insane. But it can also be incredibly rewarding. If you're brave enough to venture into the crypto jungle, do your research, manage your risk, and buckle up for a wild ride. Just remember, it's a jungle out there.
Disclaimer: This is not financial advice. This is just a random collection of thoughts and observations about the altcoin market. Investing in crypto is risky. You could lose all your money. Don't invest what you can't afford to lose. And for the love of Satoshi, do your own research.

Time Circles Roadmap for Total2to understand this Magic subscribe and pay for Exaado
targets
2000 Billion $

Altcoin Golden Cross Formed Last Week - First Time in 4 YearsTrading Fam,
You are probably tired by now of seeing all the hopeful headlines, predictions, and analysis while altcoins continue to descend. I am too. Therefore, I am going to sound a little more pessimistic in this post. Some call this 'realistic' but whatever ...semantics.
While I am hopeful that an altseason will occur, I am also beginning to become less and less convinced that anything like we experienced in the past will occur again. The longer we go without seeing the beginning of our altcoin cycle, the more time altcoins have to dilute the capital pouring into the market. There are just so many altcoins to choose from now and literally hundreds or thousands more are being created weekly by way of memecoins. As the meme on my chart illustrates, those pouring in are spreading their resources out much more thinly now because there is so much more to choose from than there was in 2021. Therefore, what pump we may see in our own investments may not equate to what we expect. And if we are not careful to pick the right coins, it may not even equate to the average profit that was realized in the altcoin market in 2021.
So, here's the deal. By now, you may or may not be aware that a couple of weeks ago our altcoin charts showed us something we haven't seen in over four years! It was the golden cross. This event occurs when our 100 DMA crosses above our 200 DMA. In this case, white represents the 100 DMA and red represents the 200 DMA. They are both SMAs. This event is supposed to be an amazing indicator and a lot of analyst were using it to say that we that our altcoin season has now begun. This very well could be the case, but also, we could drop further and use one of those moving averages as support before any real bounce occurs. Furthermore, past history should never dictate current. History may not in fact repeat and altcoin season may not occur at all. It doesn't have to. Maybe this time we don't get one? This is simply something we should realistically consider.
Now if it does occur, excellent! This is what I personally have been banking on. So, the other thing I want to discuss a little bit more is what actually occurred in the altcoin market last time this happened in 2021. You can see from the chart, that once the golden cross occurred, the race was on. Price essentially continued up through May, dipped from May through July and then continued up again from July through November. So, if you held from the beginning of the cross to our peak in November, you would have realized average altcoin gainz of around 500% (or 5x).
Now, let's say the same thing occurs this year. Our golden cross occurred two weeks later this year than it did in 2021 but I don't think that makes much of a difference. Essentially, if this altcoin season is truly beginning right now, we'll have about 9-10 months of upside with the potential of a big dip somewhere there in the middle. That dip in 2021 was about a 60% drop from top to bottom and paper hands folded quickly during that time thinking the top was in.
If similar price action occurs this year, then we may have 9-10 months to capitalize on alts but again, with a huge exception ...only the best of the best in alts will perform up to this 5x standard or better. You know, stuff like Doge, XRP, SOL, ETH (yes, I said ETH), etc. The OG classic boomer alts.
But what about memecoins?
IMO, a select few memecoins could still do very well, however, we have to be honest here. We are playing roulette. Despite what Murad and others on X continue to preach about belief and conviction and religiosity of the coin, the number of holders, yada yada yada, in the end, we have to be honest with ourselves or we will lose money. Memecoins are simply a big casino. Some will do very well and make their millions. You'll hear from these lucky bastards incessantly I am sure. The fact that they turned 100 dollars into $100,000,000 will be advertised on X and other social media platforms ad nauseam. You will want to go throw up because you were at one time in one of these memecoins too. And then you sold. And these are the stories you won't hear. You won't hear about how many failed. You won't hear about how many degens went broke chasing this imaginary illusion, this pipe dream, of unlimited wealth filled with lambos and yachts with girls. You won't hear that most memecoin traders lost money rather than gained.
I don't want to end too pessimistically here because I am playing the memecoin game too. I'm in the casino and spinning this wheel. Maybe one day I'll be one of those lucky bastards that wins. As of today, that is certainly not the case (just being honest) and I certainly don't stake my life savings on it. So, all I am suggesting here once again is to be cautious. Have fun. Play the game if you wish and I hope you win. But also, be careful, pick only the best of the best, and NEVER risk more than you can afford to lose.
Here's to hoping this is truly the beginning of another altcoin run.
✌️ Stew

