#TOTAL3 ( cup & handle pattern ? )Possible movement pattern can be cup and handle pattern.
The condition for its formation can be passing the edge of the cup from
the location of the red arrow.
The possible formation of this pattern can lead to the good growth of altcoins
TOTAL3 trade ideas
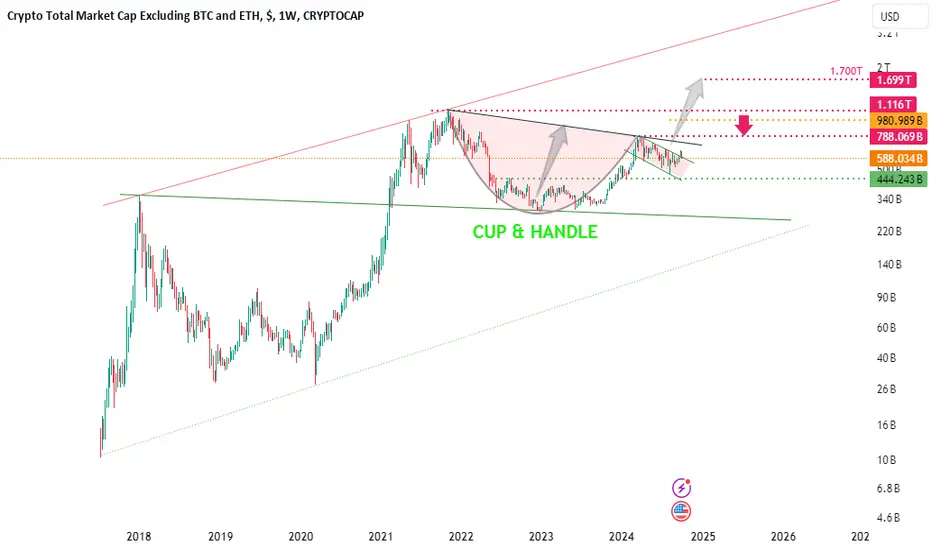
Chart Idea - TOTAL3 to the moon !TOTAL3 finally broke out the bull flag. Raging ALT season is here. I am super bullish on ALTs atleast until Jan 2025. This is one of the best chart out there. I do not need to explain here as everyone who knows about the ABC of trading would know what a bull flag break out is and what the TP would be.
Let's go to the moooooonnnn !!!!
NOT A FINANCIAL ADVICE! DYOR

#Alts parabolic run loading step by step!#Altcoin continues to provide historical buying opportunities as in q4 2020 and previous cycles!
#Alts parabolic run loading step by step!
#Bitcoin ➡️ #Ethereum ➡️ #Altseason ⏳

#Altcoin run is programmed in the medium term.2025 will be unique for #Alts and #Bitcoin
The impact of the elections in the US on financial markets can be significant. A win by #Trump or Harris could have different effects in terms of economic policies and market expectations. If Trump wins, it is possible that prices will rise even more due to high inflation expectations in the markets. If #Harris wins, it is expected that the #Fed will continue with its current monetary policies, so although there will be price fluctuations in the short term, it is possible that the bull run will continue in the long term.
It should not be forgotten that the election results are not only related to short-term effects, but also to medium and long-term economic fundamentals and central bank policies. 🤝

Final capitulation of altcoins to BTCI think we are waiting for the final capitulation of altcoins in the next 2 months, to be honest I did not expect this scenario, but we have what we have, I have already written that I think December is the best entry point for ETH and altcoins.

#ALTseason programmed...
Like the 4th quarter of 2020, the 4th quarter of 2024 is a significant accumulation period for the crypto market, especially #Altcoins , ahead of MEGA BULL.

Finally Altcoins Are Ready For Massive Bullish Rally Finally Long Awaited Consolidation Has Broken Its Massive
Descending Broadening Has Already Confirmed Seems Like Crypto Market Will Continue Recovery In Coming Weeks Expecting Strong Bullish Rally In Good Reliable Solid Projects To Give At Least 2 3 x Bullish Rally In coming Weeks

And from here WE PUMP!Total3, which tracks the market cap of all altcoins excluding BTC and ETH, is flashing strong signals that it's gearing up for another leg up within the next 1-3 days. Currently, the altcoin market cap is sitting at $625 billion, but projections indicate we could see it rise to $680 billion, adding an estimated $50-70 billion of fresh capital into the altcoin space.
This influx of capital could be a catalyst for significant price action across the board. Historically, when Total3 breaks to the upside, we see explosive moves in many altcoins. Smaller market cap coins could potentially surge 2-5x as liquidity flows into them, with traders seeking high-risk, high-reward opportunities. Meanwhile, larger altcoins and top-tier projects are likely to continue their upward trajectory, hitting key targets and executing their projected moves with ease.
For traders and investors, this upcoming wave could present a unique opportunity to ride the next big altcoin cycle. The altcoin market is poised for a boost, and understanding how to navigate this surge could be key to maximizing gains. Keep a close eye on price movements and be ready to act quickly as the market could move rapidly once the breakout occurs. This is a moment that could define the next phase of the bull cycle, with the potential for life-changing returns if timed correctly.
Be sure to manage your risk, follow your strategy, and stay updated as we approach this crucial moment in the altcoin market!

Total 2 (Alt season) N.NZ IdeaMY COINS FOR ALT SEASON?
Category=
1)
sol/ton/ftm/aidoge/turbo/dog/sand/xai/floki/bonk/jasmy/baby mana/bome/people/popcat/gala/wif
2)
near/aave/arb/grt/blur/doge(Elon msk)
3)
fil/eth/bnb/kas
*Important news:L2/Trump/Ai Meme Trend/Meta Verse/Game/Telegram Trend!
When? Novamber-December-...
Future_No_1_NZ

AltsAlts
Bullish on the macro level
EMA 25 W, acting as support
If the weekly candle closes above 630 B, than further uptrend can be expected
At the moment, 10% increase can be expected.

MA200 Total 3So finally on Total 3 , we can see that it has been hit the MA200 on daily time frame which it is very good sign for us that Alt coins trying to moving up , we need to wait to make sure that the price can consolidate above MA200, than for sure we can open long position trades on most of the Alt coins those who still under the MA200 (like DYDX,MANA,ENJ,CAKE ...) because they will try to moved upward at least to their MA200 area price.
will update you again when i make sure of this and when i want to open a long position for my self.
cheers and have successful trades with money management and risk management.
Regard
Omid ghafarian

ALTCOINS - Weekly Looks BullishTOTAL3 has continued to flip our old resistance into a new level of support. This could indicate money flow into altcoins very soon.
That altcoins to watch this week based on market structure: 10/13/24
Weekly Dojis:
GRT
OP
JUP
DOGE
IMX
Key MA Tests:
RENDER
SHIB
ARKM
FTM
FET
SEI
APT
ETH

Total MC excluding BTC ETHTotal Market Cap excluding Bitcoin and Ethereum Weekly shows a 1Trln or 3x increase could be incoming when the parabola starts macd is just flipping bullish with an rsi above 40 bullish af We know to achieve this some ALTs will do 10-50-100x but you won't get this sitting on the sideline

fcking bullish for alt seasonThe inverse head and shoulders pattern, along with a pullback on the chart, is a clear bullish signal for altcoins and needs no further explanation. At this point, we are facing only two possibilities: a world war, or an altseason!

The Alt token market (TOTAL 3)This is one of those charts that does not need a huge amount of explanation. It is a 5 day chart comparing October 2020 (prior to the bull run that followed over the next 6 months). There are many fractals with that time and the present day.
1) Notice the life cross? Green arrows.
2) Notice the 5-day/200.sma resistance before the breakout? Red arrows?
3) Following the breakout price action in October 2020 the candle body closes were exactly 22% above the life cross and never closed lower just as it is today.
4) This idea is a continuation of the “Total 3 market capital to 10x” idea (below) that was published in July 2023. The bull flag informs us there remains another 500-600% return. Some still think is this a bear market. What gives?
5) Just as it was written in the first idea, “It is not my expectation for legacy tokens to participate in this bull market”. Hear this raw. LTC, DASH, MATIC, XRP, you name it, the big legacy market capital tokens are not participating in this bull market. Receive many messages explaining with this point of view is “wrong” despite the lacklustre price action. Remember, emotions are a Maccy D’s recruitment tool, I mean emotions are a money killer.
6) There’s a whole bunch of other fractal info shared elsewhere but the overall picture is well presented here. The next 6 months will transfer wealth for those with a plan.
Ww
Total 3 market capital to 10x

TOTAL 3 - 1D - Broke the flag to the upsideTOTAL 3 - 1D
This index takes the TOTAL of the value invested in crypto discarding the weight of BTC and ETH.
At the moment, TOTAL 3 has strong bullish signals because it has broken the flag at the top and has just made support without re-entering to return to the bullish path.
At the moment, it is much more interesting to be positioned in these values: SOLANA, TON, TRX, DOGE, ADA, BNB, XRP...
Since its bullish technical aspect would already be confirmed.
As always, this position is interesting as long as the SLs are not lost.
All these strategic alternatives can be configured with TradeX BoT, since it will allow you to position in both directions without having to block any amount per position. It will only be necessary for the conditions to be met, either downwards or upwards, for the orders to be executed in one direction or the other, taking the necessary deposits from your wallet.
TradeX BoT (in development): Tool to automate trading strategies designed in TradingView. It works with both indicators and graphic design tools: parallel channels, trend lines, supports, resistances... It allows you to easily establish SL (%), TP (%), SL Trailing... multiple strategies in different values, simultaneous BUY-SELL orders, conditional orders.
This tool is in the development process and the BETA will soon be ready for testing.
FOLLOW ME and I will keep you informed of the progress we make.
I share with you my technical analysis assessments on certain stocks that I follow as part of the strategies I design for my portfolio, but I do not recommend anyone to operate based on these indicators. Get informed, train yourself and build your own strategies when it comes to investing. I only hope that my comments help you on your own path :)
TOTAL3 Projecting 70-90% leg up. indicating ALTCOIN SEASON!So TOTAL3 mcap looking very bullish on daily time frame.
It does look that mcap might double in upcoming year.
Pack your bags and get on the space ship, we going to the moon!

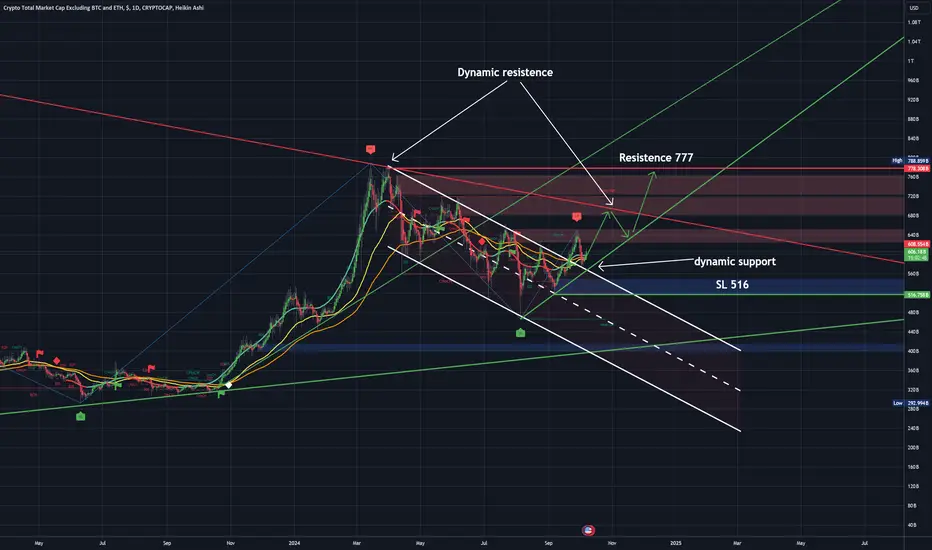
TOTAL3 update - Oct 04 2024Previous analysis on #TOTAL3 played out pretty well. TOTAL3 touched the first target of 650B and then dumped below the descending mid-term trendline again (because of BTC's dump).
Since TOTAL3 is probably retesting the mentioned trendline as well as the short-term blue trendline, 600B zone is the area we can expect the dump to continue towards lower levels particularly the the recent low of 516B. So Sell strategy is advised.
This analysis is valid only if TOTAL3 doesn't rise above the two trendlines.

Non-Farm Payroll to decide market direction.Market is at a crucial point, It had broken out of the channel on 20th Sep & it's now testing it.
NFP Report will be crucial.

The Altcoin Market Is Now Flirting With The 350 DMA ...Again!Here's what that means. A long-term view.
Traders,
The pressure is on for these altcoin bulls to run through the end of the year. However, we are flirting with disaster this time around. Here's why?
From the beginning, the 350 DMA (or 50-week MA) has always told traders whether we were in a bull market or a bear market. Though periodically, the price did stick its proverbial head above the 350 DMA during mid-cycle tops, these were always very short-lived. And it's always been the case that when we've remained above the 350 DMA for this length of time, in this case since Nov of 2023, it signaled we were in a bull run, as opposed to a mid-cycle top. Could this time be different? Well, of course. And I think from looking at the charts, it already has proven it is. This whole run is different.
I won't get into the many ways this cycle is different, but a big one has to do with how the 111 DMA is diverging from the 350x2 DMA (not pictured here). That's never happened before along with a multitude of other occurrences. So, let's explore this thought experiment a bit further. There are several outcomes that we most probably are looking at.
The first outcome could mean that this run was simply an extended mid-cycle top. If true, then this is a much longer mid-cycle top than we have ever witnessed in the history of crypto. And if that is true, the bull run that is coming will melt faces. But it probably would not arrive until next year or even 2026 and it probably means that we dip back under that 350 DMA again for a while. Nobody wants this to happen and nobody seems to be expecting this outcome. Could this then be the strongest possibility? If we anthropomorphize the market a bit, we can observe that it is rather sadistic in this regard. It always has been and probably always will be. The market just enjoys hurting the largest crowd. This is why it's often beneficial to entertain contrarian thought and not to simply dismiss it altogether.
The second outcome is not so good. It could mean that we skipped our mid-cycle top completely and that our bull run is about to end if we dip below that 350 DMA. Now, there is still hope here because we haven't done that yet. But I certainly do not like the looks of how we have been flirting with that line for these last several months. This moving average is critical! Watch it closely on both the daily (as a 350 DMA) and on the weekly (as a 50). The weekly will confirm whether we drop or not. It must be confirmed with two candle closes below on the weekly.
There is a third possibility. This is the one that I think we are all hoping for and, tbh, most are expecting. It also indicates that we skipped our mid-cycle top and are in a bull run that will not end until late this year or into the next. This would mean that we will remain above that 350 DMA (though, there could be a few candle closes below) and that we should see some new highs being made through the end of the year.
I kept our chart on the daily view as opposed to the weekly because I wanted you all to track that bullish triangle with me. Notice how we are retesting the top of it as we should after a breakout. This is technically very sound. But also notice how that 350 DMA is moving up to lend some support. What a beautiful area of confluence! But also, scary. Because if it's broken to the downside, it may indicate either another Black Swan event on the horizon OR we don't get the bull run alts were expecting.
It is do-or-die time now. Let's go.
Stew

ALTSEASON 2TOTAL 3 is retesting the previous resistance trendline if the price will hold the current level into a support then this could be the continuation of #ALTSEASON!
If the price holds this level, we could see a move towards the 763.92B target. Keep an eye on volume and support levels to confirm the momentum shift.

Crypto Almost There... Ready for More AltcoinsCrypto is bleeeeedin'
Good thing is we were prepared :)
Waiting just a bit longer before deploying some stable.
Looking at Total 3 (Crypto Market Cap Minus Eth & BTC)
That zone is FOMC from Sep 18.
I'll be buying up my fav tokens then :)
-Mike Navarrete

ALT M.CAP: JUST DID A RETEST! HODL YOUR ALTCOIN BAG!!Hey everyone!
If you're enjoying this analysis, a thumbs up and a follow would be greatly appreciated!
What is Total3?
Total3 refers to the total market capitalization of all cryptocurrencies except for Bitcoin (BTC) and Ethereum (ETH). It provides a clearer picture of the overall market health of altcoins, excluding the influence of the two largest cryptocurrencies.
Now, let’s analyze its chart.
If you're worried about the recent dip in altcoins, take a look at this chart. Total3 has broken out from a bull flag on the daily time frame and is currently retesting that flag. If it holds at this retest level, we can expect another bullish rally in altcoins soon.
Don’t be scared by negative news like the war; such situations are temporary, and the market has rebounded many times in the past. Use this dip as an opportunity to dollar-cost average (DCA) into your altcoin positions. If you've already accumulated, just hold patiently.
What are your thoughts on Total3's current price action? Do you see a bullish pattern developing? Share your analysis in the comments below!
