ALTCOIN Will -20% With Elliot WaveCorrective wave is not end
It will going -20% to reach which is Altcoin will dumping more than 15%
TOTAL3 trade ideas


Quality structure.26D chart.
The dynamics are positive.
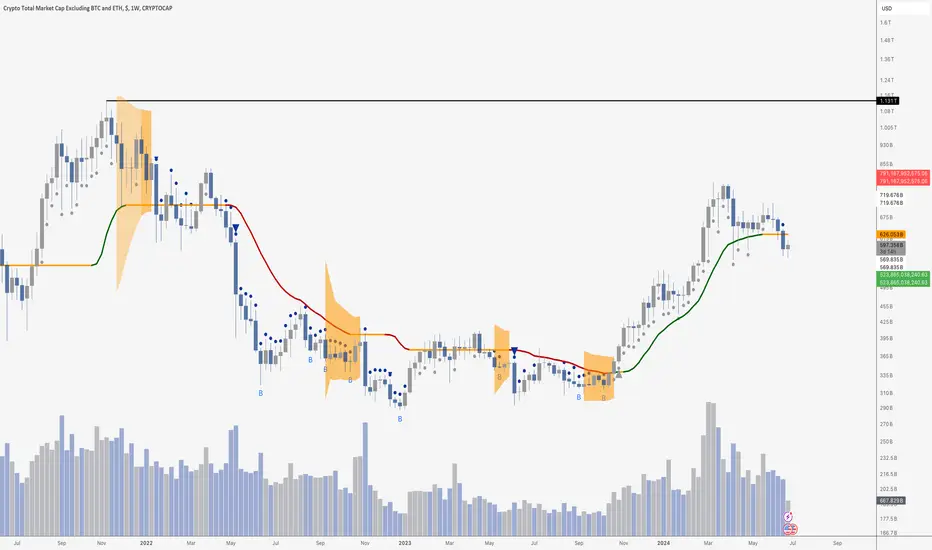
I think all of 2024 and most of 2025 TOTAL3
will go significantly above this red cloud stretched sideways.
That's what usually happens. If the candle and the kijun line
are above the green cloud, and the next sideways red cloud
is not too wide, the price will just be above it.
How high? Let's see.
I think it will be ok if TOTAL3 takes 3 to 4 trillion this time.

TOTAL3 Analysis (Altcoins) - June 27 2024TOTAL3 (crypto excluding BTC and ETH)
looking at TOTAL3 chart, it's obvious that altcoins, in general, are currently in low-risk zone and are suitable for some swing Buy/Long entries.
in fact you may have noticed that during past few days some coins have been doing better compared to BTC

TOTAL 3Total 3 is a chart of the entire market cap of crypto excluding BTC and ETH. It is a decent measure of the altcoin market as a whole.
It shows an interesting picture for altcoins. While Bitcoin made a new all time high, it is very clear that ETF money does not trickle down into the rest of the crypto market. Total 3 is barely over 50% of the all time high from 2021, when it reached $1.131T. It is currently at $597.2T.
Bears will tell you that altcoins are dead. Bulls will tell you that a massive altseason is inevitable.
It is up to you to choose, but it is clear that alts have a lot of catching up to do.
Something BIG is coming!The total crypto marketcap - BTC/ETH is showing us something incredible!
Get ready for .....

TOTAL 3 is bearishThe main structure of TOTAL 3 is bearish.
A trendline is break down. It is now below the resistance (flip)
By maintaining the supply, it can move towards the targets. The targets are clear on the chart.
Closing a daily candle above the invalidation level will violate the analysis
Note that the financial market is risky, so:
Do not enter any position without confirmation and trigger.
Do not enter a position without setting a stop.
Do not enter a position without capital management.
When we reach the first TP, save some profit and try to move the stop continuously in the direction of your profit.
If you have any comments please post them, comments will help us improve our performance
Thanks

TOTAL 3 BULLRUN ??Hello everyone.
We can see a similar structure to that of December - February (yellow triangles). It is possible that the bearish sentiment has ended. BOTTOM IS IN !!!!
The last phase of the cycle, THE BULL RUN, is about to START.
(NOT FINANCIAL ADVICE)

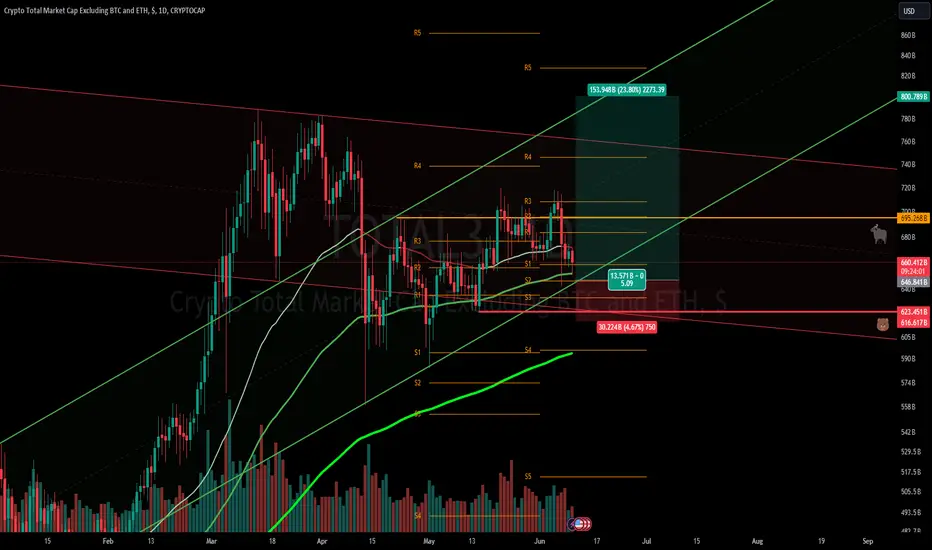
#TOTAL3 Market Update Here’s an important update on TOTAL3, reflecting the recent market dynamics and our analysis:
📉Recent Movement:
- After the dip of 7 June, TOTAL3 has returned to the center of its 9-week-long consolidation range (visible on the weekly time frame in the inset of the attached chart).
- Simultaneously, we observe a reversion to the center of the 50-day and 100-day moving averages on the daily time frame (main chart volume), alongside a rejection from the monthly R3 level.
🔍 Current Situation:
🔮We foresee two primary scenarios:
📈 Scenario 1: Consolidation and Attempted Breakout (Green Scenario)
- TOTAL3 consolidates around the current mark, fluctuating within a +/- 2-3% range, preparing for a second attempt at an upward breakout. This is the most favorable scenario.
📉Scenario 2: Reaction to US #CPI Data (Red Scenario)
- With the US CPI data release on Wednesday, stronger-than-expected results could lead to a pullback towards the monthly S3 level (approximately -5% across TOTAL3), followed by a swift rebound. In case of a very strong CPI report, a correction to the lower boundary of the red channel (-8%) with an even quicker recovery is possible.
- Both scenarios indicate long positions, differing only in the extent of corrections.
🚨 Key Levels:
- It’s crucial not to break and settle below the May 15th low, as this would invalidate the long structure, potentially leading to a total -12% to -26% drop in TOTAL3.
- However, given the robust ETF inflows and the anticipated launch of the spot Ethereum ETF, such a bearish scenario seems unlikely. Additionally, with the ECB’s recent rate cut, we might expect the Federal Reserve to follow suit within the next 2-6 months, usually lagging behind ECB to avoid destabilizing the currency market.
Stay vigilant and adjust your strategies accordingly.
---
Feel free to share your thoughts or ask questions in the comments!
CRYPTO TOTAL EX BTC AND ETH ALL trading ideas have entry point + stop loss + take profit + Risk level.
hello Traders, here is the full analysis for this pair, let me know in the comment section below if you have any questions, the entry will be taken only if all rules of the strategies will be satisfied. I suggest you keep this pair on your watchlist and see if the rules of your strategy are satisfied. Please also refer to the Important Risk Notice linked below.
Disclaimer

$ALT coin Update NASDAQ:ALT marketcap need to move above the trend line & hold it, then we will see a big bang in the month of July🚀 Expecting, a rally will start like feb - mar!

total3 is ready to break upwarthere is a perfect parallel channel and bull flag formation. A breakout to the upside is very close. I think this is a promising chart for alts.

BTC is King, more than everThis puny altcoins are breaking down against CRYPTOCAP:BTC
ETH is coming down since 2 years ago
Most Altcoins are bleeding against BTC
BTC dominance is going to 60%

What's next for altcoins ? TOTAL3 analysisAt present, the CRYPTOCAP:TOTAL3 , which excludes the Bitcoin and Ethereum Marketcap, is navigating through a critical phase. 'total3' has now come into contact with its short-term support level, a zone that has repeatedly demonstrated its strength and sturdiness, having successfully held up multiple times in the past.
This support zone is of paramount importance for the performance of alt-coins. In order for these alt-coins to see an uptick in their values, this support needs to prove its strength once again and hold firm. Moreover, the total market cap needs to experience a bounce back from its current position in the 600B zone. If these conditions are met, it could potentially lead to a significant price boost for the major alt-coins in the market.
However, there's always the possibility that this support fails to hold up. In such a scenario, the ensuing support is situated around the 500B mark, which is also a robust support level. Should the total market cap hit this support level, we can anticipate a bounce back. But it's crucial to note that if this support level is indeed tested, it could lead to a considerable number of alt-coins losing their value.
As of now, it remains to be seen which of these scenarios will play out. Personally, I am hoping for a rebound from the current support around the 600B mark, as it would bode well for the state of the market and the alt-coins in particular.
Follow our TradingView account for more technical analysis updates. | Like, share, and comment your thoughts.
Cheers,
GreenCrypto

Big couple and handle in formation on Total3 Hello
I see a forming coup and handle on TOTAL3 ( altcoins)
What do you think ?

Detailed Analysis of Altcoin's Market DynamicsRecent Market Performance
From October 2023 to March 2024, the altcoin market experienced significant growth, increasing from a $314 billion to almost $783 billion market cap—a remarkable 150% rise in just five months. Such rapid growth often leads to market corrections, which many retail investors find challenging to navigate. Recently, the market corrected by 29%, dropping to around $559 billion. This correction is considered healthy following the substantial growth phase.
Historical Market Patterns
Examining past trends provides insights into future market behaviors. For instance, in late 2020 and early 2021:
- Bitcoin Surge (October-November 2020): Bitcoin's price doubled from $10,000 to $20,000.
- Altcoin Lag and Subsequent Rally (December 2020 - January 2021): While Bitcoin surged, altcoins remained stagnant, causing investor disappointment. However, two months later, altcoins experienced a massive rally, tripling in market cap within a month.
This pattern of initial stagnation and subsequent explosive growth is reminiscent of current market conditions, where investor fatigue often precedes significant gains.
Near-Term Market Predictions
Key upcoming event: ETH ETF Launch on July 2nd
- Unlike the Bitcoin ETF launch, which did not trigger an immediate price surge, the ETH ETF launch is not expected to cause a dramatic market reaction on the day itself.
- The next 3-4 weeks are projected to be relatively sideways or bearish for altcoins, with a potential market reversal and new rally starting around mid-July.
Current Market Cap Scenarios
Two potential scenarios for the altcoin market cap leading up to and following the ETH ETF launch:
1. Reaching Blue Zone $534 - $550 billion market cap and bouncing.
- This is less likely unless there is bullish sentiment in the market, particularly if the $550 billion level is reached before or just after July 2nd.
2. Dropping to the $480 billion region (Green), testing the weekly moving average 200, and then bouncing.
- This scenario seems more logical, particularly if it happens around mid-July. Such a drop (another 15%) would likely induce market panic and exhaustion, setting the stage for a significant reversal.
Long-Term Outlook
Despite the short-term uncertainty and potential for further declines, the market is believed to be near its bottom. The long-term prospects for altcoins appear positive, with the market potentially reaching $1 trillion and setting new all-time highs. Therefore, even buying at current levels is expected to be beneficial in the long run.
Conclusion
The altcoin market recently grew a lot but then corrected, which is normal. Historical trends show that big gains often come after such corrections. We might see more sideways or downward movement before a big rebound around mid-July. Even if the market drops a bit more, it's likely near the bottom, and buying now could pay off in the long run.

$TOTAL3 Bullrun PathWe're just testing the 0.5 fibs as support as part of finishing up printing a massive Cup & Handle formation. Once the handle breaks through we'll have the 2021 ATH to battle then a free run up to where the top green trendline, the fibs 1.618 line, and the Cup & Handle measured move meet 🥳.
Good confluence, and can be applied for CRYPTOCAP:TOTAL , CRYPTOCAP:TOTAL2 , and CRYPTOCAP:OTHERS too. Timeframes really depend on when these charts + BTC can break out.

#TOTAL3 Altcoin MarketAnalysis📉 #TOTAL3 #Altcoin #MarketAnalysis
The overall altcoin market cap has hit the 200-day moving average 🟢BOLD LINE). Currently, this serves as the strongest mathematical support for the market. However, considering that markets don't always stop precisely at moving averages and the fact that we've dropped out of the main 🟢CHANNEL and settled below the monthly 🟠S3, I anticipate that the total altcoin market cap could retest the low from April 13th and revert to the previous month's S3 level (🟢559B). This represents a potential further decline of about -7% from the current levels. For individual altcoins, this could mean another drop of -5% to -25%.

CRYPTO MARKET CAP IdeaWhen everyone's panicking I only see opportunities. When you zoom out nothing looks that bad, everything looks normal. Pullbacks are inevitable!

Total 3 Vs. BTC At Pivotal Point - Breakdown Soon?Altoins (Total crypto market excluding BTC and ETH) valued against Bitcoin are at a pivotal point. They are retesting a previous extremely important point of resistance/support. Going back to last cycle, it was at this point in 2019 that the altcoin market broke down. It was at this point in 2020 that the bull-market was invalidated. And when this zone was finally broken in 2021 the bullmarket rally arrived.
Many have been confidently asserting the bull-market has arrived, and maybe it has for Bitcoin, however for alts the situation looks pretty dubious.
Bitcoin can stay at the same price, rally or fall - it makes little difference to the situation on this chart - altcoins may still crash.
A Bitcoin heavy portfolio has made the most sense for the past 2 years, and it still looks very sensible, based on this chart.
View Altcoins with caution.
Bias here is bearish.

TOTAL3 Setting up for violence Golden pocket 16% lower. Than we shall see. Failure to hold the Bears resume.

Altcoin Season 2025Crytocurrency alternatives are lining up for a deep descent in 2024, however, the timeline for 2025 points to serious altcoin run in the makings.
Simply posting for tracking and public historical reference.

Alt investment not looking too spiffy at the momentBroke trend and back testing former support. Needs to regain 707 and break back into the pattern building to an engulfing on 765 or alts are toast for the next few weeks. BTC.D continues to rally, even when BTC dumps and any pullbacks in it's dominance are being met with little demand for alts. This has been and probably will continue to be the trend for the current rally. Best bets for what little funding has been in alts will be low cap memes.
