TOTAL 3 bullish LFG! #Altcoin_summerTotal chart 3 (altcoin market without BTC and eth) looks bullish in my opinion. In my opinion, the market is getting ready for the end of the momentum correction and is preparing for a potential wave 3 in wave 5. The hidden bullish divergence on the strong D3 interval supports the increased probability of this analysis.
Altcoins such as FET, AR, INJ, MATIC, ARB, WOO, KUJI, etc. are ending their downward impulses, which may herald at least a corrective rebound or even an attack on new highs.
TOTAL3 trade ideas

Where is total 3 headed?A closer look into where the altcoin market might be going next on the 12 hour chart

This should be the bottomTouching the bottom support line of the triangle. Long! Risky but lets do it

Altcoins Still In A Bear Market? This Indicator Says YESIn this analysis I want to take a look at an indicator that is not often mentioned, but can say a lot of interesting things about the current state of the market.
Note: we only have a population of 2 (N=2) to look at and deduce information from, so take it with a grain of salt.
The indicator in question is the value of TOTAL3 (total crypto marketcap minus ETH and BTC) divided by the price of Bitcoin (BTCUSD). This indicator measures the strength of altcoins compared to BTC.
In other terms:
Indicator goes up = altcoins outperforming BTC, often during altseasons.
Indicator goes down: BTC outperforming alts, often during bear markets.
In the last 6 years there have been 2 strong alt seasons, which occured at a later stage during the Bitcoin bull-market. The indicator touched the bottom support and shot all the way up towards the top resistance. This caused a massive bull-run in alts, where many did a 10x or more in a matter of weeks.
Looking at the past, it seems that there's still more value to be lost in alts relative to Bitcoin. Assuming we have to touch the bottom support, of course.
Furthermore, nothing about this chart suggests that altcoins are a good investment at the moment. They're only losing more value against BTC, even during the latest move from 30k > 70k.
For now, I'd put an alarm around the bottom support. Once the indicator touches that area it's historically an AMAZING time to switch your Bitcoin to alts.
Happy to hear your thoughts!

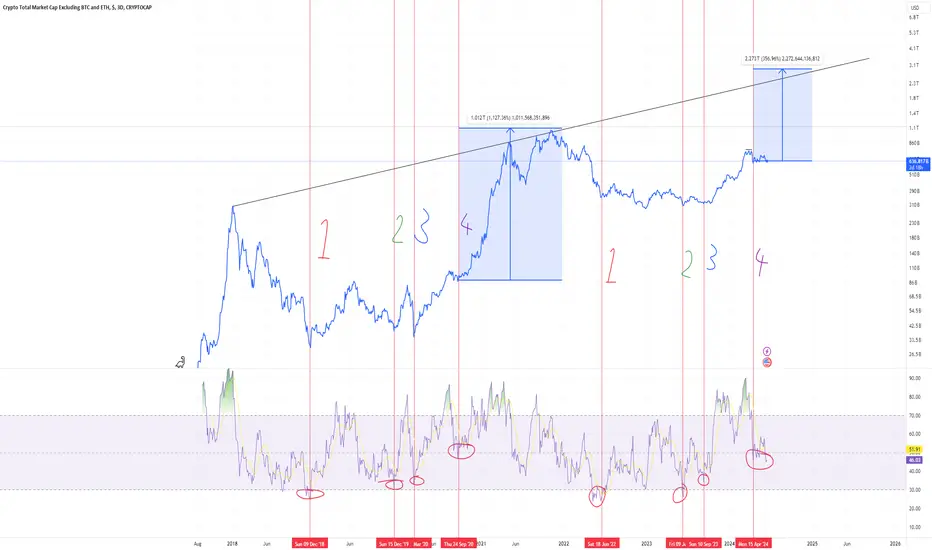
Total 3 interesting 4 step pattern with RSII'm either high asf right now or this is some genius chart analysis. The rsi and pa seem to have a repeating 4 step pattern that could, as history shows, lead to a big pump in the the altcoin market. I believe that speculative markets will begin to increase up until early 2025, starting between now and July.
The Massive Potential of June's BULL-RUNNow that all of the speculations are pointing to the approval of the Ethereum ETFs , along with the positive CPI reports this week, it's safe to assume that we're about to break out of the current accumulation period.
After +60 days of correction, everyone is eager to explore the potential of the next bull-run, so let's delve right into it. HOLD YOUR BREATH!
- STAGE ONE: MAKING A NEW HIGHER HIGH
In case you haven't noticed, on the 4th of this May, we have already broken out of the downtrend that lasted since the first day of April. However, we haven't made any higher high yet, so the bearish structure is technically still valid.
Thanks to a whole bunch of good news and won rounds for crypto in the regulatory and judicial war, starting with RIPPLE surviving court and -hopefully- ending with the Ethereum ETFs approval, a break of the bearish structure seems inevitable to me, leading to a surge towards the 700B milestone.
This is going to significantly refresh the alt-coins market, making up for April's harsh losses.
- STAGE TWO: SELLING THE ETHEREUM ETF NEWS
Now that things are looking greenish for the bulls, it's time for the exchanges to make money too. A minor correction and a retest of the 700B level would be reasonable, liquidating a ton of long positions, reigniting the trauma of the resistance that ended the February - March Mini bull-run and shaking more and more hands.
And of course, there's the excuse of 'selling the news' for the exchanges to use before liquidating the crypto Futures market.
I expect the traditional Alt-coins (ETH, XRP, ADA, etc..) and AI coins to perform extremely well at this stage.
- STAGE THREE: THE JUNE BULL-RUN
May wasn't as tough as we had expected, right?
Well, this cycle is just getting started surprising us. As June approaches, Alts should see positivity due to the impact of the adoption of Ethereum. And of course, the largest piece of that green cake will be handed to the holders of any Alts related to Ethereum.
We should see AI coins continuing their dazzling performance, promising projects related to RWA and Solana's competitors performing really well at this stage.
I expect this stage to end when Ethereum makes its new ATH and as July approaches, then we should see Bitcoin taking back the lead and making its REAL ATH. Because.. you know.. 73K wasn't a real ATH (whispers).
In my opinion, this scenario can be invalidated in two cases ..
First case is if the Ethereum ETFs get disapproved.
Second case is if we somehow revisit the current cycle bottom (highlighted on the chart).
So that was it! My humble advice?
- DO NOT use leverage, you don't need to challenge the exchanges and risk your capital. Enjoy a happy and calm June by buying your favorite coins on the Spot market.
- DO NOT hold your alts for too long after Ethereum makes its new ATH. Bitcoin has to take back the lead and make its way to a new ATH. Don't worry, you will get many new opportunities during Bitcoin's bull-run.
Note: This was an exploration of a potential scenario based on the current context and state of the market, not financial advice.

Altcoin/Bitcoin AnalysisAs I always say, when I look at the ALT/BTC parity, not the Bitcoin price, I see a downward break in the 40th week of 2019. This breakdown may happen again, it is possible. After this breakout, I expect to see a scenario in which Bitcoin becomes in a channel. (70 - 50k) This scenario would also not be contrary to the macro perspective of the markets globally. Another chart that supports this scenario is the USDT dominance chart. We can think that this chart will reduce the price of Bitcoin as it rejects the uptrend and rises to decide the continuation of the trend. Seeing the rise of Bitcoin dominance in this process signals to me that some altcoins in particular will be hit hard. Therefore, there will be great bleeding in the altcoin market, except for the solid altcoins. However, the altcoins that survive this process will make ATH much more performant as Bitcoin reaches its 100k target.

$TOTAL 3 or ALTCOINS are looking betterCRYPTOCAP:TOTAL 3 = NO CRYPTOCAP:BTC or CRYPTOCAP:ETH > is about to go nuts, IMO.
We spoke on the #BTC top some time ago & many #ALTCOINS cratered 50%+ after that. OUCH.
Since then, we have turned somewhat bullish, few weeks ago.
RSI looks okay & $ Flow bettering.
IMO look into #crypto #AI & #Gaming

Very bullish fractal pattern for TOTAL3Hi all,
I've observed a fractal pattern which fits pretty well for TOTAL3. As seen in the graph, we might be in a similar period as it's 2020 October in the previous cycle.
If this is the case, we may see a huge BTC rally first and then Alt rally may start which would make TOTAL3 to rise up to 2.5-4 trillion dollars.
Let's see!
This is not a financial advise.
Please do your own research.
Cheers!

TOTAL3Am I seeing things?
Looks to be a repeat of the prior vertical accumulation pattern prior to a push up. Let's see. Expecting higher.

Crypto Market Cap - Looking good now but lot of resistance aboveCrypto Market Cap is printing higher lows and higher highs, but there's still a long way up for the market to keep growing, some possible bear patterns may be printed in the next days/weeks.
If the current trendline is broken, this might potentially confirm a bearish rising wedge.
I currently hold several long positions in alts. Depending of the scenario played in the next days, I would consider closing all my positions if the picture doesn't looks good.

Altcoin Market Cup 🚀 up to $3T 🔥Hello, dear friends! 👋🏻 Take a look at what I've prepared for you today!
💥 Coin Market Cup (Total3 - excluding Bitcoin and Ethereum) 💥
The chart displays the total market capitalization of altcoins.
What can we see here? At first glance, the cyclic nature of price behavior is striking! 🧐By overlaying several Fibonacci tools, we clearly see the potential!🚀
It can confidently be assumed: the altcoin market is ready to surpass the $3 trillion limit by the end of 2024. Sustainable cycles, demonstrating repetitive circular motion, confirm this confident forecast.
What we've seen confirms not only the technical component of the market but also its fundamental aspects. Repetitive cyclical movements serve as an indicator of structural changes in investment behavior, reflecting a wave of interest in alternative assets. This signifies growing confidence in the altcoin market and its important role in the global economy.
What can You say? If you found it interesting, stay tuned for more updates and subscribe to stay with me!🫶
Thanks for Your attention
Always sincerely
Yours Kateryna💋

Alt Season Is Quickly ApproachingLet’s wrap up by taking a look at our Total3 chart which includes all alts except ETH. This shows a strong bullish bias. We’ve broken to the upside of our triangle, retested the top of our triangle as support, and are now using that strong PoC from our VRVP as support along with our 50 & 100 day SMA. I love to see all of this as it signals good things to come from our alt space ahead.
Total3
I continue to remain long in alts with almost 100% of my total public portfolio. My followers and I are at 11 wins with over 35% profit per trade. Our average trade is 11 days. Though these wins are great, I expect them to be blown out of the waters soon. Don’t miss out. The best is yet to come.

#TOTAL3 Pushing Above #TOTAL 3 flirted with invalidation and is showing signs of strength after what appears to be a finished ABC correction with the C wave subdividing into a WXY.
Should #TOTAL3 close above my slow (red EMA) on the 8hr TF, then its go time. I'm projecting >$1Tn market cap for #TOTAL 3 quite soon.

Total 3 without BTC and ETHAnother leg in the horison for alts. this could be a massive transfer of goods into alts.
Seems like 4 in creating. Demand zone is tested once already. Perhaps more time required for this to develop. Current price action of the supposed (A) looks corrective.

Possible scenario ?Un scenario che penso che succedera, senza analisi, senza 100k indicatori,pero, cosi va come pochi si aspettano!

#TOTAL3 Hanging On By a Thread #TOTAL3 has flirted heavily with invalidation levels of this count. So long as we stay above current level's, TOTAL3 is poised to make a strong move to the upside after months of consolidation.

2024 MidCap Mania Theory: Rise of Ecosystem StacksPosting this idea up to see where it is in the future
Ecosystem Stacks being created similar to how Linux, Windows, and OS in the 90's
The image of crypto is shaping up. The layer 1 narrative seems dead but I think the game is just repositioning itself.
what is happening now is that our favorite blockchains are focusing on creating blockchain infrastructure ecosystem stacks that roll up from L1's and go all the way to the application layers.
Companies, Apps, developers will be able to chose their ecosystem stack and leverage a developer group that can help them create the blockchain they need for their application.
Similar to to chosing (internet providers, cable tv providers, cell phone providers) .. this means we are seeing the birth of block chain operating system stacks and teams that can deliver everything a blockchain needs. End users pick "a la carte" .
example stack = Eth->Polygon->IMX->WarnerBros. studios
example stack = Sol->Render->Disney
example stack = Dot> Cardano > Circle
example stack = Bitcoin -> ICP -> appSpecificChain
Chart is Total3 (minus USDC and Tether) versus (BTC+Eth)
a good way to see if Eth and BTC lose market share
My theory is that the midcaps are the place to be this cycle. but 2024 is likely an ugly ride after that initial pump.
just a theory..


Altcoin Market on the Brink of SurgeAnticipation Builds:
Traders eagerly await capital inflow into altcoins, known for substantial gains during bullish runs.
TOTAL3 Catch-Up:
The TOTAL3 index lags behind the market, currently finding support between $670B and $705B.
Breakthrough Attempts:
Recent days witnessed multiple efforts to breach the upper limit at $705B, signaling a potential market shift.
Surge Forecast:
Upon breaking $705B, a surge in altcoin activity is expected, with resistance zones at $754B-$780B and $840B-$875B.
Stay tuned for updates as the altcoin market gears up for potential gains! 🚀📈
#Crypto #Altcoins #TOTAL3 #MarketAnalysis #Cryptocurrency #Blockchain #Trading


5 Waves Up On Total Crypto Market Cap.Hey everyone! It's Dalin here.
I am very excited to post this chart today as I expect a pullback in the markets.
Things looked bullish, but then everyone started buying the "news" associated with the ETF.
(The saying goes, "Buy the rumor, sell the news," not "buy the news.")
Patterns are bearish, with bearish divergence everywhere. There are five waves up in many cases. I expect a pullback here.
This means Bitcoin could fall by 30%, and many altcoins will get wrecked.
I am 50% in cash, ready to buy the dip. If you sell and buy the dip later, you can grow your portfolio significantly when it rises again.
That's all for now, folks.
Stay profitable,
Dalin Anderson

Altcoin Season Incoming? Big Pump Potential!Similar to TOTAL, there is still a big chance for a pump higher to the green zone area of 858.309 - 876.481B. If this happens, it could signal the beginning of an altcoin season bull run. However, it might not be that easy to pump to that level; I believe there will be one more dip to shake out retail investors and crypto enthusiasts, making them scream "crypto scam" again before the real bull run occurs when people are skeptical about the market.
