The next 3 month will be the biggest alt coins bull run(NFA) - CRYPTOCAP:BTC halving is approaching. Every dip is a one-in-a-lifetime opportunity.
TOTAL3 trade ideas

THE ROAD FOR 2,5 TRILLION ALTCOINs MARKET CAPHello traders, i would like to share with you this idea about where we are in the altcoins bull market right now.
In the past cycle, after we broke up from 90 BI key resistance we rallied to about 900 BI. That was about 10X.
In this cycle, being conservative, I expect a 5x from the key resistance and a 3,5x from the point we are right now (blue box). That would give us a total market cap for the allcoins of 2,5 Trillion USD.
I will be selling all my coins when we get to this level. I expect to be the end of this bull market.
What do you guys think?
Cheers

ALT coin market cap analysisInstead of trying to find the bottom of the market, here is easy way to identify what is expected bounce range in ALTS.

Shitcoin season ETA is near.Weekly Chart:
Fusiongap (50/15) indicator histogram is in positive again, with the red oscillator about to cross the green oscillator.
Ichimoku cloud flipping green again.

Could Crypto Market Cap Reach $10 Trillion? Examining the ElliotThe cryptocurrency total market cap appears to be following a pattern consistent with wave five of the Elliott Wave Principle. This could lead to a significant price increase exceeding $10,000,000,000,000 as some analysts predict including myself? We are in der.

We're still earlyWhile the crypto market is choppy, just remember that the crypto market cap excluding Bitcoin and Ethereum is not back to their previous all-time highs yet.

PI cycle predictive power for ALTsThe Pi Cycle Top has been used to accurately predict (usually to within several days) the cycle top for BTC in every major cycle since its inception. Can it be used to predict the top in the ALT market 'Total 3' (crypto market cap minus BTC and ETH)? As can be seen from the chart this would see the ALTs market cap tapping out at circa 2.7 trillion dollars, especially likely if this is a left-translated cycle (my rudimentary chart drawing should be taken as one possible outcome, if thing continue as they are in a left translated cycle). The scale is logarithmic; this means that the linear upper bound may not be accurate as there isn't enough data to draw a curved line of best fit. It also has to be noted that in the last cycle BTC reached its true peak 7 months after the Pi cycle top so technically the indicator doesn't always get it right, however in the grand scheme of things, the price difference was marginal if you got into BTC during the depths of the bear market. It also has to be noted that, so far, with ETH included in the total ALT market cap ('Total 2'), the Pi cycle has been very unreliable, however that is largely skewed by ETH dominance. In the last cycle, for Total 3, the indicator missed the top by around 300 billion dollars. If you got into ALTs during the bear market and then tapped out when the indicator flashed, you would have made great gains but this further pump of 300 billy would have probably left a sour taste in your mouth.
Since BTC has hit an ATH before the halving, its increasingly difficult to make any serious predictions based off past data. If we see a big dip and consolidation in ALTs around or after the halving, then this could return the cycle timeframe to a more 'normal' course. Will BTC ETF inflows and subsequent holding, reduce capital flow into the ALT market and prevent an 'ALT season'? Will a lack of cheap money due to fiscal policy cause a very different cycle to the last one?
Personally, I'm heavily into ALTs but I will start locking in ALT profits when the Pi cycle flashes on BTC and leave the rest to run for potential parabolic movements, whilst monitoring the Pi cycle indicator on the ALTs.

Altcoins Excluding BTC and ETH Surge: Navigating Key Levels Towa🚀🌟 Altcoins Excluding BTC and ETH Surge: Navigating Key Levels Towards $1.2 Trillion 💹🔝
Time to dive into the dynamic world of altcoins, focusing on the "Total 3" market cap which excludes Bitcoin (BTC) and Ethereum (ETH). This segment of the crypto market has shown remarkable performance, especially after breaking free from a significant yellow descending channel. This breakout was a clear signal of a burgeoning bull run. From a market cap of $352 billion, we've witnessed a climb to $254 billion. But the journey doesn't stop here.
Two pivotal levels stand out in this upward trajectory. Firstly, the $697 billion mark serves as our trend line support. Ascending further, the $938 billion level emerges as the next crucial resistance point. The potential to breach the $1 trillion ceiling is within grasp, aiming for a blue-sky target of $1.2 trillion. This ambitious goal underscores the bullish sentiment permeating the altcoin market.
In the midst of these market movements, one sector deserves our special attention - AI utility within the crypto industry. The synergy between crypto and AI promises to ignite an explosive and intensely captivating sector, poised for significant growth in the forthcoming months and years. Our recent exploration into custom AI solutions and their transformative impact on the crypto universe is something you won't want to miss.
As we continue to chart the course of the Total 3 altcoins market, my analysis remains a steadfast guide on TradingView. The accuracy and foresight demonstrated thus far bolster confidence in the continued relevance and success of these insights.
Stay tuned for more updates and analyses that help navigate these exciting times in the crypto market. Remember, the journey towards understanding and capitalizing on these shifts is ongoing, and I'm here to guide you through each step.
One Love,
The FXPROFESSOR 💙
🌟🌟🌟Lastly allow me to say this could be a great time to look some Ethereum AI Alts:
Custom AI Solutions Reshape Crypto Universe - The Future is Now
🌟🌟🌟


Altcoins (Total3) UpdateI think the moment has finally come, we are about to see the formation of the handle, and hopefully alts correct alongside BTC into mid April. A 60% climb to all-time-highs over the coming months. Then we will likely see a few bull market corrections brutal in nature.
-Short-term we tap the golden fib again and possible flush downward 50B or so
-Medium term rocket ship to 1.1 T
-Next Spring/Summer we are baffled by how insane the high momentum alts have gone
Alt Season Reversal soon?Alt Season Reversal soon?
So far bullish season on alts going well. We might see a retrace near 800B. 823B is my point of interest where alt can go for liquidity run.
there is clean bullish divergence on USDT>D with Market Cap indicating a bullish move and a final leg before it retraces

All the crypto space without BTC and ETHIf this happened we can see ALTS are going to the sky like 10x to 15x normally and i smell that this thing is coming soon be read tie-up your bag and fill it with cryptos good projects.

TOTAL3 We got a retest.Be ready guys as i said earlier market goes as it is now we get a retest on it and i am assuming after a little dump or range bound senior we are going to the moon.
Hold your profits enjoy the ride.

clean bullish fractal total 3clean bullish fractal total 3 as u can see full sectionmagnified with very intersting fractal detals shows that we are heading to 780B area by end of march
mini bull run has started
goodluck everybody :D

1T Total3 by June? We havent been bullish enough!!!Turns out my previous Total3 projection was nowhere near bullish enough!!
This is going to be fun
I hope you are ready anon!!!

total 3 projection till mid of may 24total 3 projection till mid of may 24 as a continue of previous fractal projected on nov 23
we target approx. 1T before 3rd week of may this will result a nice alt season continuation till ETH. ETF approval before the long bull run starts on July 24 we will update later

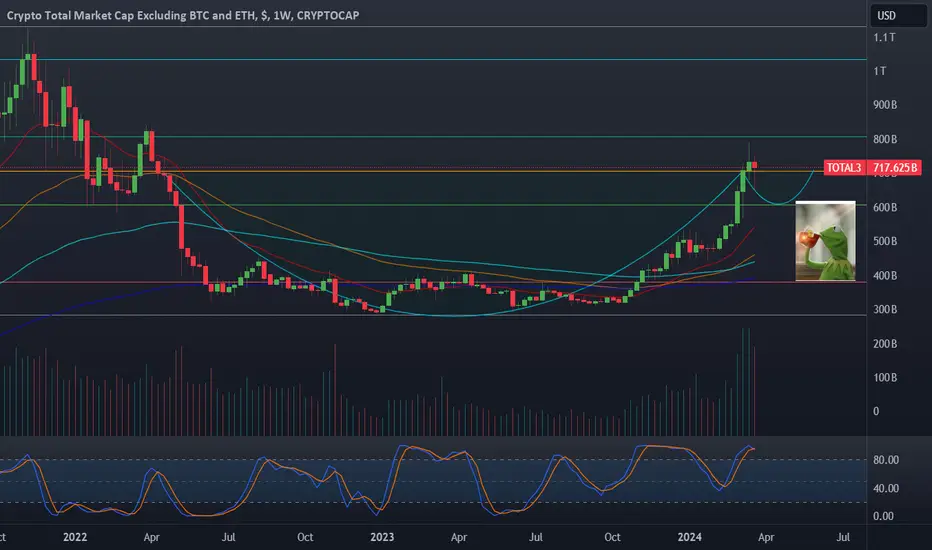
ALTCOINS Update ! Resistance hitHere this chart total altcoins with no btc and no eth...clearly show us some resistance
1. Scenario number one - most of the altcoins will break this resistance and PUMP
2. Scenario number two - bitcoin will pullback and altcoins won't pump
Note: this is a short -term scenario -> it happens every cycle.
Take Care ✌️


Total 3 ALTS at the end of BTC countdownI think at the end of the Bitcoin halving time countdown we are near about 650B

Altcoin Dominance excluding stables at the critical pointHey all,
Altcoin Dominance excluding the stable coins is about to break the descending channel as same as 2020. However, 4 years ago in a very similar point the channel could not be broken and the all crypto market went down like 20-50% from their tops and then Bitcoin has started real bull run. During this real BTC bull run, many altcoins lost their values against BTC around 50-75%. After the BTC bull run, altcoins made 5-10x as average.
So, I'm holding 50% BTC and 50% alts. If a similar thing happen like in 2020, I will be happy to hold enough BTC and then convert them into altcoins at some point. So, I'll leverage BTC gains with altcoin gains as well. If not it means that descending channel to be broken and altcoins will do a really crazy rally and I'll be happy to hold 50% altcoins.
These are all my opinions and not financial advise.
Please do your own analysis.
Cheers!

THIS ALTCOIN CYCLE IS GONNA BE CRAZY!!!!!!This are all altcoins market cap. Excluding btc and eth. We see that each cicle, the percentage we do is slightly higher. We are starting to see a very crazy altcoins gain!!!!

WER we AR now, Toto? "Bark bark" - Toto answered and Elly pulled on the leash - "Look for blood, look for it!"
And Toto starts sniffin'
gutten Tag mein kline Freunde!
its time to look at the big picture and here iz my opinion:
we are the witnesses of the final (and most strong) wave before regulation and stuff. it shoud end BEFORE 2025, I mean that after 2025 correction of all previous growth will start.
think, analyze and buy the dip. when it comes ofcourse, not now:) THEN.
ps: the structure - I dunno, it seems like a ZigZag, will see - I will update this chart. Maybe ;)

ALT Season on Verge of Breakout? This is the way...Are your bags packed? Are you ready to go?
It appears we are on the verge of Alt Season as Total Market Cap excluding BTC & ETH is ready to break to the upside. Now that people are sitting on BTC gains at All-Time Highs, I would start looking for rotations into hyped up Alt projects - NFTS, Stable Coins, and Pepe's and just classic Shit Coins. As long as the Government is mathematically obligated to print, all that shall trade shall pump. This is the way.
If this breakout fails (and BTC sells off hard), I would look for the market cap to test the 70 RSI level for support before reloading for another leg higher. The RSI is pretty over-bought on higher timeframes (3-Day, Weekly) at the moment.
Trade Advice: Take Profits. Shit will pump & dump. You don't need to sell entire positions all at once. Scale out on a schedule when you're sitting on Fat $tacks and Gains. Be OK with not realizing all the paper gains. Be stoked to have a balanced portfolio and in positioins to strike on the next opportunity.
