ALT SEASON IS STARTING Alt coin season is starting. Trend has completed accumulation phase. What's next? 🚀
TOTAL3 trade ideas

alts targets for this run of 2024for total 3 . first thing that i am looking for . is to enter the range indicated in chart , find acceptance , after that we will target 750-850B give or take 10% . then possible 0.9-1T give or take .
i see it possible to achieve the second target , but reversing from the first one for me have the greater possibility as far as i am concerned .
thank you

Crypto Total3 Marketcap Expanding to Upside! Q1 2024 ThoughtsThis is an active Total3 MCap chart, showing marketcap of everything besides BTC & ETH.
We have been trending higher for weeks breaking a massive range and quickly moving. We are seeing the first steps of the next Crypto Bull Run & likely the most lucrative of them all. It is prior to the global enabling of these protocols into our daily lives.
This is the bull run which front runs the actual implementation of these assets. The one where you see Blackrock file and approve their ETF with billions of inflow (now happening). The one where you see payment providers like SWIFT, BIS, IMF start to actually go live from their pilot testing that's been going on for years and slowly integrating working product from this sector. Merging private entities with public, and introducing groundbreaking changes, such as CBDCs and Tokenized Securities.
This chart is displaying all those private sector coins as one. We have recently just broken 50% of a massive weekly retrace and fair value gap for about 160 billion USD in value. There is room here for the market to trade, and if we close this Feb 25th weekly green above that 50% mark of the gap, the odds of market rallying and filling that FVG completely are far greater than not.
If we fail to close the 50% of this FVG id expect a market wide pullback coming soon. A great opportunity to buy more.
I believe that after this lower FVG we will start to trade up into our first level of major market resistance. This will be a chance for a massive market structure shift, as this will be the first level we really truly battled and lost for the longest bear market crypto has faced. A brutal one at that. This is a major level at that upper box ($663 billion mcap mark)
I stand to see us reaching this point into the April 2024 halving. About 2 months from now. Before seeing a wide pullback and re-entry. My plan is to sell some coins into this area and then buy any large pullbacks on alts. I will consider a large pull back either a nuclear day of 20-30% which we typically see in the bull market, or a larger bleed of consecutive -5% days until we reach a 20-30% pull back total if the market looks to catch a bit or hit a level where bids will be placed. This is when you strike, and ride the rest of that to the next major level, doing the same thing over again. Derisking, and re applying capital.
My goal is to follow this plan at every single major level of resistance on the way to all time highs, then, I will likely just endure the price discovery and take profits at targets I am comfortable with taking home into late 2024 or early 2025. I will not be taking this bull run lightly, I suggest you don't either.
I will be making another post soon, on my sectors that I believe are outperforming and will continue to outperform the entire crypto market.

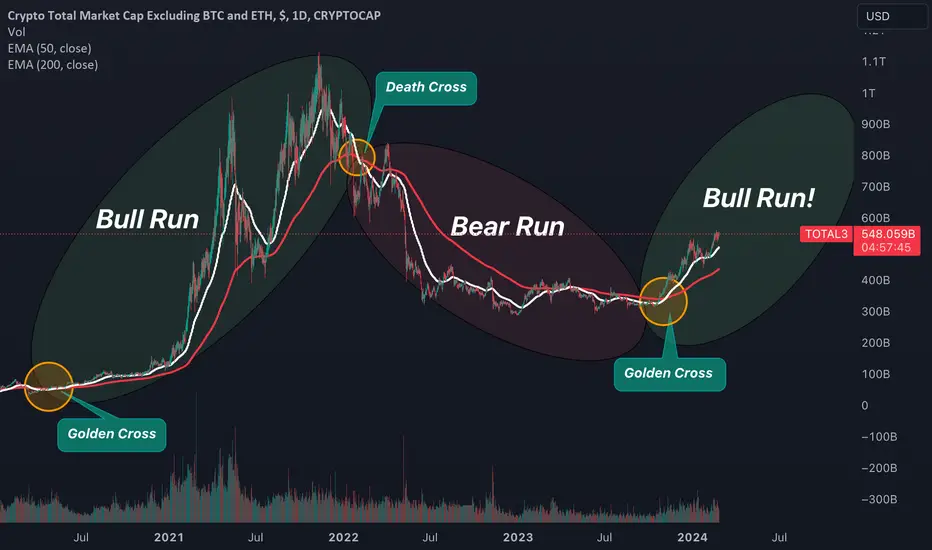
Golden CrossIn 2020 Golden Cross Confirmed A Major Bull Run , Which Is Again Can Be Seen In Crypto Total Market Cap Excluding BTC And ETH....
#AltsSeason (Bull Run) Not Even Started Yet
IDEA MARCERT CAP TOTAL 3 ALT SI.........!!!!!All the evidences and signs indicate the new season. The lack of space compared to Bitcoin and Ethereum is a characteristic of most coins. Do you agree with me?

TOTAL3 free to runI never had the time or I forgot to post something about this over the last month, however TOTAL3 turned pretty bullish after breaking out two different resistances. As you can see the second one was retested and since then we're in up only mode. I expect some reaction once we get to next resistance.
I personally don't see any real resistance until that daily one I indicated on the chart. This bull season is going to be fun unless you messed up every single coin/token in your bag! In that case it will be very sad!

ALTSEASON WILL MELT FACESPerfect weekly closure and retest after an accumulation of roughly 2 years.
Altseason is only a matter of time now.
As long as BTC holds its price or goes up, we get altseason in the next few weeks. So we have 75% chance to get altseason. High probability now but low reward compared to before.
Look into microcaps tho. You'll see they are lagging more than usual. Buy and resist the temptation to take profits for a few months.
GL.

Total altsThe total market capitalization of cryptocurrency appears as follows. Analyzing the past is the essence of all technical analysis.

ALTcoins May Face Further RallyALTcoins are still dominating in the Crypto market. Looking at TOTAL3 crypto market cap chart, which excludes Bitcoin and Ethereum, we can clearly see a bullish pattern. After a complete complex W-X-Y correction in wave (4), we can now see an impulsive minor five-wave recovery, which can be first wave 1 of a higher degree wave (5), so after a pullback in wave 2, watch out on further rally into wave 3 of a five-wave bullish cycle, especially if breaks channel resistance line near 500B level.

Altcoin Marketcap - Total 3 - Reject or Blast through?
As you can see in the chart I've plotted a potential movement of Total Market Cap 3
This movement would be possible only if from the demand area that we plotted is that we're going to see a strong price rejection, and break above higher
The break back in May 2022
Many might be trapped in those positions that's why approaching the nearby price we can see strong selling pressure
Initially there might be a squeeze that will make us blast through 583B
If not, then I'm expecting a double top or a strong rejection bearish candle and make us go lower again
What are your thoughts?
Let me know in the comment below!

Crypto Market Cap vs BTC ETH USDTThis chart shows the market capitalization of all altcoins vs Ethereum, Bitcoin, and USDT. This will help you figure out where the money in crypto is going at any given time, so that you will have an informed decision on where to put your crypto in too.

Alcoins remain in channelAltcoins remain in the broader rising channel. I did expect more of a washout but it looks like the BTC ETF kept this market afloat. We will get a massive correction before the halving in my opinion, but maybe this is delayed until BTC is closer to 58k, this would lead to a correction down to 40k. For alts the red lines are still possible but this rising channel makes it hard to believe at this point. I added a more realistic flush out line but we might just stay in this channel for a while.

Crypto market primedWide lens view of TOTAL3 crypto market cap. Looks to me as though we've flipped a key HTF level into support. If it holds I believe this will be the platform for a push up to $635b, provided the BTC narrative around ETF approval doesn't falter.

TOTAL3 ABCD points at 2T and fibo to 3.3T caphey hey
To the point, how to trade Total3, well no-one is offering that option, the best would be to buy all the tokens equally (depending on the market cap) but even that is hard.
I am trying to do just that on 5x and 8X effective cross leverage (to all alts,not by market cap, but more or less by non-objective), so far still in accumulation period. Slowly adding, but on the way up or down you can always deleverage, borrow BTC and buy alts (or vice versa), or to sell some alts that have done 30%+ and switch to others.
Now we are in the turning point with BTC, which can dip below 50K or continue to 56.3-57.6K before a correction.
TOTAL3 shows realist TP with ABCD at 2Trilion cap.
lets see how far alt season can bring us.
de

$TOTAL - Excluding BTC & ETH (update)Looks like we have completed the Sign of strength phase, and the back up.
This is where the real expansion starts after leaving the accumulation range. Looking left we can see we are above critical resistance, and historically, its straight up and down from here to target 3 with likely consolidation under the 2.618
Looking at the entire structure here as a broadening accumulation, the major move comes after the recovery the lower inflection level or range low, and would typically be pretty aggressive from here to the top of the broadening formation.
If we see a partial decline there / high and tight consolidation, it could give some validity to targets beyond my extension levels here, which would be a measured move of the bull top, to bear low.

TOTAL 3 ~ Potential Breakout in April 2024TOTAL 3
Altcoins minus BTC & ETH
✅Price has broken above the 200 DSMA
✅Price has broken out of the pennant
⏳126th week is 1st April 2024
Earlier today I shared TOTAL 2 which includes CRYPTOCAP:ETH and suggested that including ETH altseason could initiate from Feb/Mar 2024.
TOTAL 2 breaking out ahead of TOTAL 3 makes a lot of sense as this is what has happened in prior cycles
FIRSTLY, bitcoin leads the whole market like it has been.
Secondly, liquidity moves into Layer 1 altcoins like CRYPTOCAP:ETH , CRYPTOCAP:ADA & EURONEXT:ALGO = TOTAL 2 in Feb/Mar
Thirdly, liquidity moves into Layer 2 altcoins like CRYPTOCAP:IMX , CRYPTOCAP:MATIC & NASDAQ:OP (TOTAL 3 in Mar/Apr)
After that the Memecoins and shxtcoins have their wild runs, which usually coincides with peak euphoria and the end of the bull market or a sizable correction. This is why you leave the gambling with small small positions until later in the cycle for those memecoin plays.
I hope this helps you frame the timeline of the market in you mind. It may not happen exactly as outlined with the dates but the sequence will likely be the same so we can watch out for Layer 1's and Layer 2's moment next.
PUKA

total 3 viewwe re close to supply area.this is a weekly chart. Even we ll see wick to down keep hodl spots. When we ll reach supply zone have to check btc dom, usdt dom and bitcoin.

#Btc #Eth #Bnb #Sol #Altcoins #Altseason #Altcoinseason #TotalTotal MC
Altcoin Altcoins
Altseason soon ....
Green= Target
Orange= Resistant
Red= St
Disclaimer
This text is just a personal opinion and should not be used as a basis for decision.

Will total 3 retest the breakout?As bitcoin rallies into the 50k range, Total 3 finds a moment of pause and reflection—looking to the recent highs or retesting the breakout? Time will tell.

TOTAL3we entered in floor place and move to up but this place you can saty with your currency and take stop loss for positions

Short EverythingI'm short on equity, crypto also looks short. We'll see what happens. I have a short on niike, S&P, and nasdaq (tighter risk,)
Crypto also looks short to me.

Altcoins- New strong leg up?Since mid-October, Alts have shown significant upward momentum, experiencing an impressive average gain of approximately 70%.
However, as their combined market cap soared above 500 billion dollars, a predictable correction ensued, with alts retracing around 20% of their gains.
This correction stabilized around the 440 billion mark before initiating a bullish reversal.
As of now, the current price hovers precisely at a short-term resistance level.
A breakthrough above this critical horizontal and psychological threshold at 500 billion could catalyze a fresh upward surge in altcoin prices.
The projected target stands at 620 billion, representing an average increase of 25%.
Notably, certain alts are expected to outperform this average, with some potentially experiencing gains exceeding 100%.

