If you're not buying?? Then WTF r u doing? :flushed:Like he said lmao Counter trendline break after 0.618 bounce? sounds like buzzwords to me. Dont believe it till i see it. Meanwhile i own 15 coins. I will Solde when the time comes.
TOTAL3 trade ideas

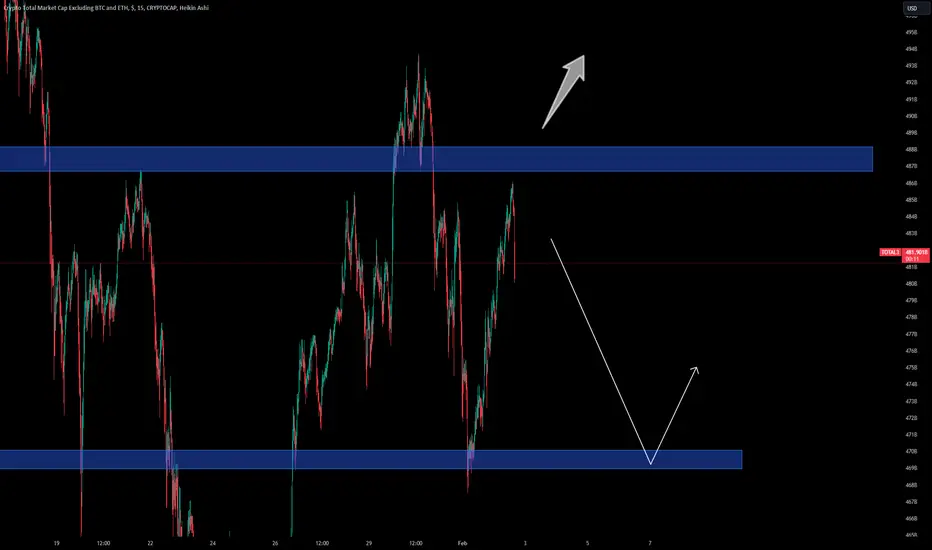
Crypto Total3 BreakoutCrypto total3 has started to move,
the breakout retest has already occurred
alts are primed and ready for a heinous pump!!
strap in

TOTAL3 6H#TOTAL3 is trying to break out. Let see what will happen next. A clear breakout would confirm bullish momentum. Hold your coins!

alt mcap total3after months of chopping in the marked zone alts made a great rally , it might come back to the 450b area if it happens then there's a life time opportunity to accumulate the alt coins ,

Long Term Guess :)Just putting this out there to look back in a few years and see how things transpired, no major substance here just a few things i listen to but definitely not financial advice just a musing :)
Have fun and be safe out there.

TOTAL 3 Cycles SynchronizationHere is the Cycles Synchronization of Crypto Total Market Cap Excluding BTC and ETH (TOTAL 3). At some point, between mid november and mid december 2025, I do expect around 2T Market Cap to be the top for the cycle. 1 year later, the Market Cap could be at around 1T or a bit less, I think.
Will follow with interes...

Not a good day for Bulls today.. Feds got a Dual 'delay signal!🚨 Attention Traders: Important Market Update 🚨
Today's job report has delivered a curveball for bulls in the market. The U.S. economy added a staggering 353,000 jobs, far surpassing the expected 187,000. While this is fantastic news for the dollar and reflects a strong economy, the implications for traders are mixed.
🔍 Why the Caution?
The unemployment rate dropped, indicating fewer people without jobs, which ordinarily would be purely good news. However, the average hourly earnings have also risen – signaling potential inflationary pressures ahead. This could mean that the Federal Reserve's next big challenge will be price stability, not employment.
💡 Fed's Dual Mandate:
Remember, the Fed has a dual mandate: maximum employment and price stability. Today's data ticks the box for employment but raises the red flag for inflation, hinting that the Fed might not be as quick to cut rates as we hoped.
📉 Impact on the Markets:
This is a pivotal moment, especially for risky assets. We might need to brace for a stronger dollar, which traditionally doesn't bode well for assets like gold and cryptocurrencies.
📊 What's Next?
Shorting Opportunities: With a bullish dollar, look into shorting opportunities on assets like Bitcoin and other altcoins such as AVAX.
Gold Watch: Keep a close eye on gold. With these figures, gold prices could dip below $2,000, presenting potential entry points for shorts.
🔄 Portfolio Adjustments:
It's time to reassess and readjust portfolios in light of this new data. Today's results are a stark reminder of the importance of staying vigilant and adaptable.
Stay tuned for more updates and strategies as we navigate these market developments together. Trade smart, and let's tackle these challenges head-on.
One Love,
The FXPROFESSOR 💙
Altcoin h & S ?Looking at my previous chart I believe there is a hidden head and shoulders to play out before this bull flag everyone is calling for.

Altcoins updateTotal 3 (alts minus eth and stablecoins) is following the path I drew for the most part, at least overall. I expect a brutal and lengthy washout. This is just the start. I am not in any levered positions. Most of my positions I have locked them in a long time ago except or a few select choices. When and if BTC dead cat bounces we could go much lower than this. Stochastic is reversing and downside is looking real here.
Target 1 :440 Billion mcap
Target 2: 420 Billion mcap
I expect LINK and INJ to continue to perform. And I also expect a gaming run when BTC re-enters the 30,000s.

🔥 Altcoin's In A Huge Bull-Flag: Break Or NotEver since the ETF I've been dominantly bearish on the market. My expectation was that the ETF would be a longer-term top.
However, the short-term looks quite bullish. If TOTAL3 (total altcoin marketcap) can break out of this bull-flag pattern, this could signal a continuation of the bullish trend.
I'm still wary. However, if the market can prove that a reversal is playing out and that the trend will continue, I will naturally switch my bias.
In case of a break out, my target is placed at 585B, which is the first big resistance from back in 2022.

total3 All you need is this two Ema and you will be amazedHi everyone posting after a while as i am watching this chart closely and thought its a good idea to post
Observations revolves around 20 and 200 ema on 3d Timeframe
As you can see two failed attempts on 20 and 200 ema crossovers happened in last cycle and then a successful crossover leads us to 700 days of bullish price action before these emas crosses bearish.
This time we have a successful crossover on the first attempt which is good for markets
Markets are above the 0.618 level support which is positive as well .Notice this .618 level is acting as major support
Key thing to note is that in previous cycle when this 20/200 crossover happened markets never
touched the 200 ema till around 700 days. the support revolves around 20 ema.
More leverage involved in this cycle so prices might come down from 20 ema to 30 or so but it should not come close to 200 ema if we are looking to sync with previous cycle as touching 200 ema was a bad sign in the Total 3 markets.
Also we have 560 days of bearish action after 20/200 crossed bearish on 3d chart.
Going forward we donot want to see this crossover to cross bearish that would not be good for markets
Best of luck Guys
LIke and subscribe for more content

TOTAL3 - Altcoin Market Cap Holds SupportTotal3 is the market cap of crypto, excluding Bitcoin and Ethereum. Looking at this can give us an idea of how much interest there is in the rest of the market, outside of the two titans.
While charting assets like this can be a bit nonsensical because they are not traded, charts still tend to give us clues as to what is going on.
In this case, Total3 has clearly retested a key support multiple times with success - 453B. As long as that area holds, altcoins look generally healthy and risk on. You can see the potential if they head up to resistance levels.

ALTCAP - ETH (TOTAL3) [2W]ALTCAP - ETH (TOTAL3) is following a clean Head and Shoulders Bottom on the weekly timeframe.
Compare the purple horizontals to see how price now is testing the A-top and what will likely happen next.

Total3Hi, I announced cancellation in the previous positions, but we got a stop in one position. According to this chart, it seems that we have the old season on the way. I am waiting for the bit to fall and a new rally.In this rally, I think investing in good ALTs can be exciting

TOTO, pull ouva (total3 update 20jan24)Hi all, big and small
folks, hear my talks
'bout Toto thy Dog
and mistriz in fog
are u afraid? I am. BUT ure nothin', if u fearless. And the bigone, if u command ur fear and make unFOMOed disigionz (Im no, just learnin'.)
SOO
az u can see my beautiful chart, a painted all there already: equal Waves 1 and 3, ugly WXY Wave 2 and the stuff.
in MY ALT count we will moved via ZigZags, I will update it later when an enlightenment will be obtained
see ya!

TOTAL3 - Crypto Altcoin Market Cap BULLISH - Signs of StrengthTOTAL3 is consolidating its breakout from the long wyckoff accumulation we have seen the past many months.
This is known as the Signs of Strength phase and immediately precedes the mark up phase
While everyone is bearish selling the news alts are preparing for a massive rally.
Could see 800b within a relatively short time frame!
Keep stacking your favorite high performing alts

Total3 loses supportAltcoins are looking to continue to bleed here as Total3 loses support. Total3 excludes Eth and stablecoins. I think we see my medium term target of the red dashed finally, possibly a dead cat here as well. The only hope of altcoins staying strong would be if ETH pumps which is unlikely in the market. The weekly chart on ETH is losing steam as well.

📈 TOTAL3 -19% Drop, To Start (Market Correction Explained)Recently the Total3 index tested EMA50 as support and after a lower high is now set to close below EMA21 and EMA10 as bearish confirmation. This kind of setup will lead to a strong drop.
Bear volume is the highest since October and the RSI is jumping off a cliff.
These bearish signals can be found all-throughout the financial markets, not only Cryptocurrency.
It is a standard correction what is showing the chart now will happen but it can speed up and change once it starts.
👉 I will continue to share additional information through more charts.
You can visit my profile and find Solana, Ethereum, Chainlink, PolkaDot, Dogecoin, Binance Coin, Polygon and all other major Altcoins looking really weak... The smaller ones are looking better but they will also suffer when the crash takes place.
The initial strong negative reaction can take between 3-6 days and up to 9 to find some stability and then the smaller or the ALTSBTC pairs can recover and grow while the standard market correction develops in a time-window of 1-3 months.
Namaste.

This Simple Chart Tells Us All We Need to Know About Altcoins RNTraders,
Don't really have to say much more here. This is the altcoin total market cap excluding BTC and ETH. Alts continue to face trouble and it looks like more selling will ensue. Stay out of leverage and trade carefully. Ensure those stops!

TOTAL3/TOTALIn the ratio of Total3 to Total chart, we are in a long-term range. We will have an upward movement of altcoins from the specified range (more likely) or the bottom of the channel (less likely).
It should be noted that here is the PRZ range of a butterfly pattern

Altcoins: Sentiment barometerWe are in full 'wall of worry' season based on the data I collect regarding sentiment...
Constant notice from people wanting to sell before the ETF causes a sell the news situation, people hesitant to pay up to buy after missing the start of the rally, and generally reluctant to withdraw funds to non-custodial wallets and engage with DeFi and whatnot.
I experienced the emotions in this chart, but mostly sticked to my technical guns and harnessed the edge offered by Time@Mode to ride trends...although I did get scammed myself during 2018 once, so I can personally attest to the effect of powerful emotions causing a state of vulnerability after large and quick monetary gains for long enough.
We are nowhere near close to that phase of the crypto cycle here, so most traders are not likely to fall victim to greed yet, but it is always wise to stay true to crypto OG principles, and rely on decentralization and trustless-ness to keep us safe.
Best of luck!
Cheers,
Ivan Labrie.

Altcoin Marketcap Finding Resisitance at 500 Billion?Looking at the total 3 it has risen above the 500 billion marketcap briefly and looks like it could be finding resistance at this level. In my opinion this is a great place to take profits and a possible short opportunity. As i write this BTC has just hit a High 0f 47,000 and is showing signs of losing strength. Similarly ETH has risen to a new high above 2300 and may fail to hold this level. Lastly the hype around the BTC ETF has driven prices and volatility to these levels and I want to be cautious in case this is a Buy the rumor Sell the news type of event.

How To Make Money With Crypto Trading BotsWe are at the beginning of a huge crypto bull run when it is possible to make millions of dollars with strong altcoins. So how is it possible to know if an altcoin strong or it is weak?
Look at the community around the altcoin you want to profit with. I prefer to count the traffic which comes to its official website first. Is the traffic rising or it is falling?
Also look at the altcoin's twitter and discord. How people react to the news. Do they write many comments or not?
But the most important thing is which funds have invested into the altcoin.
Lets look at the biggest gainers from the previous bull run. I remember Solana, THETA, Polkadot, Cosmos etc.
I prefer altcoins which were funded by Tier 1 funds. At least one or two (there are only 22 Tier 1 funds in the market now).
After that I look at the chart. I don't want to buy altcoins that are already overpriced.
One of the best examples of altcoins I have found for accumulation for the future bull run is APTos. It is not very expensive, have the great community, valuable traffic to its official website and so on.
We will need to find 10 - 15 altcoins like APTos to make our millions of dollars. And I will help you to find the most profitable ones.
The best way to accumulate an altcoin I have found is starting a position with a grid trading bot. It is the most simple yet very powerful tool you can use to get as much altcoins as possible before it is not too late.
Why I prefer to use grid trading bots? Because these bots can accumulate literally "free" altcoins for me. Here is how I use grid trading bots.
First I need to define the range for trading and second - how many orders will trading bot have.
And with APTos the low price for the trading is $ 3 and the high one is $ 25.
The number of open orders are 100. And the profit is 0.72% ~ 7.16% per grid.
So what is the goal? The trading bot should return to me all the money I invested and also it should give me a certain number of APT coins before I close it.
After that I can start a new trading bot position with the USD the bot have made for me and keep APT coins for the bull market to sell at the best price.
Do you like the strategy I use to accumulate strong alcoins for the crypto bull run?
