TOTAL3 - H1 - Top of the range#TOTAL3 Eyes on this zone. Could visit the top of the range again if reintegration of the previous support #altcoins
Party is maybe not over ;)
Like If you share
NFA
TOTAL3 trade ideas

TOTLA 3 is Bearish For NowA correction to the support range is seen for TOTAL 3.
After its rise, it has reached the monthly SWAP resistance range. This level is strong and can cause TOTAL 3 modification.
I have also identified the support range from which we expect a jump upwards.
Indeed, according to the TOTAL 3 chart, altcoins are not bullish at the moment and will undergo a 15-25% correction.

All crypto will drop in 2024 70 - 80 %The entire marketcap of crypto will drop, we still have not had a bear market yet. We will get a drop of anther 70 - 80 % until the bear market is over.

TOTAL3Crazy to think about but something like this is on the way...
The decentralised financial system is set to consume a massive chunk of traditional finance here as we can see..
The infrastructure built (l1s) is finally reliable enough to move synthetic assets en masse imo.
this along with many other ecosystem components (defitools/ai/gamefi/privacy) will comprise a large portion of the total3 markup.

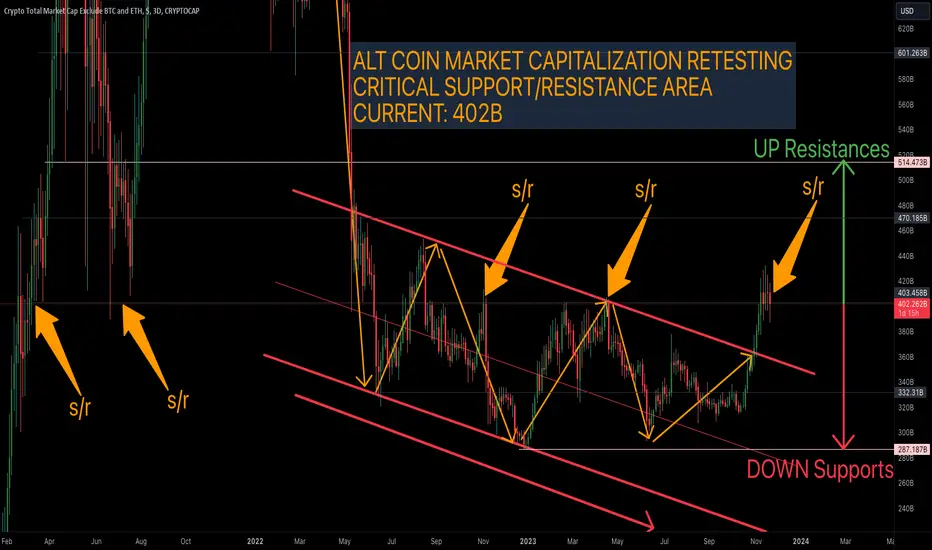
Altcoin Market Capitalization Retesting Critical S/RAltcoin Market Capitalization currently retesting critical support/resistance around 402B.
If current area remains supported then altcoin Market Cap can look to higher resistances around 470.1B and 514.4B. Bitcoin dominance will fall...This will enable altcoins to rally. #altseason 🚀
If this critical support cannot be maintained then look for supports 332B, 287B. Altcoins will perish and Bitcoin dominance will rise higher!
Total 3 next station570B give or take 3-5% is the next station . After that we reassess .
This is not a financial advice.
Thank you

ALTS full analysis short term this is an update and full analysis for alts .
firstly this is a hand made chart , total 2 except eth , and stables .you can make same on using tradingview .
you find eth analysis separated .
-------------------------------------------------------------------------------------------------------------
as you can see in the picture we kissed the top of the accumulation range (line in green)
the 3 arrows represents all the possibilities . in the end of this analysis i will post my opinion .
green arrow represents a small correction of this big move since October , and then continue higher . orange one , represent a deviation above the accumulation range and get back inside , the black arrow represent a breakout of the range . remember , these movements are short term , once , one of them take place , we will update based on the move itself . and we give the possibilities of that particular move .
-------------------------------------------------------------------------------------------------------------
1- green arrow : its a simple correction to continue higher , well known wycoff accumulation range . the correction coincides with 0.25 fib level .10% drop from here .a reversal is probable after the correction , to continue higher , until we break the accumulation range that we are in for 560days now !.
2-orange arrow ,represents a deviation above the range and then come back inside , its very common move to trick buyers and liquidate them , finally get back into the range to stay in for longer .this probable deviation gives 22% up from here .
3-black arrow , is simply a breakout of the range , could give a retest just after the breakout , or could soar and get far away from the upper band of the range to give that retest .
in case of the black arrow , the targets are for short term dec 2023 - feb 2024 :
-------------------------------------------------------------------------------------------------------------
alts depend on various things : bitcoin price, bitcoin dominance ...etc
so its hard to give long term scenario without analyzing the data and make update in weekly/monthly basis .
-------------------------------------------------------------------------------------------------------------
my opinion is :
its optimistic , and coincides with may 2021 alts high . this move could reach only the first or second green box , for me the second is possible , the third possibility is lower, but this is my opinion . as mentioned earlier , it depends on btc dominance and price .even the second or first box are nice targets , they represents : 150% and 300% from bottom .
-------------------------------------------------------------------------------------------------------------
remember , this is not a financial advice
thank you

alts/btc scenarios and levels in the chart you see possible scenarios and most important levels to help you position yourself in alts and what you can expect from them ! as alts/btc is very important metric/index.
thank you

alts/btc alts /btc are making good progress , find acceptance and continue higher will give alts another explosion . refer to the chart . could also fall from here and get back inside the range in green .
this chart is your guide for altcoins agains btc , handmade .
this is not a financial advice
thank you

Alts testing resistance after 9 swing moveFunction: Corrective
Wave Family: Complex Zig Zag
Macro count: Primary B of ABC in Cycle IV
Invalidation points: Above 161.8% of WX
Description: TOTAL3 appears to be completing a 9 swing corrective wave and is in wave Y of WXY. In the WXY pattern W is a simple zig-zag (ABC 5-3-5), X is a triangle and Y is a simple zig-zag. The fib retracement of primary A shows the 38.2% - 50% levels clustered in the same region as the 123.6% - 161.8% trend based fib extension of WX which shows the region for a potential top of TOTAL3. If a top forms, you can expect the market cap to do at least 1:1 of wave A or 100% (measured move) in a C wave.

Alts leg upAlts are warming up for the next leg up imo ,10% up from here are to wait for short term imo . Obv breakout , range breakout . I do think a deviation above the range and come back inside has a low probbaility imo .
This is not a financial advice
Thank you

Alt-coins are hot! What does liquidity tell us?The alt-coin market is hot right now. This could continue alongside anticipation of halving, possibly driven by those feeling priced out of BTC and seeking faster returns. Or we could see alts cool down as speculators rotate back to BTC.
TOTAL3 is the total market cap of alt-coins (cryptocurrency less BTC and ETH), representing the most speculative opportunities in the space. The correlation between alts and central bank liquidity is among the highest that I can find among risk assets.
Liquidity (green) has been increasing since September 2023 and alts (white) have moved steeply since. It’s worth noting when the correlation coefficient deviates from liquidity, which is what we’re seeing now.
Lower correlation when the supply of funds is increasing and alt market cap is flat represents fear in the market (2020 recession)
Low correlation when market cap is increasing faster than liquidity could indicate an unsustainable euphoria (current)
This perspective doesn't tell us when sentiment will correct from being overly greedy or overly fearful, only that we're headed toward an extreme. For the time being I am keeping my alt trades relatively small and taking profits aggressively.

READY TO SELL YOUR ALTCOINS IN A MONTH TOTAL 3 is creating bearish divergence on daily.
May pushup a bit but looks like reaching the Supply Zone
NFA

Total3 grow up to 750B then fallsTotal3 (market cap excluding BTC and ETH) grow up to 750B
and in 2024 will fall to near the previous floor
@JalilRafiefard
December 22, 2023

When ALT SEASON starts in cryptocurrency market?Well, Total3 chart is best indicator for alt season and currently trying to enter bull territory.
Once we enter mega pumps will start one after another.

Break & hold 500B and we fly higherIf total 3 breaks and hold 500B altcoins are going to move higher, fast! Get ready, its coming. There is nothing but air until next resistance

$BTC vs $ETH vs $TOTAL3Let's compare CRYPTOCAP:BTC vs CRYPTOCAP:ETH vs CRYPTOCAP:TOTAL 3 (= NO #BTC or #ETH)
These are all showing negative divergence on RSI & $ flow on daily.
(Showing 2b cautious, this is NOT reason for a TRADE)
#ALTCOINS have done VERY WELL, They are currently OVERSOLD & can remain that way for a very long time, just saying.
They did it from 12/2020 - 5/2021
Then peaked 11/2021 after ATH
Please see profile for more info..
Not all charts here.


ALTSEASON as the final of the technical moveHey All!
I expect TOTAL3 growth in the near future In the range of 450-500 billion
Regards,
Eugene

total3 Daily time frame review and analysisIn examining the TOTAL 3 chart, we notice that, like the TOTAL 2 chart, HC XVTD is contrary to the movement of .ETH. BTC. TOTAL. In addition to the fact that it is not even close to the supply area, it is also failing and stabilizing above a supply level, which is an important indicator that with the recent growth of Bit and the analysis of the upward trend in the TOTAL2 chart, we should be more mindful of the occurrence of alt seasons.

second zone for alts total3As expected alts have corrected heavily and I felt the need to add a second blast zone. This area offers much more support on two prior double tops. Stay safe out there gang.

Total 3 Market Cap 1d is bullish It is showing bullish signals, so I hope to continues its magic specially for the FED announcements tomorrow.
We have a a target at the top and it retested the the falling wedge successfully.
All the best insha Allah!

TOTAL3 Is Bullish.Total3 is Bullish it can go higher.There is a order Block Below and Price has Taken the LTF Liquidity.Also makes SnR Liquidity on the Top.There is also a Weekly FVG on the top of the SnR Liquidity. So my expectation is bullish.
