Alts need a 'Small Push' for a HUGE Pump!Market keeps going sideways after XRP vs SEC news favored the crypto market.
Today i will not talk about Fundamentals though but about Technical (TA).
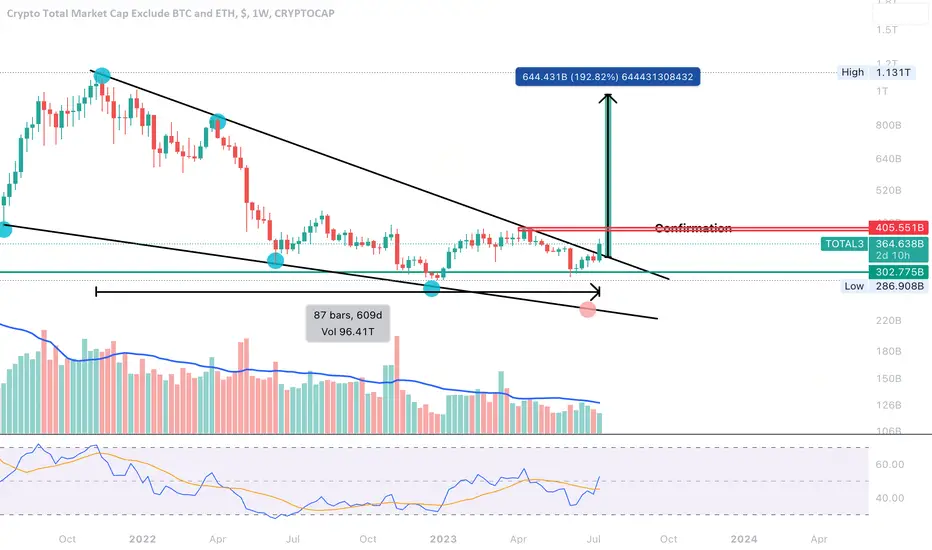
What i like to call the 'All Time Trendline' is the biggest level in my analysis.
In this case this has clearly acted as support in March this year and more recently in June this summer.
At this stage this same level is resistance at 377 Billions.
If and when this level can be breached it can result to a massive Pump (a Rise) in Altcoins as the next level would be much higher at 600 billion dollars.
The price is trapped in a descending channel and those more likely end up offering breakouts.
We are very close to that breakout, we practically need a 'little push' over the 380 billion level.
Nasdaq might give us that little push coming closer to All Time Highs.
Be aware: we are still at resistance (the channel/yellow levels). We still need that little push to break much higher! So we will be on alert!
the Bad scenario is rejection and lower in the channel..still priced at 37-38% likelihood for 296 billion Total 3.
One Love,
The FXPROFESSOR
PS. Time for Alts to rise Bitcoin higher or will a systemic risk do the opposite? We will find out in the next 2-3 months! stay close, stay focused.
TOTAL3 trade ideas

Total3 - Altcoins - Looks poised to PUMPDid post some some semi bullish tweets, (pls see profile for more info) with individual names. But let's touch on #altcoins as they are my fav :)
4Hr chart shows
Did speak on positive divergence few times
RSI over 50 = GOOD
Bullish Moving Avg crossover
HERE IT GETS INTERESTING
Almost forgot that there's TWO inverse head & shoulder patterns for
TOTAL 3 (no CRYPTOCAP:BTC or MIL:ETH )
Smaller has been forming since April and the MUCH LARGER one has been in the making for over year!
If it breaks with volume = #crypto #altcoins🚀🚀🚀

TOTAL2Hello Dears
As the chart shows us that TOTALL 2 and TOTAL3 are on their bearish way .
I think this year MUST focus on short position or trade in Forex.

Will SEC witchunt kill TOTAL3?! What does it need?? SEC wants to crack down on crypto market
This is a means to control the flow of money. Every nation across time does not want to see their money flow out of their 'bloc'. If Binance continues to be a behemoth in the new finance space whilst CZ is in China.. this will continued to be perceived as a threat. I dont have extra information into Binance but regardless the Western bloc doesnt want Binance to be taking retail or corporate USD/EUR/GBP/AUD/CAD/etc en masse. Just as China does not want US tech companies to dominate a space like search for Chinese people.
This will consolidate the market
If SEC is successful (i dont know if they will be) then it will consolidate the market. This consolidation can be great for TOTAL3. Personal views aside if the flow of money is clear for larger actors then floodgates can open. From retirement funds to sovereign wealth funds to even treasuries.
Who would lose ?
Many altcoins could be damaged beyond point of recovery. Recovery I mean getting back to where they were. Many can dwindle into obscurity and became harder and harder to participate in. The real loser out of a consolidation of the crypto market will be retail and class mobility.
What to do about it ?
The upside potential of many smaller altcoins can easily tempt many to dump their bags into those with greatest upside. Regardless of SEC and regulation these smallest ones have the most risk. It is important not to be too lopsided in high risk crypto when crypto itself as an index is down 70%+ ie 3.3x to highs. There is plenty of gains out there within the bigger players who are more likely to rise above regulation and be where money is pushed to.
Who wins ?
As I imagine will be the case for at least another 10+ years.. the winner will be bitcoin. It will be hard to stop. Even anti crypto regulation will help bitcoin. It may be the biggest and seem like the least upside but it is increasingly important to have some exposure to the sun. Sun=BTC.

ALTSeason 2023: TOP 10 Altcoins I'm WatchingHi Traders, Investors and Speculators of Charts📈📉
In my recent DOGEUSDT post, I explained the dynamics of how money constantly rotates in the crypto markets AND how the BTC halving affects this phenomena. If you missed it, check it out here:
In short, after BTC rallies and cools down with a period of sideways trading, you can expect to see rallies across the Altcoin market, usually in order of market cap. Since we've already seen the higher cap alts rally like LTC and SOL; we can now expect to see parabolic rallies on "random" smaller-cap altcoins across the market.
Note that is is not for the immediate term, in other words not TODAY, but alts that can potentially go parabolic between Q3 and Q4 of this year. Here are the top ones that I'm watching:
1) DOGEUSDT (although not a small-cap, I'm super bullish on DOGE)
2) BATUSDT
3) NEOUSDT
4) GLMUSDT
5) HBARUSDT
I will update this chart over the next few days with the next 5, stay tuned
NOTE that the price-range tool is not intended to indicate the date, NOR does it indicate that I expect the price to go up in a straight line. Allthough the price has gone up in a straight line before, the altcoin market is more mature than last time. These are REALISTIC targets as the price has been there before, however you will need PATIENCE to get there. This post is mostly for those who accumulate with their eye on certain targets, in other words the HODLERS.
_______________________
📢Follow us here on TradingView for daily updates and trade ideas on crypto , stocks and commodities 💎Hit like & Follow 👍
We thank you for your support !
CryptoCheck
BINANCE:DOGEUSDT COINBASE:DOGEUSD BITTREX:NEOUSD BINANCE:NEOUSDT BINANCE:BATUSDT BINANCE:GLMRUSDT BYBIT:HBARUSDT.P BYBIT:HBARUSDT

Huge Inverse Head and Shoulders on TOTAL3This is another TA on why it's a good place to be buying altcoins this summer.
Based on the chart, we can observe a huge falling wedge that was broken in July. The price has been above the trendline for several weeks, indicating a clean breakout. Furthermore, there seems to be a formation of an inverse head and shoulders pattern. Currently, we are completing the right shoulder, and if we manage to see the price reaching the base, I anticipate a continuation of the upward movement towards the previous support zone around 470 or 500 billions.
It's worth noting the RSI as well. At the beginning of this year in January, this trendline was breached, transitioning from a downtrend. In June, we retested it from above, and now we witness a bounce, which adds another bullish signal.
So I believe these technical factors point to potential further upside. Pick your favorite altcoins and get ready for the summer rally. Happy trading!

Crypto Market Still Looks Attractive So Far Alts Looking good Market Cap Recently Breaks Falling Wedge In 3 Days tf Retesting In Process Incase Of successful Retest expecting Massive Bullish Rally In Coming Months Incase Of Successful Retest Expecting New Ath In Market cap Of Alts In Midterm

Alts vs Nasdaq, losing channelWe had a nice move back into the channel 1-2 weeks ago, but this is now potentially deviating back down, at which point range-mid on this hybrid chart will provide nice confluence for other patterns (with respect to "timing lows").

TOTAL 3 (EXCLUDE BTC AND ETH)There will probably be a mini rally in an ending diagonal, then a big collapse for alts is coming. Do not hold; just buy and sell.

Altcoin season May-June 2023Hi guys,
Looks like we hit the bottom or we are very close in regards of a potential upside move for altcoins. This would be confirmed with a drop in btc.d and a stable overall total market cap.
We noticed a 4h bull div on the RSI vs price. First targets marked on chart, get above & we fly.
Happy hunting !

ALTCOINS - TOTAL3 Very SmiliarLooking at TOTAL3 (Altcoins excluding Btc & Eth) we see something very similar to TOTAL2.
We had a double bottom (around $290B) which is EXACTLY our 0.236 of our macro Fibonnaci trend from the covid crash to the 2021 peak right around $1T. I have outlined all subsequent fibonnaci levels of this trend as well. We know this fib trend is valid as our 0.382 ($450B) became resistance before falling to the 0.236 as support. We have also caught bids for altcoins in our green box of support. This was the macro resistance of 2017 that buyers have been trying to defend as the new support region.
Also on our HV indicator, March & May marked volatility lows around the key 27 level. If altcoins are to stagnant more then a revisit of the 27 level would be when to expect that volatility to surge through altcoins across the board.


Altcoins $TOTAL3 looks good, but weakness likely lingers#Altcoins still look good although the weakness we are seeing is needed for the FLAG formation.
The 4Hr chart shows that weakness may be a lil longer.
CRYPTOCAP:TOTAL 3 = No CRYPTOCAP:BTC or $ETH.
Obviously some #crypto look better than others.

When Alt season? When moon? When rocket emojis?We are yet to see first, a pullback by BTC coupled with stock market correction and destruction of Alts. Capitulation by both price and time.
Notice in prior cycle with 714 days of red and current 574 days of red at most recent bottom of TOTAL3.
NOTE: 2020 Feb-March has been omitted as a black swan (anomaly)
Recession is looming and true scale to be surfaced. Bankruptcies and commercial real estate pain needs to pass. FED cannot pre-maturely ease monetary policy otherwise a wage-price spiral is at risk and unraveling of inflation expectation demands.
I've mentioned Blackrock ETD and it's CEO going on CNBC, the point I'll re-iterate is that if markets are now bullish as they make it seem, why haven't we broke past $32k Bitcoin decisively yet?
Insert meme: "IT'S A TRAP!"

In case of an Alt coin runDear team.
Considering the fact that we might be entering an altcoin run, i would like to advise that from Elliott Wave perspective, things might not be so clean and easy to predict.
Motive wave or clean impulse proceded by a clean zig zag 3 wave move into the golden zone is the easiest textbook example that is not happening as often as we would like.
There are moments where waves 2 might be done and we cant even recognise it.
Waves 2 are most of the time deep...BUT they dont have to be deep. When crypto goes, it goes strong
What i am pointing out here is ...
As Elliotitians, we want to pick our entries and leave the mouse and keyboard, and let the history print itself.
You can, however set your take profit areas because taking partial profits didnt hurt anyone.
What you shouldnt do, is assume that there is only one way of motive wave to develop and to try to outmart the market by trading every supposed move that you think you might see. Dont be a rabbit . Dont rush your decisions.
Especially trying to short potential corrections if you are strong biased that we are in the bull run.
In the end, turtle was faster than the rabbit.
EW= Turtle power/way of trading.
There is a potential (will repeat that its a potential) for some alts to go strong in this run. So if you had golden hands to hold them all this time, make those hands diamond and be patient with them rising potentially during the year 2024.

Bearish 5-0 on (Total 3 Excluding - LTC and Stablecoins)There is a Bearish 5-0 visible on the Daily on the Total Market Cap Ex- BTC, ETH, LTC, and the two big USD-based Stable Coins; if it plays out, I think Total 3 will make a new low that will likely take it down to the macro 0.886.
We also have some Hidden Bearish Divergence on the RSI to back it up.

RetestLooking on the sht pattern and indicator, TOTAL3 will probably retest the 330B range value.
July 15th has passed
Trade safely.


Total 3The future of the cryptocurrency market shines bright,
In the coming months, expect a remarkable upward flight.

TOTAL3 Breakout - Altseason 2023?The TOATAL3 chart has been in correction for almost two years (600 days).
This correction formed as a Falling Wedge, which is a bullish reversal pattern.
Yesterday, following the court ruling about XRP’s case as “not a security,” TOTAL3 broke out of the wedge to the upside.
The final confirmation is if TOTAL3 gets above resistance at 407 billion USD.
What do you think? Please share in the comments.
Best Wishes.
Total3 1440If we have a high consolidation, we will see a Saudi move across the entire market, and the market volume will rise dramatically.
Thank you for your attention.


T3 5DHi!
Oops, it's been a while since I opened up
TOTAL3 to see what we have here.
I mentioned in an idea a couple of months ago
that I liked 5D timeframe,
which has often replaced a 1W for me.
And I turned it on just in time on this chart.
A death cross of the EMA 200/100 is forming.
Right now. For the first time.
Usually this thing acts like a hammer.
If you turn on the logarithmic chart display,
you can see that there is not much
left before the trend line touches and the point may lie
at 260-290B, depending on the rate of decline.
But I really have a bad feeling about this.
The price has already approached the trend line,
but the cross has just formed
and of course it will not dissipate in the next year.
Does it mean that the price will go under the line?
It is possible.
But after the breakdown of the line there is no way
to predict how deep it will go.
The VFI as you can see is confidently moving in bearish territory
and the long EMA of volume looks there as well.
As usual, draw all conclusions on your own.
I am not making any altcoin purchases yet.
P. S. I saw a rather curious opinion of @HustleGrindMomentum
This is what he writes:
"When i see the market do its thing, BTC and ETh go then ALts pump etc I am ready for more upside or at the least sideways accumulation phase but when we see a btc eth rally and then TOTAL and esp TOTAL3 dont pump above BTC or and TOTAL below TOTAL3 and BTC and ETH below both of those when compared on the same chart we see downside. this is not money entering the market but people getting out of DeFi ALTs you name it via BTC and ETH. this is time to run not buy last time I saw this in the charts we took a 35 to 40 percent crypto market DROP food for thought. for me and mine we dont want to spread to thin rite now and r ready to exit the market quick fast and in a hurry if needed."
I think this is an important insight, and I certainly don't have a better version of it.
I see the process, and he has an explanation.
