TOTAL3In the past i did make some wrong judgement toward total3 but i admit the journey isn’t completed lost until we see what happen this month.. i will be staring at total using the weekly level to see what will develop in coming weeks ahead. But so far I do have some insightful thoughts that if we indeed rebound from this demand level.. there’s room to grow upside..
TOTAL3 trade ideas

Altcoin Season soon? 😲Chart speaks for itself. This is how BTC looked before its breakout from a similar falling wedge.
Now altcoins may follow.
Breakout this summer for altcoins?
Let me know what you think in the comments.

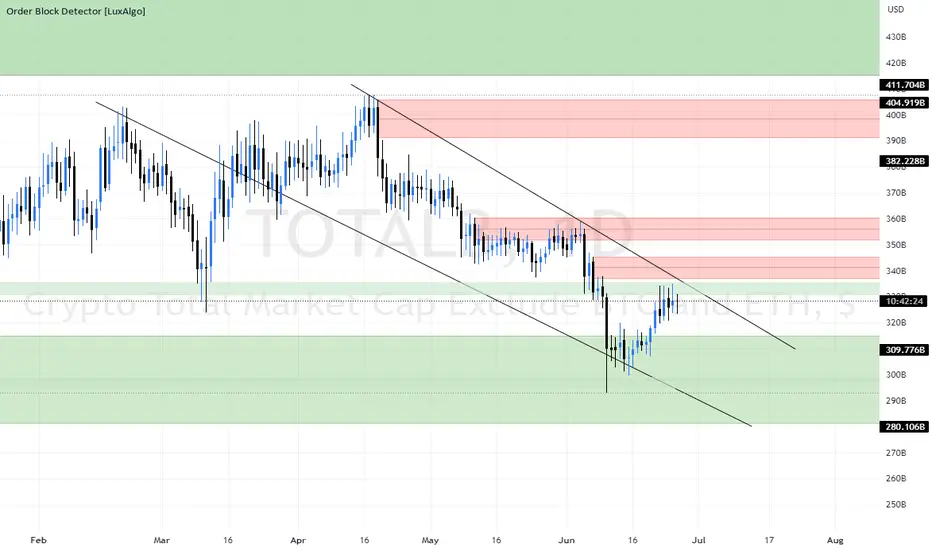
TOTAL3 | ALTCAP minus ETHA huge Head and Shoulders bottom is forming for the TOTAL3 ALTCAP.
The red boxes show the key resistances to clear before fresh ATH's can be printed.
In green a possible trajectory is shown to the 1.618 extension target of this whole correction.
Invalidation: a drop below "Head"

Total 3 TOTAL3 - Total Altcoin Cap excluding BTC & ETH, Rising above the nearest resistance line, Green line, waiting for a 2D candle close tomorrow morning 7am above this level, this can be considered a good support altcoins.
HA candle turns Green, no lower beard indicates a strong uptrend
Expect over 10% gain for Total3 in July.
Wish you all a big win in July.

ALT SEASON IS HERE!!!Sometimes I just draw lines and throw stuff at the wall to see if it sticks. So I had some fun with log graphs on BTC and Market Cap excluding BTC/ETH, AKA Alts. The following chart is the alt market cap. The yellow vertical lines are halving dates or expected halving dates. (April 16,2024 per time of writing). The blue lines are the approximate market bottoms. The purple lines are support trend lines that follow each bull rush.
We witnessed a double bottom after the FUD of the SEC declared war on alts. #FireGensler trending near you. This number was conveniently at approximately $300B. Which is a near 10x factor from the $30B alt market bottom from previous bullrush. This double bottom was similar to that of the past crypto winter around the black swan covid event. One could say that the SEC declaring war on the two largest crypto exchanges in the world could trigger a small "black swan".
Finally I created a downtrend triangle that signified the market resistance throughout crypto winter. In the previous cycle as the market cap begun to break resistance, FUD was there to make sure it double bottomed. The SEC fud created a double bottom that now will signify the start of alt season. The purple lines point to a potential 10T market cap top for alts and a market bottom of $3T during crypto winter.
At the time of writing Gary Gensler was rumored to be resigning due to an internal investigation. Fidelity, Ark, 21Shares, Blackrock, Bitwise, Invesco, WisdomTree, Valkyrie, VanEck, and Citadel are either creating their own exchange or have filed for a bitcoin spot ETF, with most selecting Coinbase as their exchange for policing. If the cases against coinbase, and alts as securities are dropped and if large scale financial institutions continue their purchasing of bitcoin it is not unfathomable that we will see large sums of money thrown into the alt market cap.
Buy, hold, and enjoy the ride.
Disclaimer*: This is not financial advice and the writer owns alt coins such as SOL, ANKR, SHIB, and AUDIO at the time of writing.

Altcoins Double-Top, DXY Double-BottomShould TVC:DXY move back down to the bottom shown on the chart above, the altcoin market could move back to its top.
There is also a possibility of this happening if DXY simply moves sideways for an extended period of time.
However, if DXY moves back up above 105-108, hits 112-116 and continues, expect the altcoin market to move much further down.
Why?
The altcoin market and TVC:DXY are significantly negatively correlated, moving in near mirror-images of each other.
DXY correlation with alts (and Bitcoin, Stocks, etc) does cycle into the positive at times, but predominantly remains in negative correlation, long-term. This makes sense, too:
as the dollar index strengthens or inflates, the vast majority of everything that can be purchased with it will lose value
as the dollar index weakens or deflates, we see them gain in value.

TOTAL3/USDT GRAPHWhat if this range is actually a power of three setup?
PO3: Consolidation, then manipulation (the false move), and then an expansion in the opposite direction (the real move).
Not a financial advice

Alt run coming.. soon!As Bitcoin edges closes to the end of its exit-pump cycle, i expect alts to run hard!
Some say alt runs are dead... but i believe the cycle of greed will continue to run regardless of legislations and whatever the SEC says :)
Nice little grab lower ready to pump into the gap.. enjoy!

Where is the Altcoin Market Heading?TLDR:
IMO, the altcoin market is in the depression phase of the Wall Street Cheat Sheet.
I expect TOTAL 3 to hold the 300 billion support level and break out of the falling wedge when Bitcoin breaks the 31K resistance level.
Target: 1.11 Trillion.
I know that for you to take me seriously I should tell you that all alts are going to zero and that you should ditch altcoins and just trade Bitcoin. Sorry to disappoint you, I think we are on the verge of a breakout.
Take a look at the recent past. Do you remember what it was like in November and December of 2022? Bitcoin was trading at 15 and 16K and almost everyone on CT was calling for a 10K Bitcoin.
Do you remember the disbelief many of us felt in January of 2023 when all of a sudden Bitcoin became mega-bullish? It still is, but that doesn’t stop all the sidelined traders to keep calling for new bear market lows.
If you feel that the altcoin rally earlier this year was a “sucker’s rally” and now everything will go to zero, just know that we are at the final stages of the altcoin bear market.
How do I know? Just look at this “Psychology of a Market Cycle Cheat Sheet.” We are past the anger phase about the Garry Ganslers of the world and well into depression.
If you missed some or all of the Bitcoin rally the market is giving you a second chance.
Now, to the chart:
The TOTAL 3 market cap chart displays the market cap of all the altcoins excluding BTC and ETH. That includes stables.
We can see that the altcoin market is in a correction since November of 2021. Unlike Bitcoin and ETH, altcoins are still in a bear market. However, the chart formation is that of a Falling Wedge which is a reversal pattern.
TOTAL 3 tried to break out once in April 2023, failed (anger), and went from 406 billion to 292 billion, about a 28% drawdown (depression). However, if you’ll take a look at the Accumulation/Distribution indicator you will see that it did not go down nearly as much. My only conclusion is that someone is picking up alts for cheap!
Theoretically, the altcoin market could remain in this wedge further, even go down as low as the lower support line would allow, and remain bullish (pink dot). However, I think it is unlikely. If the people in the market today were sellers, they would have already sold. Just remember the FUD and depression of late 2022. IMO, alts are at the same point Bitcoin was then.
I think that the 300 billion support level will hold and as bitcoin breaks the 31K resistance level the alts will break out of the wedge. As this cycle progresses towards the halving some bitcoin profits will go into altcoins and later new market participants will fuel the altcoin market further.
IMO, this is the time to accumulate and even take long positions, the best is yet to come. Remember it is always darkest before dawn.
(Image retrieved from: fifthperson.com)

TOTAL 3 - EOY outlookI like to use the TOTAL 3 chart to find my buy/ sell zones on alts.
I like this range because it has been respected by price, even after price attempted to break out. I see price being forced into 3 scenarios:
A) continue up to range highs
B) Retest range mid > range lows
C) lose the range low support and continue down, creating new lows
I will go to lower timeframes around these key levels and positioning myself accordingly.

Total 3 Altcoin Marketcap 👀Total 3 Altcoin Marketcap 👀
If you like this analysis, smash the "like button" and leave a comment below to share your thoughts
or let me know what crypto you want to see!
Trading is a reflection of yourself. Learn more daily and be ready for every opportunity.
Have a nice trading!🔥🙌
Alt3 (AltCoins pump into q4 crash) then bull run q2 FY24Title says it all. I am long and holding. Buying major dips and ready for q2 next year

🔥 Total Altcoin Marketcap Inverse Head & Shoulders: New Cycle?TOTAL3, the total crypto marketcap excluding BTC and ETH, has been trading significantly more bearish than Bitcoin and Ethereum. This can also be deduced from the vertical trend of Bitcoin dominance.
Still, there's some good news to be said about the altcoin market. As seen on the chart, the altcoin marketcap has formed an inverse head & shoulders pattern, which is classically a trend reversal pattern.
Keep in mind that the pattern is not yet confirmed. First we have to break through the top resistance (neckline). Nevertheless, it's a pattern that we definitely have to keep a close eye on since it can signal that great things are coming soon for alts.
If the pattern confirms, there's a decent case to be made for the idea that the bear market bottom is in and that a new bull-cycle for alts will begin.
Share you thoughts🙏


TOTAL3 Wycoff accumulation schematic forming Hey Guys,
It looks like there is a Wycoff Accumulation schematic forming on the daily timeframe.
What do you think will it play out?

CryptocurrencyCrypto (Alt coins) minus BTC and ETH weekly chart
- MAs cross signal
- candles below both MAs
- both MAs turning down
I think this is bearish until candles are above the green MA again
None of this should be interpreted as financial advice, I am not a professional or certified financial adviser! all charts, and or analysis' are my personal opinions and observations only!

Decision levels for useless altcoins!Meme coins like BINANCE:PEPEUSDT showed how easy to make money for the fraud developers. There are countles meme coins floating around in the Crypto world. If Crypto market wants to become stronger, it needs to have real tokens with real world use cases. Meme coins should be part of history like the dinosaurs.
Countries have started to reject to give license to crypto platforms. On the other hand Asia has started to support coins and platforms again. We may see another fight here. This war between west and east may accelerate the extinction of the useless coins. We will watch this critical level for the progress along with the bitcoin dominance CRYPTOCAP:BTC.D .
Disclaimer – WhaleGambit. Please be reminded – you alone are responsible for your trading – both gains and losses. There is a very high degree of risk involved in trading. The technical analysis , like all indicators, strategies, columns, articles and other features accessible on/though this site is for informational purposes only and should not be construed as investment advice by you. Your use of the technical analysis , as would also your use of all mentioned indicators, strategies, columns, articles and all other features, is entirely at your own risk and it is your sole responsibility to evaluate the accuracy, completeness and usefulness (including suitability) of the information. You should assess the risk of any trade with your financial adviser and make your own independent decision(s) regarding any tradable products which may be the subject matter of the technical analysis or any of the said indicators, strategies, columns, articles and all other features.

Lots of panic in the altcoin market,this simple chart might helpLots of panic in the altcoin market, because some clown is trying to crack down on crypto. But if you zoom out and look at price, nothing has changed, we are in the bottom region and accumulation zone.
It is normal to have sharp decline and fake outs in the accumulation zone, because "they" don't want retail to be there when the market goes up, read "wyckoff accumulation" for details.
Hope this simple chart could help.

TOTAL3 first law of Newton's law motionTOTAL3 first law of Newton's law motion
Newton's first law expresses the principle of inertia: the natural behavior of a body is to move in a straight line at constant speed. In the absence of outside influences, a body's motion preserves the status quo.

total3 proyectionHere is my pov about the total3 that is all the altcoins market cap without ETH and BTC. Enjoy the ride

Altcoin Marketcap hitting SupportThis chart shows the total Crypto Market Cap excluding BTC and ETH which at time of writing represent approximately 70% of the market capitalization (look at Dominance for BTC 49% and ETH 20%).
The chart indicates a bounce at the levels where we bounced in January 2023.
We can surely drop lower, BTC dominance and ETH dominance may possibly breakout more to the upside before an altseason. But i think that the risk/reward in this zone for buying alts is relatively low, especially when comparing certain alts to their BTC and ETH pairs.
Time to get the Alt Scoop out once this week and all the data is out. CPI was good at 4% we still await the following though:
Wednesday 14th June
- US PPI
- Fed's interest rate decision
- FOMC press conference
Thursday 15th June
- ECB European Central Bank interest rate decision
- US Retail Sales
- US Jobless Claims
Friday 16th
- BOJ Japan Central Bank interest rate decision
I want to see what the market reaction is going to be to all of the above before deploying more capital into altcoins

total 3 last bear market wave. weeklytotal 3 is showing us a clear redistribution. We will se new lows soon. I expect an other bounce to the upside and bulltrap before the massive drop.

Total 3 Bull Market in Jan - Mar 2024Total 3 - Altcoins (minus BTC & ETH)
A different "perspective" to yesterdays chart.
Yesterdays chart suggested TOTAL 2 (Altcoins minus BTC) has a probability of breaking out in Dec 2023.
The TOTAL 3 (Alts minus BTC/ETH) chart suggests we could break out later between Jan - Mar 2024. This would make sense as BTC and ETH are typically first movers, and are followed by the altcoin market.
Its important to understand that these charts help gauge timing a long term trade in altcoins. The charts only provide a rough time frame of a probability of a break out into a new secular bull market between Dec 2023 - Mar 2024. All this offers is a probable time window. I would hope it would help you sit on your cash until we have some confirmation of price direction within a historically reasonable time frame, as illustrated in the charts.
PUKA.
