Altcoins: Monthly down trend spotted...Pain isn't over in crypto, and Altcoins excluding Ethereum and Bitcoin look about to fall off a cliff here in the monthly timeframe...
I would suggest to take it easy with crypto positioning, perhaps best to sit this one out in USD at a safe CEX and stake it (say Kraken) for a while.
While recently Ripple has been doing well, it isn't immune to these flash crashes that have been occurring with news like the fund cashing out or the old coins whales moving coins around to dump stuff held since 2013. Until this cycle of bad news after bad news is over more downside is possible here.
To make things worse, crypto performance has 'decoupled' from stocks, but in a bad way, having recently acted more like Gold following the aftermath of the banking crisis that culminated in NASDAQ:SIVB 's untimely death. It's gotten even worse as it now has random price action totally divorced from either Gold or Stocks, and has random crashes as a result of bad news that constantly assault this market.
Stay safe out there!
Cheers,
Ivan Labrie.
TOTAL3 trade ideas

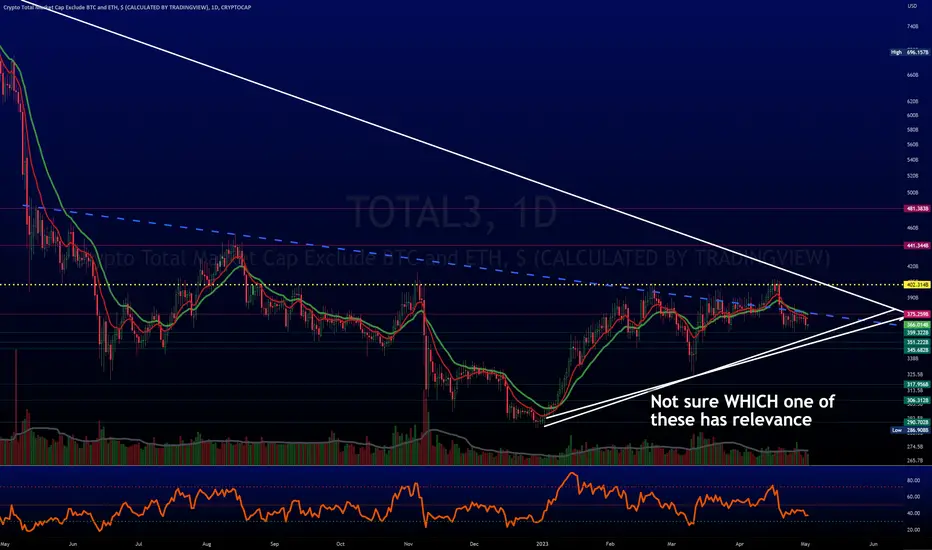
TOTAL3 makes me thinks alts still have to bleedI've layered in some more alts but then I remembered to check TOTAL3 (total market cap without BTC and ETH for those who don't know) and I saw my descending channel hasn't been filled yet.
I think before we can comfortably spend big on our bags TOTAL3 has to test that lower support and reach 253 Billions. More or less it's another -15% drop from here.
My advice is to buy small when you DCA and keep your cash ready for when we bottom because we won't stay there for more.

I told you that I dont have any hope for a soft landing.In my last analysis on Total 3, I told you that I cant see any hope for a soft landing and I warned you. please be cautious or be ready for a big loss.

bullish on some alts really short term .Lets do dollar cost averaging on some of our long position ( Matic,ADA,Sol)
with regards to total3 chart and usdt.d (dominance)...... and big flush in rsi of these alts i decided to go long on them .....
disclaimer:Do your own research
Good Luck

$TOTAL3 = No $BTC or $ETH weaker vs counterpartsCRYPTOCAP:TOTAL 3 = #altcoins = No CRYPTOCAP:BTC or CRYPTOCAP:ETH
Yellow line has shown to be VERY important
In 2021 #altcoin traded in the area for 1 month before it ended up breaking out to the upside
Broke & CLOSED under yellow line 11/22 - 1/23
-
CRYPTOCAP:TOTAL3 Has broken the yellow line @ green arrows & has found support right underneath, done this 2x before today, SO FAR @ LEAST
This is 1x it hasn't had big reversal & HEAVY volume
Each bounce @ this area has been weaker
Hmmm
-
Volume has picked up but it is not what it was before
Could this be waning interest in the space?
-
RSI looking better, positive divergence
CRYPTOCAP:BTC has HUGE favor vs #altcoins atm
CRYPTOCAP:ETH not shabby either
SEC & FUD has hurt this sector, shame
Hard to call direction atm


$TOTAL 3, ALTCOINS, ares in wait mode while $BTC adjusts#ALTCOIN are in an important position to BREAK UP or BREAK DOWN
The yellow line is VERY IMPORTANT
Redrew the lines we had before as CRYPTOCAP:TOTAL 3 (No CRYPTOCAP:BTC or CRYPTOCAP:ETH ) hasn't found its low yet (although may be basing)
Volume is reducing = good (less selling as it lowers is good)
RSI looks good
Lots of resistance but if #BTC moves higher then #altcoins should PUMP, pump hard

Total 3 Support test complete Total 3 Cryptocurrency
Support test complete
Bullish Signal after confirmation

If TOTAL3 repeats itself...I don't particularly believe in fractals etc... however if TOTAL3 (altcoins market cap without BTC and ETH) repeate his previous run in the same time we should see next top at 1.273 trillions dollars. I think it could be higher but let's just stuck with the projection of history repeating itself.
Off course I made the projection assuming the bottom of this bearish channel will be touched again (it means new lows are coming). In that case go watch what price had your favourite altcoins last time TOTAL3 touched ATH (red arrow), assess where do you see it bottoming unless you think it has already bottomed and do a math proportion to understand where price could go.
This is an indicative method to understand which altcoins is more worth to accumulate during bear market.
Good luck

Total 3 daily bottomExpecting daily bearish dragon to lead total 3 to 1.618 fibs , which is a level from weekly pizza pattern.

Total 3 BottomTotal 3 bottom will be decided by a pizza formation.
Expected bottom will be around Sept-Dec 2023

Crypto $TOTAL 3 been weak & likely has lil more to goUnless you're not on twitter #memecoin season hit hard & looks like it has likely GONE
This was a weird phase, very different from many others
Usually the pattern on break down = CRYPTOCAP:BTC > CRYPTOCAP:ETH > #altcoins > #memcoins
But most #crypto fell at same time this time around
Well, except SOME #memes
IMO the Bull is not dead BUT has a few spears in it (think Spain)
LONG TERM #crypto just retested BREAKOUT lvl
Need to expand long term chart

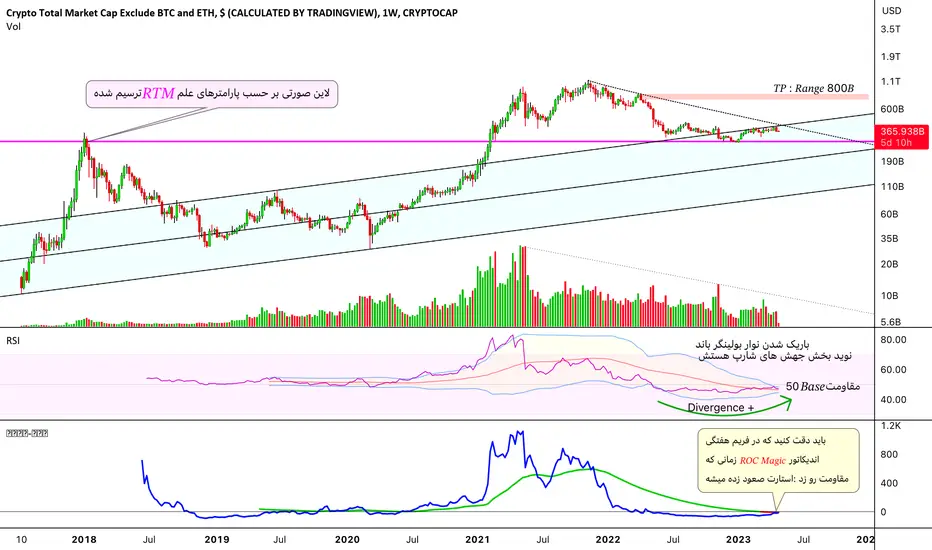
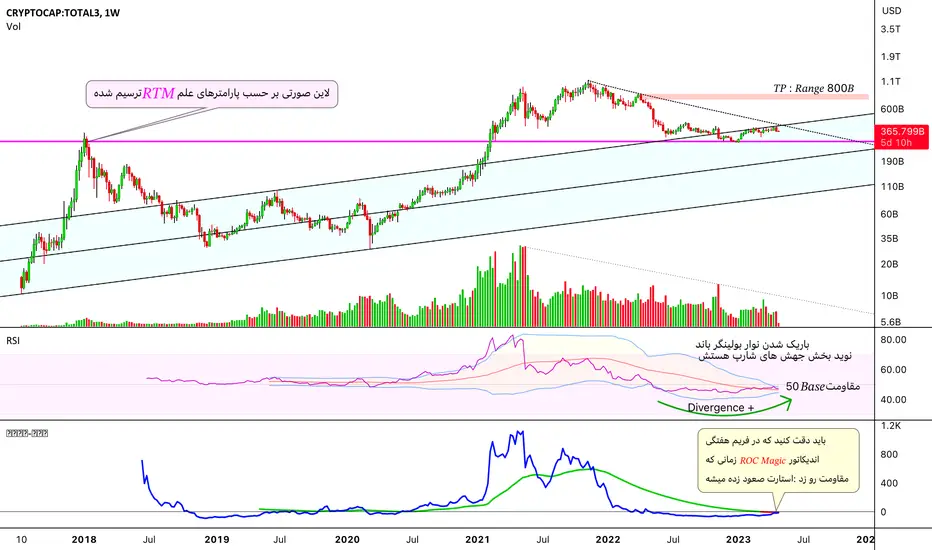
Total 3 Market cap , Bitcoin marketcap so right now we hare see Bitcoin marketcap chart look at the macd cross point it's very dangerous because it below 0 base line most off the cases see when market take aa relly he came near arround 0 base line of macd then cross the macd blue line to Orange line this cross are horrable but when this crash end market going up quickly because he near around 0 base line of macd
Bull market symptoms of according to macd = bull market started a wave structure we all no but you think why are tha most long wave is wave number 3 because most off the case we see macd cross it below 0 base line and continue above 0base line (0 base line abovel weekly it means bull market and below 0 base line it means bear market ) then he take a Little bit correction people called second wave off bull market now started wave number 3 wa ve number 3 are so long because he take off near above 0 base line of macd then continue rally and below he go up very hard and go now started off wave number 4 are not a big because he already is very High off macd level most off the buyer avoid 4 wave is a little bit correction then wave number 5 he go down and he re take off above base line .

Crypto Market Cap | Looking Mid-Long Term BullishCrypto Market Cap | Looking Mid-Long Term Bullish
We are in a strong descending wedge that looks like it can continue down to $332b region before breakout - a break out will only mean good news for Bitcoin
| Pivot Untested Weekly Pivot
| Historical Support being tested
| Key Support
| Filled Weekly Pivot
| Bullish Divergence
| Don't Forget To Hit Follow To Never Miss An Idea |
| Please Support By Giving This Idea a Boost |


I cant see any hope for a soft landingHi investors and traders, as you can see we need just one push to break below the bullish trend for alts. and it can create a big panic sale in the market. so please be carful about buying or even trading on any crypto pair for hope of long term investment.

TOTAL3 RSI Enters Oversold Zone - What's Next for Altcoins?The cryptocurrency market is currently experiencing a bearish trend, as evidenced by the Total Market Capitalization (excluding BTC and ETH) chart. However, there are several factors that suggest a potential pullback may be on the horizon.
Firstly, TOTAL3 has approached the bottom of the descending channel. This could indicate that a trend reversal is on the horizon, and the market could be gearing up for a bullish run.
Secondly, the RSI has gone oversold. This is a classic indicator that the market may be due for a bounce, and we could see some bullish momentum in the near future.
And lastly, we've seen a clean rejection of the 727.2% Fibonacci support. This is another strong signal that the market could be preparing for a bullish reversal.
All of these factors suggest that a pullback is possible, and that the price could be aiming for the key supply/demand zone near 365B. This is a strong bullish indication for Altcoins, but only if we do not see a decisive break and close below the current low.

Altcoins not looking hot, but haven't in some timeCan't recall last time we had this much cash available for #stocks AND #Crypto
CRYPTOCAP:TOTAL 3 = NO CRYPTOCAP:BTC or CRYPTOCAP:ETH
IMO, unless change FAST, #altcoins look like they want to trade a lil lower still
(we haven't posted much here but we're still active, pls see profile. Making killer calls)
For Alt coins, Down trend has not finished yet.we ca see the value of total 3 still struggling in a flat channel and its is under declining trend line, by the fact that the BTC dominance is so high, if BTC starts a corrective wave it can affects dramatically on alts. so be cautious about your trade and the size of your account and leverage.

Destiny TOTAL3I hope you will be careful like a hunter and be able to enter on time, of course, you must pay attention to the limits
DestinyI hope you will be careful like a hunter and be able to enter on time, of course, you must pay attention to the limits
Have no fear cup n handle is here.Total 3 forming a nice little rounded bottom and usdt and dxy topping out.

Total3 LevelsThis chart shows key levels on Total 3 chart (altcoins) compared to BTC.
Keep an eye on it to check reactions at key levels to more closely predict when we will have a proper altcoin run - enjoy :)
