I live by Total3I live by Total3
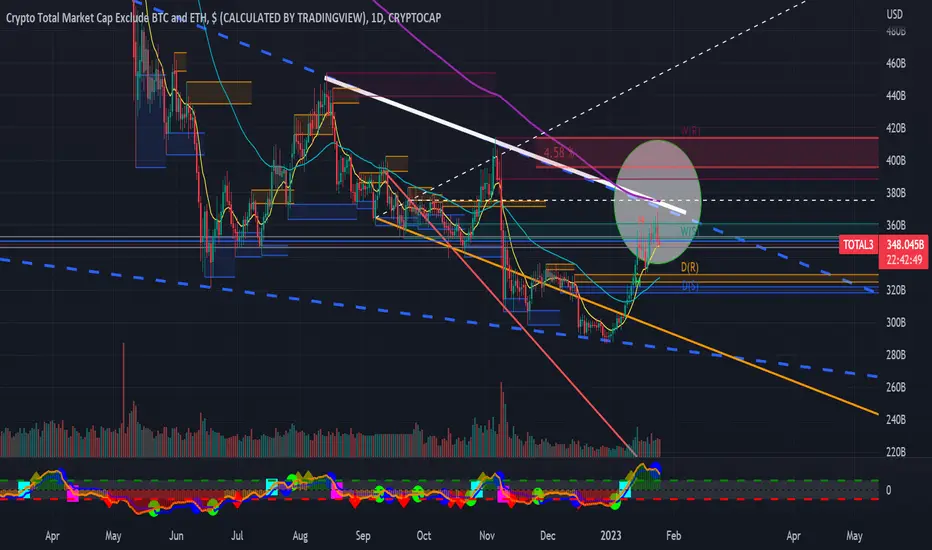
50 MA is approaching 200 MA which to me means it will pop upwards, and we have volume sitting that is still to be hit.
So I am not selling Alts until this has happened - very happy in position
TOTAL3 trade ideas

Altcoin Market Cap General View excluding ETH and Stablecoins.Hi all,
I'm sharing Altcoin Market Cap graph excluding the stable coins and Ethereum. This graph helps me to see my portfolio performance which is under or over performed against the market.
If my portfolio over performed against this graph, I convert some altcoins into BTC, ETH or cash. If the other way, then I convert some BTC or ETH into altcoins.
From the last dip, we have seen 60% increase which is not bad. At that time I made 75% overall (not so bad thanks to AVAX).
Even though I do not expect to test low prices, I'm totally ready if we lose 50%-60% from here. If we drop that much, I will still be a buyer actually a heavy buyer!
If the dip is found and we go higher, I expect to hit nearly 3-5 billions of market cap which is roughly 15-20x from now! Not bad at all!!
Based on these levels, I'll be doing my asset allocation and risk management!
Cheers!

TOTAL3 = Altcoin Crypto is moving better than BTC atm = LIKEY!Please see profile
This is re-post
$DJI almost went green since post
$NDX went HIGHER
$BTC sells but fresh buying came in
#bitcoin battle ensuing
#BTC breaks 24, hopefully with volume we should see MORE than 10% pop, maybe even fill gap
*******
#Crypto #altcoins pumping $Total 3

🔥 Altcoin Market Break Out: Finally!After many large names have broken out of their immediate downtrends, TOTAL3 (all cryptos, without ETH and BTC) has finally broken out through the descending resistance line as well.
Keep in mind that we're currently in a break out process. Once we close the day above the purple line we can say it's confirmed.
I'm looking at the blue lines as my near term targets, indicating another +7% and +17% total growth of the altcoin marketcaps.

Altcoin cycles I am expecting Altcoins price actions , Currently this rally of Bitcoin and Altcoins is very painfull for most traders and unexpected rally,
This rally is looking like bubble, take profits as shown in charts and re enter after proper correction

You better be Bullish on ALTS!Look at this beautiful chart!
Double bottom on small ALTS dominance.
Small Altcoins will rocket from here!

TOTAL3 Market Cap ( Exclude BTC & ETH )TOTAL3 is pretty well ALL ALT COINS but does include BNB and al its BNB Chain coins.......(maybe time to NOT call BNB an ALT anymore but thats another convo )
This Daily chart shows us how PA has been stuck in a descending channel since around May '22 and how, repeatably, PA has hit Top trendline and been rejected.
And here we are again
Shorter Acting StochRSI is oversold so may offer some support but over all, MACD ( longer MA) is above 0 but not yet Overbought, so, should fundamentals come in with Good News, we have the ability to lift through that line of resistance.
A descending channel has a high chance of breaking trend, the longer it stays in it......but it replies on fundimentals and investment to make that happen.
There is a strong chance, Markets may well just wait now till the FED in the USA ( A Group of PRIVATE Bankers) decide how they are going to approach the issue of interest Rates.
The very idea of Crypto becoming a World wide financial service will get rid of this "Centralised Financial model" where One group of people can control Everyone else.
But that another story, meanwhile, Take care, have a plan and act upon it....PA may well Drop before it goes up again,

2023 Crypto Echo Bubble - sh*tcoin edition July 2021 to November 2021 rally of Total3 overlayed on current chart. Would be a perfect underside re-test. See 2023 Crypto Echo Bubble post on BTC fractal for more info.

ALTs need to break trendALTcoins have been bullish but...... cabt break trend the line shown in the chart ...i do believe when that happens ALTSeason begins
Crypto Market CapLooks like the crypto market is about to bleed on last time before lots of money is going to get dumped in after it bottoms.
~186 Billion (a numerical version of phi, the golden ratio, the 618) will be where it bottoms.
Get your USDT, Cash, USDC, ect ready. Looks like January 18-25 or so.
If there is any chart you'd like to see me calculate. Send a message and i'll pop it out for you.

TOTAL 3 Ex BTC & ETH - CautionI see a lot of people jumping up and down about ATLS running but this chart shows a level of caution should remain
That 200 SMA has rejected PA harsly before and may well do so again - However, on the 4 hour chart, PA is being supported well by the 50
But, may not be enough....
Once PA gets through this 200, than I am all in
Untill then, please remain cautious

Small ALTS dominance about to go UP We've created a double/triple bottom on the small ALTS dominance.
In my opinion, small ALTS will start outperforming Bitcoin in the coming weeks, months.
WARNING. I am a altcoin bull! I am biased!

possible long after a retrace on T3This is the crypto market cap minus btc and eth.
A nice invalidation level, you cant trade this directly, but can use it as a guide to know whether alt coins will run

#Altcoins Wave 5 | #ALTCOIN CYCLEWave 5 : ALTCOIN CYCLE
White EW:
-Macro Wave 4 has hit the 0.382FIB
-Macro Wave 5 is forming.
To the Moon!
That is all.

TOTAL3 ( ex BTC & ETH) Crypto Market CapPA coming under pressure here and is bumping into the 200 SMA for first time since April '22
It is also running along upper trendline of long term channel AND at same time, now hitting the longer term resistance from Off ATH
This is a crucial time for ALTS
They have already begun a slight pul back in Markets while BTC PA appears to be hanging on for now.

🔥 Altcoins Can Fall MUCH Further: Be Careful!As seen on the chart, the total altcoin market cap has been steadily falling and making new lows while BTC and ETH are still trading above their respective bear market lows.
Last cycle the total altcoin market cap fell a whopping 92% from the top. If the altcoin were to fall that same percentage during the current bear market it would indicate that alts will fall another 69% on average.
Another way to track the relative weakness in altcoins would be to look at the Bitcoin Dominance. Check my most recent analysis on it below.
Whether alts will fall another 69% remains to be seen. The market is more mature than the previous cycle, plus there are arguably better alts on the market which people will want to keep buying. Nevertheless, I think we can safely assume that the current ~75% decline from the top is not going to be enough.
How far do you think that alts can still fall? Have we bottomed? Share your thoughts🙏.

Total 3 - I think Altcoins havae bottomed!!!Giant wedge from the top, we just hit the bottom of it, I think altcoins are about to rip faces along with the rest of the markets. Hard to believe now in the depths of the bear market but the best thing to do is to just play the charts. Still need confirmation but I'm getting excited.

TOTAL 3 with thought process of bullish and bearish ideasTOTAL 3 need a support bounce to help the ALT coins
if it breaks below 307 it will be very bad for the ALT coins
what we really need is the price action to get a
support bounce ( bullish retest ) of 336
Price Prediction
not financial advice
this is for entertainment purposes only
always DYOR

#XRP 89% Draw Down Narrative #XRPUSDThe 2016 XRP Draw Down was 89%. Will history repeat in 2023?
I compared the TOTAL3 (altcoins) 2018 Fractal and nearly nailed out the full 89% Draw Down ALTCOIN market.
There might be a small pump before the HUGE dump to the full 89% Draw Down.
Altcoin Rally:
- Potentially Ripple SEC news comes out?
- FedNOW (SkyNET) Goes online Mar 2023 and everything crashes down to 89% mark?
* www.federalreserve.gov
Will XRP hit the Double Bottom?

Altcoins look like s*Clearly confirmed r/s flip here. Below 302B its full send down
back flip r/s and it might buy bulls some time
Hold my beer pls
----
No financial advice, do your own research, don't be stupid

Total3Total 3 Market Cap is approaching the Phase E of Wyckoff Distribution where the price will soon break the support and continue the downtrend.
The Target is $150b which can be seen as obvious support on the weekly.
This is the beginning of the 50-60% drop most alt coins will experience.

Total 3 3day chart is bullishI have marked out the last couple of times that the MCB showed bullish divergence.
Is it alt-coin season? This graph says so!

Altcoins about to get #rekt
Same as for Bitcoin but way more severe.
Started 5th wave down with wave3 triggering 2.618 => wave5 will hit around 4.236 (intermediate, orange count).
Locally same structure expected to hit that level w3 on 2.618 and w5 on 4.236
Also locally just now confirmed previous support as resistance.
Fasten your seatbelts!
Bargains ahead!
Hold my beer pls
----
No financial advice, do your own research, don't be stupid
