TOTAL CRYPTO-CAP, Retest of the Primary Formation Indicated!Hello Community,
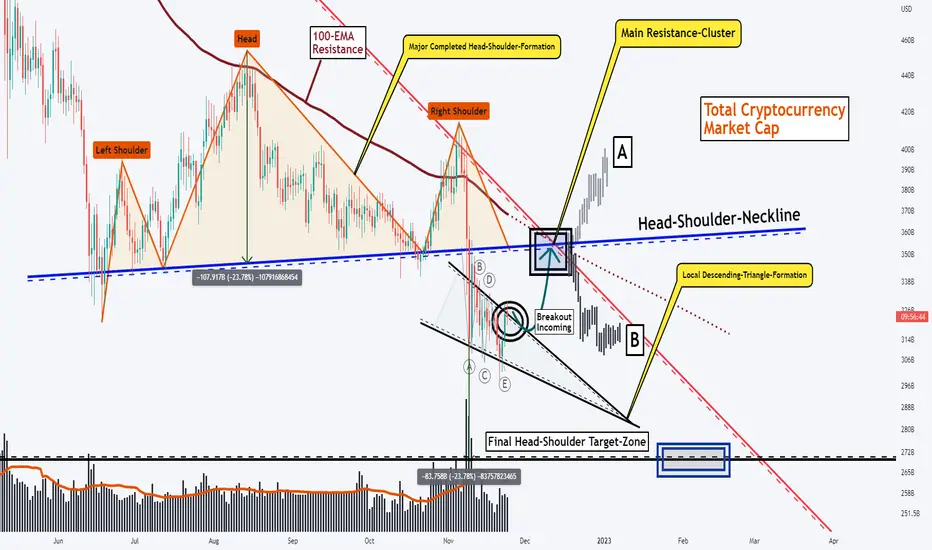
Welcome to my new analysis of the Total Cryptocurrency Market-Cap and where it is heading in the next time. Important to notice here with the Total Cryptocurrency Market-Cap is that the price action made a sharp dip towards the downside beginning just hours after the FTX collapse has been officially announced as I already pointed out in my recent Bitcoin analysis. To take this into the current context it is necessary to realize that this dip may not happen if the FTX collapse did not happen at this point, therefore this sharp bearish wave can be considered as an unnatural movement nevertheless it has completed a crucial formation and this is the important point in this whole structure. As the Total Cryptocurrency Market-Cap completed this massive head-shoulder-formation this gives the whole movement a bearish edge also from the technical perspective.
Now it is necessary to wage the possibilities and see where the market is likely to move and in this case, the market is now forming this interesting local descending triangle formation which is likely to complete as it is marked in my chart, once this formation has been completed it will be the setup for the market to continue and show up with a volatility relief rally till further levels are being tested. In this case, once the formation has been completed the market is likely to move on into the head and shoulder decisive range as seen in my chart, from there on two directions are possible, firstly the market manages to move into this range with a very strong bullish movement giving the indication for a breakthrough above the resistance and declaring the formation as a fake head shoulder formation and the second direction will be a pullback from the resistance from where on the price action is likely to reach out the final targets of the head shoulder formation, currently, the second scenario has a higher possibility nonetheless this can change when the market shows up with a considerable bullish strength.
In this manner, thank you everybody for watching, Let's move forward together.
"Diligence is the cornerstone of good fortune."
The information provided is only educational and should not be used to take action in the markets.
TOTAL3 trade ideas
MY MINIMALIST ANALYSIS FOR TOTAL 3 ALL CRYPTOSTOTAL 3 - ALL CRYPTO CURRENCIES
On a DAILY Chart
LONG POSITION -MOMENTUM STRATEGY - SWING
11.14.22
0845H +8 SINGAPORE
Disclaimer:
The findings of the following analysis are the sole opinions of the publisher of this idea and should not be taken as a piece of investment advice.
My Published Ideas are not 100% Accurate. There are many factors at a given time that can change the forecast.
ALERT:
Forecast Entries for a BULL SWING.
Based on VITAL SIGNS ( RSI , STOCH , VOL., MA VOL.) RSI is EXTREMELY OVERSOLD , BUT we still have to see if it breaks the next or reaches the AREA OF CAPITULATION
We still have roo for our extreme entries as the war in Ukraine continues and the economy recovering from the pandemic
In my oppinion and what the market is doing, Smart money wants a REBOOT of 2018 and all is possible for the forecasted entries based on numbers and the character of the market now. Let us see how price action reacts on a DAILY chart .
A lot of HODLING happening which gives it the strength to go further down in small increments.
The BENTO BOXES are close to a hundred percent in forecasting turning points.
Hoping that this BENTO BOX CHART ANALYSIS will efficiently help you with your DYOR as we Enter a NEW SWING CYCLE for LONG positions, either short, mid, or long term.
INSTRUCTIONS:
HOW TO USE THIS MINIMALIST CHART a.k.a (Bento Box)
"Follow the white rabbit!"
Just Follow the TOPS and BOTTOMS of the BOXES as a GUIDE to where the MARKET will take you.
If it cannot break a TOP or BOTTOM of a BOX, It signifies a reversal.
TARGET ZONE IDENTIFICATION:
The LARGE BOXES (Tops and Bottoms) are MAJOR turning points that will occur sometime in the future. While the SMALL BOXES (Tops and Bottoms) are MINOR turning points.
These can be entries to a BUY/ SELL POSITION, EXIT/PARTIAL EXIT/TOP-UP AREAS, as well as Support and resistance levels
Also includes MAXIMUM TARGET EXIT AREA OF VALUE - CONSERVATIVE (If price action conditions are right at that given moment.)
NOTE:
1. That PRICE TARGETS for ENTRY and EXITS are DYNAMIC and can CHANGE from time to time.
2. Created using data on a MONTHLY, WEEKLY & DAILY Analysis of a MARKET'S CHARACTER.
3. My BENTO BOXES are designed for SWING TRADES at the LOWEST or START of a SWING CYCLE.
4. At times I will include a WAY BEYOND PARABOLIC PRICE TARGET, depending on The Character of the Market (CRYPTOS ONLY).
5. DYOR for your Fundamentals, Volume , Chart Patterns, Candlestick Math, FIB COILS ( ABC ), Price Action, FIB LEVELS, Market Dynamics, AB=CD Pattern especially institutional and retailer trading psychology .
Wishing you all The Best Trades and Thank you all for your Appreciation and Support of My Work.
Much thanks to My 3 Mentors. They are so much of a Blessing that I also wish to share my knowledge.
Vive Le Autist!

TOTAL3 -Altcoins Mega Falling Wedge Ready To begin a bull marketLet us analyze the total 3 chart - which measure only altcoins excluding Ethereum . It seems to have possibly bottomed at around the 330B USD level and forming this gigantic falling wedge bullish pattern. The Target for this pattern breakout will be at least 10x of the market cap of altcoins from now.
This is an incredibly long term chart and might need years to play out but make no mistake crypto is here to stay and this pattern is still very much valid. Invalidation would be Until we see a strong breakdown of support and confirming the current support levels around 330B as resistance


ALTS and Predictive ModelsAnyone who follows me knows that I sometimes color outside of the lines regarding my application of tools for predictive means BUT, they sometimes work. Again, I use TOTAL3 because of my personal aversion to ETH and all things ERC20. I've NEVER had good experiences with that and prefer faster, cheaper methods to move around the crypto space (ahem . . XML . . yatta yatta )
Some reasons to support my rationale here :
1. Historical price action
2. A still highly speculative nature to crypto and the ridiculous parity it has with the S&P (standard piss)
3. More talk re: centralized CBDC's and the belief that the globalists would love to just push the delete button on everyone's personal wealth ("You will own nothing and be happy" . . F.U. Klaus)
4. At least one more flash wick liq before moon
The time frames might not be 100% but I think are reflective of larger market forces real word possibilities.
I like high, conservative probabilities and use DCA strategy ALWAYS, never shoot my wad even if it means missing massive gains. I'd rather make smaller, consistent gains than risk losing 1/2 my port on an overly leveraged position, not worth it and I've seen too many traders get liq'd never to return again. Makes for a much friendlier public chat here, despite if having gone into the trough in a massive way.
As always, this isn't investment advice, simply analysis for you to do your own research.
Stay frosty my friends!

ALT Coins & Predictive Models IIIf you go back to my previous idea for TOTAL3, you'll see that I had "eye-balled" a pitchfork (downward) to show a channel that I figured we would eventually take. I may not have gotten 100% accuracy on that fork but it was obvious (to me anyway) that we had some serious correction coming. That fork has proven itself after all.
So welcome to the next leg of the bear market, even if the plunge protection teams get in there and attempt to prop things up, bear markets are NECESSARY and deep corrections are EXACTLY what we need in order to shake weak projects, weak hands, hopium, hype and all the scams from our midst.
What has value is worth paying for and owning, the rest will vanish (assuming a free and generally un-tampered market, which we don't really have)
Enjoy the interim relief rally here but don't hold your breath for 90k Bitcoin and ETH, it still pretty much sucks, it's expensive, slow to transact and mostly a pain in the arse to work with.
* * * Not Investment advice * * *

Total 3 bullish pattern emerges This fractal pattern from 19-20 has so far repeated perfectly. The only move left is the explosion upwards into new highs. The whole move is now being followed by a spike in volume . Let's keep an eye on it and see where it goes.
This is not investment advice and you shouldn't take it as such. It's an observation and it's for educational purposes.
Thank you
'WeAreSat0shi

Total 3 has bottomed and it's bullish!!According to the RSI the total 3 market that excludes BTC and ETH seems to has bottomed above it's rising trend line and is showing a hidden bullish divergence.
Does this mean a massive altcoin season is coming ? Possibly. I'll explain why.
This market cap includes stable coins . So it includes stable coin growth as well.
I think it needs to be followed and see where it progresses before we can make a proper assessment of it.

Mini ALTSEASON... But how long?Will ALTSEASON pump to the MACRO TRENDLINE where the MA 200 is?
I find it very interesting that the ALTs are rallying during a correctional phase in the markets.
I will take the pumps Long and Short while the opportunity is here.
But there is a good chance they continue to move up before rejection or advance off trend.
Good Luck

Altcoins on the Verge of...often said, soon its gonna be here: Altseason
Break resistance in order to rise to next overhead resistance around 640B
Or die by the flag and get #rekt (whats everybody is hoping for appearantly)
Hold my beer pls
----
No financial advice, do your own research, don't be stupid

Mean Reversion Play for Summer 2022 Be careful700-750 target
it probably rallies some this summer, but don't get fooled into Diamond Handing the Mean reversion. it will rug you again in the late summer or fall
“The meeting of two personalities is like the contact of two chemical substances: if there is any reaction, both are transformed.” ...
“Everything that irritates us about others can lead us to an understanding of ourselves.” ...
“Your visions will become clear only when you can look into your own heart.

TOTAL3 is getting even closer to a breakout?look how the Convergence and
divergence with the Price action
and RSI move together...this is an
example of how charts work...we
have never been this oversold...
big things ahead for the ALT coins.

Moment of TruthIf history is an indication to guide us in chart analysis, we are at a detrimental moment.
In December 2018, Total3 bottomed at -59.33% from the 200day. Now (if we have bottomed) we had a -54.10% from the 200day (close enough to me).
In 2018, Total3 spent 315 days under the 200day, now we have 273 days under the 200day.
We have 42 days to go which will bring us to early December coinciding with the
FIFA World Cup (The biggest Event in the world) has one of its official sponsors Crypto.com (coincidence?).
My take on all this is according to the following:
1 - Markets tend to surprise the majority of investors, so if the majority is bearish, the market tends to turn bullish.
In my research for the last few months, the majority of crypto space "people" had basically two views on the market:
a] BTC is crashing to 10k or below
b] BTC is having a relief rally while the Alts bleed
In this scenario, the only outcome that would prove the Majority wrong is a strong altcoin season with BTC retracing slowly but not getting close
to put a new ATH.
2 - Crypto Youtubers are always wrong, let me emphasise that, CRYPTO YOUTUBERS ARE ALWAYS WRONG. That is why they need to create new videos every day
so they can fix their analysis and change their theories to try to mirror the facts. Therefore, they are a good thermometer of what the herd will be doing.
Also, most Youtubers, are now cautious after the Terra disaster as lots of them were shilling Terra as the new Ethereum.
On that note, the retail investors are holding tidy their money because of what their cultist YouTubers who most likely have or either view a] or view b], are telling them.
They will wait for the BTC crash below 10k or BTC retracement alone. The majority of YouTubers are scaring people from the altcoin market, all saying BTC is the way to go.
Some YouTubers, still shill the blue ships like ETH, DOT, SOL, Link, ADA, DOGE, Shib and so on. So my take on that is that the majority of the retail will jump into the market
looking to ride the rise of those coins (BTC, ETH, DOT, SOL, Link, ADA, Doge, Shib, etc...). This brings us to an interesting point, if the majority is always wrong, the rise of those
projects is unlikely.
3 - What we call an altcoin season, is the massive rise of low-cap projects, sucking the market cap of BTC and ETH (now we can even say of all major top 5 or 10 blue ship coins).
That happened in 2017/18, therefore, that did not happen in 2021/22. Only a handful of coins reached their full Fibo extension. So we have now, coins that had their full
Bullrun and coins that did not have. My take is that, from the end of October to early February, we can possibly see an altcoin season, as it is the only scenario that will
fulfil the requirement of making the majority wrong.
4 - So this is how it should work: BTC turn bullish in 1 or 2 weeks from now and FOMO starts again. Youtubers start to go nuts and shill BTC like crazy. Some retail investors will either go all-in into BTC
or they will spread their money into ETH, DOT, SOL, Link, ADA, Doge, and Shib, expecting the past performance to repeat. Hence, those projects and BTC will not pump to new ATH, they will
in the most positive view, retrace to 80% of their previous ATH value. Here, some other projects that did not have a bull run yet (E.g. EOS, Litecoin, XRP, etc..), will be pumping hard which
will spark a FOMO into the altcoin market. The investors sitting on BTC, ETH, DOT, SOL, Link, ADA, Doge, Shib, etc... out of frustration will slowly capitulate into the other altcoins
trying to ride the wave. Even some big players will be caught pants down and throw millions into projects with no real value just to ride the wave. This whole money will keep rotating for around 3 months.
5 - After the majority of the top 300 (just guessed that one, could be more or less) coins have had their full fib extension, the whole market will crash, starting the real bear market that will last until about 2024/25.
6 - This scenario presents a BTC.D going down while its price goes up, which is another unpopular view right now as most YouTubers(cultists) are calling for a big pump on BTC dominance.
7 - It is also important to mention that, the SEC is in trouble regarding the XRP lawsuit (I do not have XRP in my portfolio). From my perspective, the SEC is set for a brutal loss that probably will bring confidence to the
the altcoin market fuelling the season, so please do not be surprised if the lawsuit finishes just within the FIFA World Cup timeframe, (coincidence?)
8 - One of the recent modern ways to invalidate someone's ideas/thinking is calling it a "Conspiracy Theory", so right now is common to see people calling other people's ideas/thinking a conspiracy theory just because they don't like it.
This is not a surprise, every person with two neurons should know that we are heading fast to a new type of dictatorship based on absolute control of what you do, enforced by technology (cameras, mobiles, Internet and so on). So it is not unreasonable to think that a bunch of powerful people set these scenarios, FIFA Cup, XRP lawsuit, and Youtubers all saying the same thing. The herd, if pleased in the right way, can be manipulated, this is how it was, how it is and how it will always be. The 1% most likely sit down together to keep or increase their power/money, why wouldn't they?
9 - The herd is louder, bigger, hysterical, violent and dangerous, but they are also lazy, immoral, hypocritical, nonsense and disloyal. If you want freedom, follow the 1%, not the herd.

TOTAL 3: Falling Wedge Projection.TOTAL 3 is represents the Total Marketcap of the entire Crypto Market Excluding ETH and BTC anD right now TOTAL 3 is trading in a small falling wedge that itself is within a bigger Descending Broadening Wedge. If TOTAL 3 can Break, Hook, and Go from the smaller wedge it's Target will then be at the Supply Line of the much bigger Descending Broadening Wedge; Rather or not it will Breakout of the Bigger Wedge and Continue up from there is to be discused when it actually gets there, but for now the Smaller Wedge target is all im looking for.

TOTAL3 Altcoins Altseason?Is it about that time now? We do we got here?
AFter perfectly hitting 0.886, the altcoin market is in a perfect position to get things going.
While holding that level, an impulse from here can do great things
A) Invalidate this (bear looking) flag to the upside
B) Surpass that long downtrend
C) Target 1.272 up to 2.618 ideally into overhead resistance
Hold my beer pls
----
No financial advice, do your own research, don't be stupid

Alt Market Cap Not Looking HealthyAlt Market Cap Not Looking Healthy
The Alt Market cap has recently broken down on market structure and retested key resistance and 200EMA 1hr. Core issue is the consolidation directly below key resistance at 356 which is looking like a dump could be incoming to me to the next supprot level at 342. It could be a little rocky for alts in the short term.

Altseason?The crypto market (Total 3 - Excluding BTC and ETH), is showing a leading expanding diagonal type structure. If we hold these lows than we should move up in the coming days/weeks.


#TOTAL3 #CRYPTO Market Cap to lose over $100 bIllion DollarsWe are in the process of breaking down any hour now!
Inverted chart is shown.
(In my view --- just an educated opinion by a experienced market speculator)
This would account for it being a near 50% haircut on the #crypto market excluding #BTC & #ETH
This last down move could be sickeningly violent and really push out many participants unfortunately.
We all can't make it speculating, that would imply a fake market.
Profit come from other peoples money unfortunately.
What #ALTS are you holding, and i will scan the chart for you upon request.

ALT Market About To BreakALT Market (Excl. BTC & ETH) is looking primed for a breakout with some narrow consolidation forming for almost a month now. Expecting a large break out coming out of this symmetrical triangle. It will be very dependant on the global macro economics and announcements to dictate this next move

Rebounce alt ?We could to except a bounce of the altcoins from here.
It could to be a great support to next resistance.

ALTCOIN Bullish idea !Here is the analysis of Altcoin Market Cap Exclude Etherium Total 3 Making Falling Wedg + making Cup With handle Chart Pattren And Recently price tapped from VAL of tool FRVP finnal W8 for break out and retest and you can see alts in bullish action ......

WEN ALT SEASON Charting TOTAL3 (alt market excluding BTC & ETH) vs both BTC & ETH looking very bullish for ALTS.
TOTAL3/BTC:
2 scenarios in Blue or Green. This is based on Elliot wave theory in which on lower time frames shows correct counts for this leading to breakout. WEN is the question?
TOTAL3/ETH:
Break the red resistance line with a retest could start a face melt on ALTS
