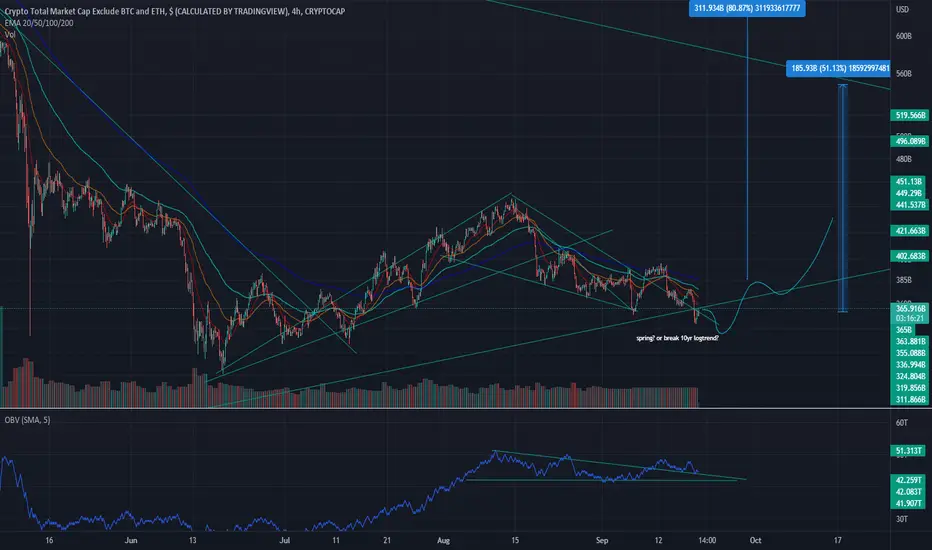
TOTAL3alts mcap no ethereum
looking like a spring to back above trendline
should see some alt releif coming 2 months or so?
otherwise its a long way down under that line..
potential for 50% ish from here if we can stop the selloff..
TOTAL3 trade ideas
this is a look at BTC ETH DeFi ALTS & S&P500 2017-Presentthis is a look at BTC ETH DeFi ALTS & S&P500 2017-Present
_(ETH GREEN NTC DARK ORANGE DeFi IS WHITE ALTS dARK pURPLE AND S&P500 IS THAT DARKER PINK)
its funny when some one argues with a, to the death mentality, that "there is no correlation with the S&P500 or other markets. Look, correlation, in it self is subjective esp in the "market context speak" we all use. All money is in some shape form, push pull, all connected. cause and effect. The goal here is to measure or guess the best we can the strength of these, "cause and effects" while anticipating human nature or stampede mentality up or/and down.
As to more direct correlation with S&P500 vs BTC or vs Crypto Market, I would say that crypto is just becoming more main stream (more and more places to trade it) and easier to access and trade. So when the market sentiment is poor and markets "in general" are dropping, well crypto has made it, we are officially one of the markets and have enough liquidly sources to be effected by these same market/financial events. (Interesting point and not sure if directly related here but in general definitely a "Crypto factor" here_ is no limit of trades you can do in a day, food for thought)
not saying that anyone is RITE or WRONG here just that< I for one >have found it more profitable to NOT paint myself into the corner of one way of rigid thinking. In this hustle, it pays to think out side the box and use what works while being willing to adapt and change esp if one day, the same thing no longer works (obsolete)
iVE FOUND 2 THINGS VERY HELPFULL WITH MY TRADING THIS YEAR. bEING WILLING TO THINK OUT SIDE THE BOX, WHILE NOT SPREADING TO THIN. IE NOT TO MANY POSITIONS. (EVERYTHING SOUNDS AMAZING AT TIMES I KNOW. ESP WHEN NEWER TO CRYPTO) Tradermayne is an amazing follow fyi out there in the crypto social media world and really helped my overall trading and understanding of the markets and how I view them. that and not reading the crypto news esp NO T and A opinions until I make my trades or decision not to trade, trade, whatever the plan, for that day... i find to many outside ideas on the market messes up my reads. one thing to get others advice and none of your own opinions or plans if you just, that day week whatever, cant get "that feel" down about the markets.
_2ND IS HAVE A GENERAL PLAN STRATAGY WHATEVER AND STICK TO IT WHILE NOT TRADING JUST "TO TRADE". hAVE A PURPOSE IN YOUR TRADES
_in short, FIND YOUR OWN STYLE THAT WORKS FOR YOUR STRENGHS AND WEEKNESSES. TAKE THE PARTS YOU LEARN AND ADAPT THIS "advice" ETC TO YOUR STYLE BUDGET AND LIFESTYLE (EXAMPLE IF IM BOARD ILL PANIC AND START SWING TRADING JUST TO TRADE BECASUSE I FEEL I SHOULD BE TRADING.FOR ME LESS TRADES I DO USSUALY THE BETTER)
for the present me and mine/THE PLAN is_TO TAKE PROFITS EVERY LEVEL AND CHANCE I/YOU GET. I FEEL THE MARKET HAS ONE MORE SAVAGE DROP IN HER AND IT WILL HAPPEN FAST. WATCH WHEN LONG POSITIONS GET TO LOPSIDED. LIKE RITE NOW WE SEE SHORTS GETTING LOPSIDED AND ONE OF THE MAIN REASONS I SEE A "BEAR MARKET RALLY" IN THE CARDS, SHORT TERM , THEN DUMP AFTER bear market rally TO CLEAR OUT AND rekt REKT THOSE POSITIONS.

TOTAL3 looks prepped for a launch anytime?TOTAL 3 weekly chart:
The Long yellow rectangle support box may
be the most important support in the entire
Market as a whole. When there is around 19,000
Alt-coin projects relying on BTC holding and this
huge monster support box holding, this is Do or
Die...Im confident in the coming 300 days,
we will see all time highs in the TOTAL 3 market.
The Green $2.674 Trillion is my Super bullish
prediction coming from measurements. and the
smaller yellow rectangles are the falling bearish
support boxes....lets hope we dont see the candles
fall lower. The RSI has never been this OVERSOLD, we honestly should be moving up
bc we are in uncharted territories and sentiment should change.

clear wolfe wave printingthe total market cap for the alts has a good chance to rally after these beautiful wolfe wave pattern .


🔥 Worst Case Scenario For Alt-Coins: Huge Risk PotentialTo start of the discussion, I want to stress that history rarely repeats itself, but it often rhymes. BTC has, thus far, lost around 85% of its value from top to bottom after every bull-cycle thus far. Can the same be said for alts?
In the previous cycle, the total altcoin marketcap (which is the total marketcap minus ETH and BTC) lost around 92% of its total value, which translates to every altcoin losing around 92% of its value on average.
Since BTC follows a boom & bust cycle with the bust being around -85%, there's a reason to believe that alts will do a similar thing. In that case, alts have another huge 70% drop ahead of them. Naturally, this would be my absolute worst case scenario for alts which could only occur when there's a total meltdown of the stock markets (like 2008).
On the other hand, I doubt it will ever get this far. There's a lot of decent alts around and investors are not flocking to BTC as fast as they did in previous cycles, hence why the BTC dominance is still this low. Nevertheless, it never hurts to explore different potential scenario's.

watch btc.d for down or up trend ie btc.d dumnps market pumpsthe bottom screen is the market cap or spot price of Eth_dark green line btc_orange line and alts _purple line
middle screen u have thicker white line DeFi dominance thiner white line DeFi spot price or market cap
AMONG OTHER FACTORS THAT ORANGE TREND LINE MIDDLE SCREEN IS btc.dOMINANCE. WE NEED IT TO DROP a few other small things to but in short we need btc.d to fall off
that middle screen is a mess but if u see btc.dominance oarange line drops and plays with white line or DeFi market cap (money getting loaded up via eth and weth ie getting ready or entering market) then you see the market up trend as btc .d falls off and the rest of the market takes control. the same will be true for down trend but reversed.
i do like how btc dominance fell off and market went short term green .... u can see earlier the opposite is true. as BTC.D gains strength it leads the way dragging the market down as the indicator rises above the other crypto indicators in the middle screen
ps sorry so messy and ill find a better way to explain this indicator HGM 0Ut_

watch btc.d for down or up trend ie btc.d dumnps market pumpsAMONG OTHER FACTORS THAT ORANGE TREND LINE MIDDLE SCREEN IS btc.dOMINANCE. WE NEED IT TO DROP a few other small things to but in short we need btc.d to fall off
i do like how btc dominance fell off and market went short term green .... u can see earlier the opposite is true. as BTC.D gains strength it leads the way dragging the market down as the indicator rises above the other crypto indicators in the middle screen

TOTAL3 chart "ALTs" shorter time frame lookTOTAL3 = (Total 3 chart or crypto market cap minus BTC n ETH ie ALTs)
I like how the middle indicator is dragging down that orange line or BTC.Dominance... we need the market to spread money out not HODL it in the main liquidity spots like BTC n BTC backed holdings like stable coins n n in some cases 3 or 4 steps out of crypto exchanges etc.
in short for this TOTAL3 chart we need to smash 420 to 460 could run at least short term if we see this chart break 460s n run to 550s
for that to happen we would need to see_
/BTC 22500 to 2400
/ETH 1660s to 1735
n want to see decisive break
through 1750 at that ie eth the key the gateway, the on n off ramp into the crypto alt game and beyond
/rejections or negative look at these levels singles short term esp.....> G3Ts 0Ut...
TOTAL 3 weekly still looking bullish overallTOTAL 3 weekly chart:
The Long yellow rectangle support box may
be the most important support in the entire
Market as a whole. When there is around 19,000
Alt-coin projects relying on BTC holding and this
huge monster support box holding, this is Do or
Die...Im confident in the coming 300 days,
we will see all time highs in the TOTAL 3 market.
The Green $2.674 Trillion is my Super bullish
prediction coming from measurements. and the
smaller yellow rectangles are the falling bearish
support boxes....lets hope we dont see the candles
fall lower. The RSI has never been this OVERSOLD, we honestly should be moving up
bc we are in uncharted territories and sentiment should change.

TOTAL 3 on the verge of ALTSEASONTotal 3 on the verge of breaking the downtrend for real.
On the first attempt, total3 failed and it resulted in a brutal drop.
Lets see if it can R/S flip this time. If so, a strong run into overhead resistance is to be expecting shooting some alts towards moon.
Failing again here will result in another bloody drop.
Hold my beer pls
----
No financial advice, do your own research, don't be stupid

Crypto Currencies go to DownTrendWhen you look at TOTAL3 chart, you can see a divergence between RSI and TOTAL3. and another thing is TOTAL3 breaks a short term up-trend line and it looks that it want to goes down and touch long term up-trend line.
CRYPTOCAP:TOTAL3

Cautious total market cap 1D Be careful if we break the trend line (return inside) and failed to re test i think we will go to 395b-392b support and that’s will effect on alts , so put your stop losses , and i think we will hold the support if we break 391b the we will go the bottom of the trend also we didn’t claim a clean breakthrough above the trend.
Happy trading and I’m happy to receive your thoughts.

Total 3 is the best representation where we are in the bearIn my opinion we are half the way down on total 3. We have another 6 months of straight down in alt coins. Be careful, take profits if you have them, dont be greedy because you could see new low in your favorite alt coin literally next month.

I expect a good weekendA small video so not much to type.
As expected, Week 27 is being repeated:
Weather this weekend is prognosed to be nice, wishing you a Great one.
One Love,
The FXPROFESSOR

WEEK 27 Could be RepeatedA good Monday followed by a dip on Tuesday....
This is the situation as of the moment this week (week 32 of the year 2022).
The resemblance with 5 weeks ago (week 27 of the year) could indicate a Pump could be next.
At the same time there is a nice S/R level which indicates support could be now for Crypto market.
Let's not forget the CPI data tomorrow which will add to the volatility. Hopefully (and most likely I believe) to the North side.
This could be a good dip to buy but don't take my word for it. DYOR
One Love,
The FXPROFESSOR

Mondays are Red🩸 Ends are Weak💤 Yet we Rise✔️Wishes for a nice weekend everyone.
Weekend are the end of the week and I am guessing you had figured that out already.
70% of the last 10 weeks Crypto had a boring 'weak' end on Saturdays and Sundays (the weekend).
At the same time, 6 out of 10 Mondays were in deep red colors with the market having it's worst days during the beginning of the week.
Yet again the Crypto Total Market Cap (excluding BTC and ETH( has risen around 30% since June 18 lows.
Why is that?
Well, maybe Retail investors like most of the people here are out of buying power and we depend on (mostly US) institutional money to kick in and buy something.
Maybe again it's the summer and weekends are meant to be spent on the beach.
A friend from Romania says it's the 'Market makers weekend' and that they 'Pump and Dump' to liquidate bored retailers while they are having Mojitos on the beach🍹🌞.
(I don't know about that but it's worth mentioning. Salut Marius!)
What do you think? Is there a pattern we can trust (buy mid week and sit out at the end?)
In any case Professor is hoping for a PUMP.
We want our Weekends back Crypto!
One Love,
the FXPROFESSOR
Ps. If we had bought the Monday dips we could had retired already 🍹

TOTAL3 is looking very bullishTOTAL 3 weekly chart:
The Long yellow rectangle support box may
be the most important support in the entire
Market as a whole. When there is around 19,000
Alt-coin projects relying on BTC holding and this
huge monster support box holding, this is Do or
Die...Im confident in the coming 300 days,
we will see all time highs in the TOTAL 3 market.
The Green $2.674 Trillion is my Super bullish
prediction coming from measurements. and the
smaller yellow rectangles are the falling bearish
support boxes....lets hope we dont see the candles
fall lower. The RSI has never been this OVERSOLD, we honestly should be moving up
bc we are in uncharted territories and sentiment should change.


A Downtrend Could Happen, Time to CUT Altcoins - Cryptoz18❶ Warning
Operations in the Blockchain or FX market represent a high risk. Cryptoz18 is a content creator who posts his ideas for viewers however he never provides an investment recommendation. I recommend to the reader a good risk management and knowledge regarding the environment. Thank you very much.
❷ Tutorials
➤ Here you can find a brief explanation of how the operations work in case you are interested in following them.
➤ Here you can find an explanation of how to track our ideas:
✔️ Our operations are taken with StopLoss and Take Profit of 15 minutes. However, we are looking to try and catch a 4H trend. So, once we touch the TPM according to your own analysis you should consider whether to close the trade or move StopLoss to entry.
❸ Summary
First, I have to open my trades on Binance, if not then I don't have time. Sadly it took me a long time and a lot of the movement just happened, if it doesn't go back to that entry consider changing the setup settings.
❹ Operational Information
• Entry price: 392.324B
• StopLoss: 397.329B (Loss 1.28%)
• TakeProfit Minimum: 385.36B (Win 5.41%)
• Recommended margin: 5% of the Futures account
• Recommended leverage: 1x.
• Temporality: 15Min - 4H

#TOTAL3 MARKET UPDATE !!Hello dear traders, we are new here so we ask you to support your ideas with your LIKE and COMMENT, feel free to ask any questions in the comments, and we will try to answer for all, thanks, Friends.
#TOTAL3 Update!
Welcome to Total3 Market Cap Update. Total3 generally refers to the market cap of all Altcoins accepting BTC and ETH.
Total3 Here an inverted head and shoulders pattern is formed that has bounced off and remains a bull flag pattern where a breakout of the neckline is still pending.
Once it breaks the neckline we will see a pretty decent rally in Altcoins.
I am expecting a bullish rally in Alts in the month of July and August. I'm just waiting for this neckline to break. Let's see how it turns out.
Remember:- This is not a piece of financial advice. All investments made by me are at my own risk and I am held responsible for my profits and losses. So, do your own research before investing in this trade.
Sorry for my English it is not my native language.
If you like it then hit the like button and share your chart in the comment section.
Thanks.

TOTAL3 weekly is getting even more bullish!look how the Convergence and
divergence with the Price action
and RSI move together...this is an
example of how charts work...we
have never been this oversold...
big things ahead for the ALT coins.

ALTS WILL PUMP SOON AFTER A LITTLE PULLBACK!!Hello everyone, if you like the idea, do not forget to support with a like and follow.
Welcome to this Alt M.cap AKA Total3 update.
Alt m.cap is trading inside a symmetrical triangle in the daily time frame and currently facing some resistance as the triangle's upper trendline. I'm expecting some pullback from here. I'm not opening any long positions now. Either I'm waiting for a pullback or if it breaks out from here, I'm taking some long positions.
Let's see how this goes.
If you like this idea then do support it with like and follow.
Also, share your views in the comment section.
Thank You!
