Altcoins, Crypto is different since institutions came inHow long have we been saying this? Yet the masses have not grasped this concept. Neother have influencers. But that makes sense because they need clicks to survive. People tend to "graze" where pasture seems greener, even if it isn't.
CRYPTOCAP:TOTAL 3 = NO CRYPTOCAP:BTC or CRYPTOCAP:ETH
Altcoins have been in a steady incline since Nov 23.
Daily
The last 2 consolidation phases lasted AROUND 6 months, depending on where you begin the consolidation phase.
Weekly
Not important going further as Crypto landscape has changed & the back data is irrelevant. However, let's be nosey & see how it looks in comparison.
TOTAL3 trade ideas

Total 3, do flags point to the target area?Welcome back dearest reader,
Today i have a very interesting analysis for you, quite some valuable time was put into this.
What i've noticed is the following:
-From april 2021 untill july 2021 total 3 has been trading in a bullish wedge flag, when we continue the lines on the full candle bodies the apex pointed to the top of that flag durationwise
-August 2022 till october 2023, extend the trendlines, apex march 2024, look up. Oh.
-March 2024, october 2024 --> apex december 2024, look up. Oh.
Now:
-January 2025, april/may 2025, apex june 2025, look up. Oh.
-I used the fractal from july 2021 as i think we're in this period
-Upward sloping channel from october 2022 untill now could provide insights as to what the target price might be, HH and HL
Target: 1.5T
Also check out my BTC.D idea, these would coincide perfectly
~Rustle
Is it certain this will happen? No-one has a glass ball, all we have are patterns based on past performance, this is no guarantee. But it does look good.

Altcoin Market Update – April 24, 2025As of today, the TOTAL3 Index (excluding BTC & ETH) offers key insights into the altcoin market:
⸻
Technical Overview:
• 1D: -1.54% → Minor pullback
• 1W: +6.37% → Bullish momentum
• 1M: -4.14% → Mid-term correction
• 6M: +32.94% → Strong growth
#TOTAL3 remains above $790B, a critical support. Holding this level is vital for future altcoin rally targets like $1.16T and beyond.
Bullish divergence on the TOTAL3/BTC chart hints at altcoins gaining strength over BTC.
⸻
Fundamentals:
• The global crypto market cap is $3.03T
• BTC & ETH dominate, but TOTAL3 reflects altcoin potential
⸻
Summary:
Altcoin market remains optimistic, with solid long-term signals. Keep an eye on support zones and momentum indicators for your trading strategy.

$Total3 alts about to go on their biggest run yet to $2.2T+I know everyone's been extremely down on crypto because alts have been down, but the chart looks very bullish from the lows.
As you can see, we've been consolidating in a channel and it looks like we're set to fall to the $448B - $581B region. After we find support there, we'll start the biggest leg of the cycle thus far.
I think it's very likely that we'll make it up to the $2.2T region during the next run. For context, the entire crypto market is sitting at $2.5T right now. That means alts alone should nearly equal the entire crypto market by the end of this cycle.
However, there's a possibility that the cycle can extend higher to the upper resistances as well.
Let's see how it plays out over the coming years. Lots of money to be made on the upside here.
This run will be the equivalent to getting into bitcoin early.

Beautiful TA played out. That was initiation for many Alt LONGsLook at this TA from 2 days ago, then you will understand my Alt LONGs.
Despite BTC D. made higher highs, but Alts moved up too.
7.5 % till now🎯 👌 😎
In Update, I will paste the Alts LONGs ;).
Original TA from 2 days ago:
Follow for more ideas/Signals.💲
Just donate some of your profit to Animal rights or other charity :)✌️

TOTAL3 Set to Explode: Altcoin Season Incoming? (12H)TOTAL3 refers to the total crypto market cap excluding Bitcoin and Ethereum.
The correction of TOTAL3 started from the point where we placed the red arrow on the chart.
It seems to have formed a triangle, and wave C now appears to be complete.
As long as the demand zone holds, it can move up toward the supply box and complete wave D.
After hitting the red box, a drop is expected for wave E — followed by the main bullish move.
Altcoins seem ready for a strong move; let’s see how it plays out.
A weekly candle close below the invalidation level will invalidate this analysis.
For risk management, please don't forget stop loss and capital management
When we reach the first target, save some profit and then change the stop to entry
Comment if you have any questions
Thank You

$TOTAL3 Breakout Altcoins breakout loading?
TOTAL3 (Crypto market cap excl. BTC & ETH)
breaking out of a falling wedge.
Target: $1.16T +51%
All-time high in sight. 👀

#TOTAL3 #Analysis #Eddy#TOTAL3 #Analysis #Eddy
Crypto Total Market Cap Excluding BTC and ETH
Everything is clearly drawn and labeled.
For buy Long & Spot investment on altcoins, wait for the Total 3 index to reach its demand zone.
This is just my opinion and you should make your decision based on your style and strategy and get the necessary confirmations.
Be sure to take a look at this indicator on the monthly time frame.

Total3 blueprintexpect the overall market to follow this.. CRYPTOCAP:TOTAL , CRYPTOCAP:BTC etc... Everything is going as expected!

TOTAL3 update - April 11 2025TOTAL3 index which represents altcoins has seen some 40% drop since December and as we all saw many altcoins got crushed under heavy sell pressures.
Now since bullish confluences can be seen on the chart, it is likely to see TOTAL3 moving towards higher levels in the coming weeks. This means a good upward move in many altcoins.
The trigger for the said scenario is when the index crosses above the descending blue trendline. (TOTAL3 might even rise above the December high.)

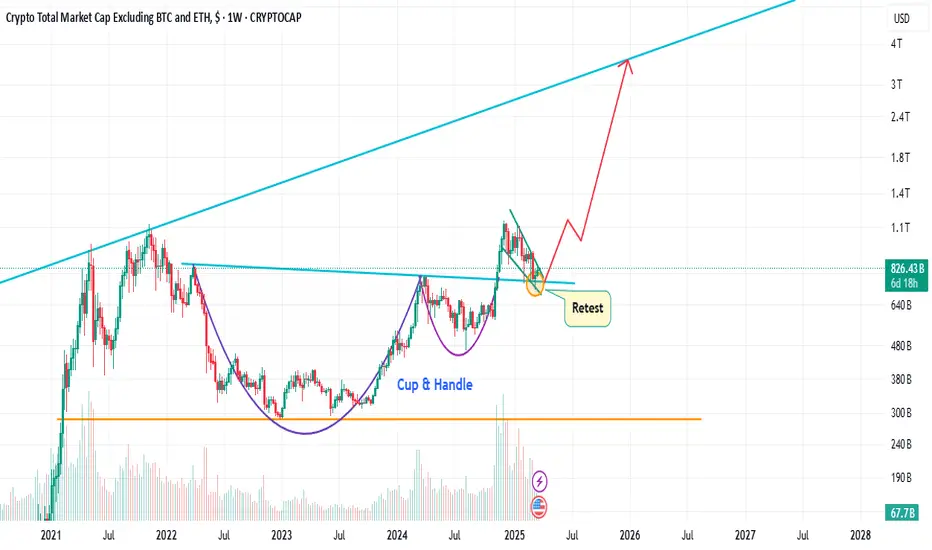
Total 3 targeting 1.5TWelcome back dearest reader,
This is going to be a short one, all information is in the chart above.
Total 3 has been in a Massive Cup and handle formation.
Measured from the base of the cup till the top of the handle gives us a ''total 3'' price target of 1.5T$ which is 100x from here. If you were to do a different analysis and like flags more then we come to the same price target of 1.5T$ (Blue bars).
Price action is now retesting resistance from march 2024 as support. When this is done i expect blast-off mode.
~Rustle

Buy almost AltcoinsDo not buy alts now but almost buy alts after the next fake pwamp
NFA
Watch date:
6.18
GN.

TOTAL3 UPDATE!!! GET YOUR ALTS BAGS READY !!TOTAL3 has reached PRZ zone of bat pattern aligning with elliott wave count. Frrom here we may see major shift in alts. Get ready for the ultimate altseason boyz!!!

ALTCOIN EXPLOSION: THE $1.7T MEGA CYCLE APPROACHING🚀 for more details FOLLOW ME AND READ BELOW 🚀
📊 What We're Seeing
This chart reveals an extraordinary pattern forming in the crypto market excluding BTC and ETH. We're witnessing the completion of a textbook cup and handle formation that has been developing since 2022. The market currently sits at $764.97B, having formed the handle portion of this powerful bullish pattern.
⏰ The 10-Day Countdown
In just 10 days, we're likely to see the start of an explosive bull run that could reshape the entire crypto landscape. This isn't just another pump – the technical formation suggests a sustained movement that could push the altcoin market cap to unprecedented heights.
🎯 Target: $1.74 Trillion
The projected "MARKET EXIT" point sits at an eye-watering $1.74T – representing a potential 127% increase from current levels. This would far exceed the previous high of $1.16T seen in the last cycle, confirming a new era for alternative cryptocurrencies.
🔍 Why This Pattern Matters
The cup and handle is one of the most reliable patterns in technical analysis. What makes this one special is its multi-year formation, suggesting enormous accumulated energy. The rounded bottom (2022-2024) shows steady accumulation, while the recent handle represents the final consolidation before liftoff.
🌊 Historical Context
Looking back to 2021-2022, we saw a similar run-up, but without the mature technical foundation we have now. This time, the market has spent over two years building this structure, suggesting a more sustainable and potentially more powerful movement ahead.
💡 Sectors To Watch
This coming wave will likely lift:
- DeFi 2.0 platforms with actual revenue models
- Real-world asset tokens gaining institutional adoption
- AI-crypto integration projects
- Gaming tokens with established user bases
- Layer-2 scaling solutions with growing ecosystems
⚠️ Risk Management
While the pattern is compelling, smart traders should:
- Set trailing stops to protect gains
- Consider laddered exits starting at $1.4T levels
- Watch for volume confirmation as the handle breaks upward
- Monitor Bitcoin's behavior, as extreme BTC volatility could temporarily disrupt the pattern
🧠 Final Thought
We appear to be standing at the threshold of the largest altcoin expansion in crypto history. The mathematical projection, historical context, and current market structure all align to create this rare opportunity that only presents itself once every market cycle.

Altcoins' Market Cap is About to Reclaim $1 Trillion..!Hello Traders 🐺
In my last idea about Altcoins' total market cap, I talked about the midterm price targets. Now, in this idea, I want to focus on the short-term volatility. As you can see in the chart, the price is already in a falling wedge pattern, and the target of the falling wedge is the top of the wedge. This means we are about to see a nice bounce in Altcoins, which could break BTC.D's upward movement and lead to a bigger correction.
In my opinion, in this case, we can also treat this pattern as a bull flag, and the target will vary accordingly. If you want to know more about the price target for TOTAL3, you can check my previous idea, where I also mentioned my final price target for this Altcoin Season. I hope you enjoy this idea! Don’t forget to like and follow! 🚀🔥
🐺 KIU_COIN 🐺

Totall Hi friends, it's looking good for future of total 3 and Altcoins Rally.
Are U Agree with Me ?!

Total market cap crypto
Today (03-03-2025) the market cap market is panic selling after the 10% Trump tariff.
And then lets see the market if support fibo 0.5 break then we can watch and wisely.

Alt DominanceThis chart represent all the altcoins against btc. Basically its alt dominance. The true alt season is lined up to happen very soon. All you need to do is buy when price tags the green descending trend support. Once the falling wedge runs out of space we go parabolic.

TOTAL 3 At Support BUY Whatever You want!! Total 3 at support and 0.66 fib , Golden area of fib which can give a bounce to alts coin in next couple of Month. Our Target is April, may and june for the pivot exit.

Altcoin Engines Are Warming Up... Are You In ?!Hello Traders 🐺
Finally... After such a long wait, we’re here. I mean it—we’ve been waiting for this exact moment, and now we can finally say: It’s time to fasten our seatbelts, because this pattern could be the one that prints millions! 💸
🗣 But Why Am I Saying This?
Let me break it down for you one last time, because over the last two months, I’ve been shouting: "BUY ALTS!" — and most people replied:
"Nah bro, this time is different. We won't get an Altcoin Season."
But here’s the truth: It’s never different!The market cycle is always the same—it just takes time to play out. 🔁⏳
📈 The Pattern That Changes Everything:
On the chart, we have a perfect Cup & Handle pattern, and the price is already trading above the neckline, which is a great sign. But here’s the real kicker:
Price is now forming a bull flag just above the support line — and we’re on the verge of a breakout at any moment! ⚡️📊
🎯 Price Targets:
First Target ➜ Around the ATH (~1.12T), which also matches the top of the wedge if you consider this pattern as a falling wedge.
Cup & Handle Target ➜ Approximately 2.32T – a major level to take partial profits
Altseason Final Target ➜ Around the monthly upward resistance (~3.5T) – this is the macro target for this bull run! 🔥
I hope you enjoyed this idea! Make sure to like and follow for more insights and support along the way. Let’s ride this together.
🐺 Discipline is rarely enjoyable, but almost always profitable 🐺
KIU_COIN
When altseason? Very soon! But then major market crash end 2025.Here is my vision of the Total-3 market cap (all crypto market excluding BTC and ETH). Altseason preliminary in 2 big waves till September-October, and then market crash -90..95% during next year.

Avoid 99% of altcoinsIf you're not getting cash flow from your crypto portfolio, read this.
Stop holding altcoins that don't
1. Generate actual revenue in USD
2. Share revenues with holders
3. Treat their community with respect
If any of your bags are in this category, get rid of them NOW before it's too late.
You are likely holding vaporware, a.k.a fake tech, and you will probably lose a lot of money if you haven't already.
I always remind my students of this risk as early in my coaching program as possible because this is the Number 1 problem retail investors face.
I mean, just look what happened to the top 100 coins, including CRYPTOCAP:ETH , CRYPTOCAP:SOL , and CRYPTOCAP:XRP , when CRYPTOCAP:BTC dipped recently. 👇
If this thread helped you, hit that like button and retweet to help others, too!
@CryptoJayTrades

Altcoins are ready for the next pump ?🤡 Despite many laughing at my confidence in altcoins, I’m still holding my bags tightly. And honestly, there hasn’t even been a great opportunity to take profits yet… 😅
But here’s a scenario that I still see as possible and truly believe in. 👀
When Gold corrected for two months after its new ATH in early 2024, was there a single person shouting that it was over and there would be no new rally? I don’t remember that. 🤔
The same goes for alts - after the Total Market Cap (exc. BTC and ETH) set a new high, we’ve spent just three months in a deeper correction (-35% compared to XAU's -8%) while still maintaining an overall uptrend. 📈
With most alts dropping 50-70%, I believe we’re more likely to see a new rally soon rather than a full reversal into a bear market. ❌
Every time people say there won’t be an altseason, it always comes. 💯
